Sample Category Title
USDJPY Intraday Bearish Below 112.20 Level
The U.S dollar remains visibly weaker against the Japanese yen currency, as we finish the last full-trading day, ahead of the start of the Thanksgiving holiday in North America. Price-action is currently hovering around the 112 handle, after the pair was strongly rejected from the 112.50 zone in Tuesday trading. The USDJPY pair remains under pressure heading into the U.S session, despite buoyant global markets, an upcoming U.S rate hike and stable U.S treasury yields.
The USDJPY pair remains intraday bearish while trading below the 112.20 technical level. Further losses towards the 111.93 level and the pairs 200-day moving average, at 111.71 seem likely.
Should price-action move above the 112.20 level, buyers may start to push the pair towards the 112.47and 112.80 resistance points.
U.K Budget Next, FOMC Minutes Later
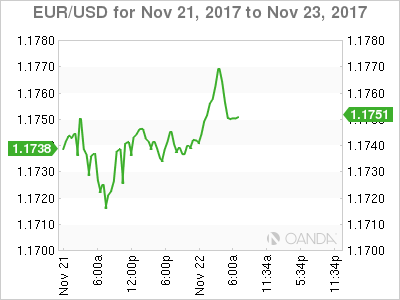
The dollar is a tad weaker across the board after current Fed Chair Janet Yellen warned against rapid rate hikes, while the EUR (€1.1753) gained amid possible new moves to end Germany's political impasse.
For Germany, options include new elections, but recent polls suggest that could result in another deadlock. Other possibilities are a minority government or an alternative coalition.
Note: There are rumors that Chancellor Merkel's party is betting on a revived alliance with the Social Democrats to dodge the risk of new elections. So far, the ‘single' unit is little concerned given the solid German and eurozone economic growth.
This morning's U.K budget could be a low-key affair for the pound (£1.3245), especially when compared with the U.K/E.U meeting this Friday. This meeting is likely to reveal whether Britain's upgraded offer will unblock trade negotiations.
1. Stocks winning ways
Global stocks are adding to what's been a stellar year for equity returns amid optimism about global growth and company earnings.
In Japan, the Nikkei share average rallied to a near two-week high overnight, supported by gains in large-cap stocks and financial companies as global growth hopes lifted the mood across world markets. The Nikkei ended +0.5% higher, the highest closing level since Nov. 10, while the broader Topix gained +0.3%.
Note: Japanese markets will be closed on Thursday for a national holiday.
Down-under, Australia's S&P/ASX 200 Index rose +0.4%, while South Korea's Kospi index added +0.3%.
In Hong Kong, the Hang Seng index ended above the psychological +30,000 points for the first time in a decade, amid signs Chinese investors are stepping up buying of domestic stocks. The Hang Seng Index jumped +0.8%, while the China Enterprises index rose +0.71%.
In Europe, regional indices trade mostly higher in quite trade, with the exception of the DAX, which trades slightly lower, unlike the FTSE, which is a tad higher ahead of the U.K budget today.
U.S stocks are set to open in the ‘black' (+0.1%).
Indices: Stoxx600 +0.1% at 388.4, FTSE +0.3% at 7432, DAX -0.2% at 13141, CAC-40 -0.1% at 5362, IBEX-35 +0.5% at 10038, FTSE MIB +0.3% at 22389, SMI +0.2% at XXX, S&P 500 Futures +0.1%.
2. Oil spikes higher on Canada pipeline woe, gold steady
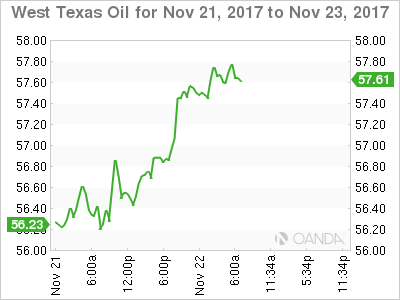
Ahead of the U.S open, oil prices have spiked with U.S light crude hitting highs not seen in two-years after faults on a major pipeline dented Canadian deliveries to the U.S, where crude inventories were also reported to be falling.
U.S light crude (WTI) has hit a high of +$57.98 a barrel, up +91c overnight, while Brent crude is up +48c at +$63.05 per barrel.
The jump is due to an announcement that there has been an +85% cut in the amount of oil TransCanada Corp will deliver to the U.S on its Keystone pipeline through the end of Nov.
Also supporting prices is the fact that U.S crude stocks are also falling. API data in its weekly report yesterday showed that weekly stocks have dropped by -6.4m barrels in the week to Nov. 17.
Note: The latest official U.S production and inventory data is due later this morning (10:30 am EDT).
Outside of North America, markets have been supported by an effort led by the OPEC to end a global supply overhang by restraining output.
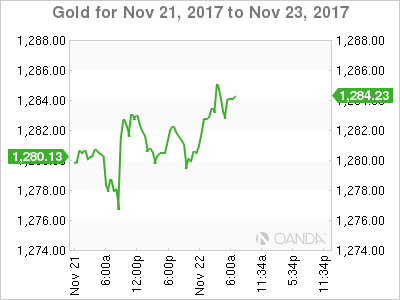
Gold prices are a tad firmer amid a mixed dollar, with investors remaining cautious ahead of the release of today's FOMC minutes from the last policy meeting, which could offer hints on the outlook for the Fed's monetary policy. Spot gold is up +0.2% at +$1,283.21 per ounce.
3. U.S yield curves flatten further
The fixed income market has been showing that traders are more concerned that the U.S economy may slow, with the spread between short and long dated securities tightening to its narrowest level in a decade (2/10's spread is at +59 bps).
Note: U.S 2/10-years has narrowed -20 bps so far this month, and is at its tightest level since October 2007. The yield on 10-year Treasuries declined -1 bps to +2.35%.
Outgoing Fed chair Yellen has warned this week that tightening too quickly risked stranding inflation below the Fed's desired +2% target. The market is waiting for the release of today's FOMC minutes for more clues about the Fed's policy path (2pm EDT).
Elsewhere, Germany's 10-year Bund yield has advanced +1 bps to +0.36%, while in the U.K the 10-year Gilt yield has fallen -1 bps to +1.292%.
4. The ‘big' dollar range trading
The EUR is +0.2% up against the U.S dollar at €1.1753 as improving eurozone growth takes precedent before political issues in Germany. Chancellor Merkel said she would rather have another election than form a minority government.
In the U.K, GBP/USD rises to its highest in nearly three weeks at £1.3268 – up +0.25% on the day – on reports that PM Theresa May is preparing to double her offer for a Brexit “divorce” settlement. Although this offer would still be below what the E.U has demanded, it raises some optimism among investors that Brexit talks may be able to progress toward discussing a trade deal and reason why it trumps today's U.K budget.
USD/JPY (¥112.06) tested below the ¥112 level after UN Command official stated that North Korea violated Korean War armistice last week when it fired on defecting soldier at demilitarized zone.
5. Fed minutes to give hints on officials' mood ahead of final meeting
The Fed at its last meeting held short-term interest rates steady, but gave a more favorable assessment of the economy.
Today's FOMC minutes (2 pm EST) should shed more light on officials' views ahead of their final policy gathering in mid-Dec., when the central bank is expected to raise rates.
To date, officials have done little to dissuade high market expectations of a rate increase in a couple of weeks, so they might see no need for the minutes to send a strong signal about the timing of their next move.
Officials' views on inflation will be crucial to their decision on whether to hike next month, as well as for the path of policy next year. Minutes from the Fed's September meeting showed that lingering questions over inflation were driving a split among officials.
Yesterday, Ms. Yellen said she is “keeping an open mind” about inflation since “it may be that there is something more endemic or long-lasting here that we need to pay attention to.”
Technical Outlook: USDTRY Hits New All-Time Low
The Turkish lira remains under strong pressure and posted new record low against the dollar at 3.9814 on Wednesday.
Fresh lira's weakness dragged Turkish stocks significantly lower and consumer confidence fell to yearly lows.
No relief seen for lira in the short term which increases risk of further easing.
Strongly overbought daily / weekly studies are for now ignored and the pair may extend towards psychological 4.00 barrier before entering consolidative phase.
Overall bearish sentiment could push the price above 4.00 for test of 4.0720 (Fibo 123.6% projection of the upleg from 3.3883) in extension.
Rising daily 10SMA continues to track the advance since mid-Sep and marks solid support at 3.8938.
Res: 3.9814, 4.0000, 4.0500, 4.0720
Sup: 3.9511, 3.9414, 3.9131, 3.8938
AUDJPY Oversold Below 200-Day Moving Average, Bearish In Short And Medium-Term
AUDJPY followed a downtrend after it posted a two-year high at 90.28 in September, going all the way down to a five-month low of 84.74 and crossing below the Ichimoku cloud and the exponential moving average lines (EMA). Risk to the downside remains in the short and medium-term according to technical indicators.
The pair is currently bearish and is likely to extend its downleg in the short-term. The RSI is also located in bearish territory below 50 but has entered oversold area for the first time since April, hinting that the price might move to the upside for a while before it resumes its downtrend (In the 1-hour chart, RSI is bearish but points to the upside).
If prices continue to fall, an immediate support is likely to emerge at the 84.00 psychological level, which has been approached as a resistance in the past. From here, the pair would see the 78.6% Fibonacci at 83.57 before it targets the six-month low at 81.77.
Otherwise, the pair would find a strong resistance at the 50% Fibonacci at 86.00, meeting the 50-day EMA as well. Any violation of this point would accelerate upside momentum towards the 50-day EMA and the 38.2% Fibonacci of 87.00. This would shift the short-term bias from bearish to neutral. Steeper increases could also meet the two-year high of 90.28.
Turning to medium-term outlook, the pair is bearish given that it is trading below the 200-day EMA. MACD gives another bearish evidence as it is negative below its signal line.
In the bigger picture, though, the pair is bullish to neutral as the bullish cross between the 200-day EMA and the 50-day EMA is still intact but the 50-day EMA is negatively sloping while the 200-day EMA has flattened.
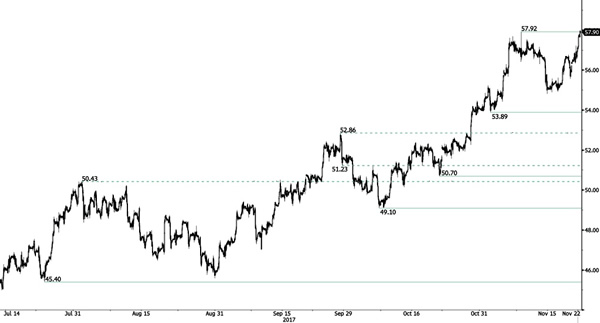
CRUDE OIL Bullish Pressures Continue
Crude oil has finished its consolidation and is now ready to challenge again its 1-year high. Expected to show further short-term bullish increase. Indeed the technical structure has a history of decent consolidation phase.
In the long-term, crude oil has recovered after its sharp decline last year. However, we consider that further weakness are very likely. For the time being the pair lies in an upside momentum. Strong support lies at 35.24 (05/04/2016) while resistance can now be found at 55.24 (03/01/2017 high).
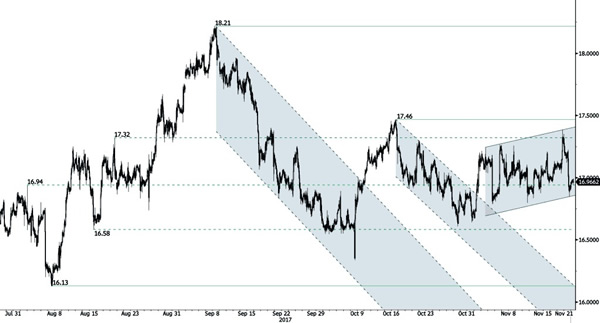
SILVER Bouncing On Uptrend Trendline
Silver is heading higher. Hourly support can be found at 16.60 (27/10/2017 low). Hourly resistance is given at 17.46 (13/10/2017 high). Additional support can be found at 16.13 (06/10/2017 low).
In the long-term, the trend is rater negative. Further downsides are very likely. Resistance is located at 25.11 (28/08/2013 high). Strong support can be found at 11.75 (20/04/2009).
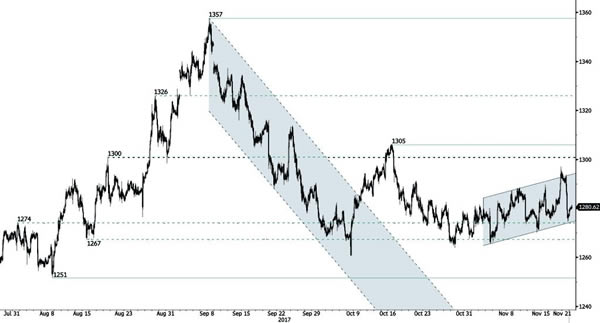
GOLD Bouncing On Rising Trendline Support
Gold is pushing higher. The technical structure confirms the end of the consolidation phase. Support lies at a distance at 1251 (08/08/2017 high). Resistance is located at 1288 (20/10/2017).
In the long-term, the technical structure suggests that there is a growing upside momentum. A break of 1392 (17/03/2014) is necessary ton confirm it, A major support can be found at 1045 (05/02/2010 low).
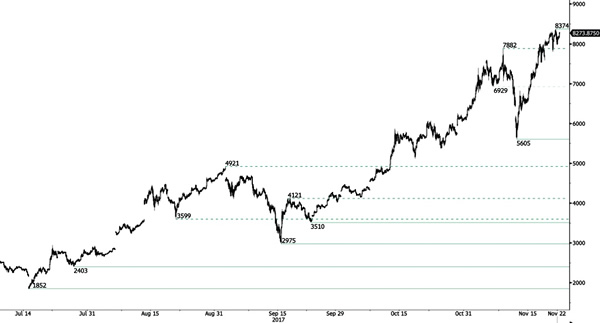
BITCOIN Ready For Another Upside Move
Bitcoin has broken the $8000. The technical structure shows a tremendous positive shortterm momentum. Hourly support is located at 5605 (13/11/2017 low). Strong support stands very far at 2975 (22/08/2017 low). In the shortterm, the digital currency should continue rising.
In the long-term, the digital currency has had an exponential growth. There are decent likelihood that the asset will reach $10'000.
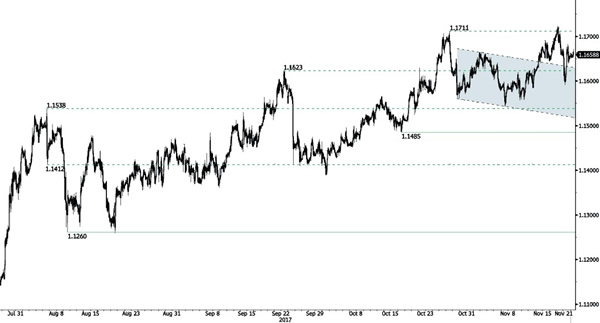
EUR/CHF Sideways Price Action
EUR/CHF is trading mixed between resistance at 1.1711 and support is given at 1.1610 (27/10/2017 low). Expected to show continued sideways move.
In the longer term, the technical structure has reversed. Strong resistance is given at 1.20 (level before the unpeg). Yet, the ECB's QE programme is likely to cause persistent selling pressures on the euro, which should weigh on EUR/CHF. Supports can be found at 1.0184 (28/01/2015 low) and 1.0082 (27/01/2015 low).
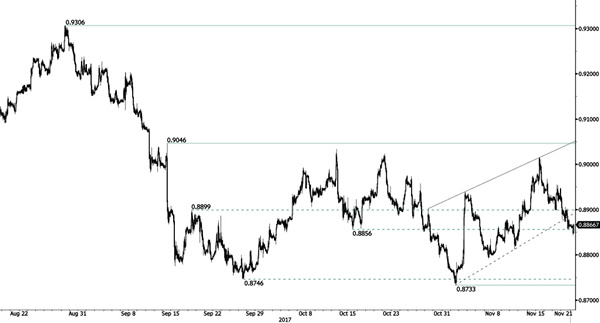
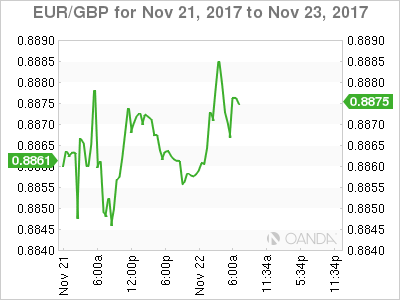
EUR/GBP Wide-Open For Further Downside
EUR/GBP was rejected from rising trendline showing an aggressive reversal. Hourly support is given at a distance at 0.8733 (01/11/2017 low). Next resistance is located at 0.9014 (27/10/2017 high). Expected to go lower.
In the long-term, the pair has largely recovered from recent lows in 2015. The technical structure suggests a growing upside momentum. The pair is trading above from its 200 DMA. Strong resistance can be found at 0.9500 (psychological level).