Sample Category Title
XAUUSD Analysis: Drops By 1.27%
Growing fears about inevitability of snap parliamentary elections in Germany led to appreciation of the Dollar against basket of currencies, including the yellow metal.
In result of this downfall, the exchange rate reached and made a rebound from the bottom edge of a senior ascending channel. As market sentiment remains 56% bullish, traders are expected to make numerous attempts to push the pair through all three moving averages and return it to the pre-fall 1.293.00 level. However, without similarly strong impulse this recovery is likely to be delayed until tomorrow. In this sense, declaration of North Korea, as a sponsor of terrorism, barely helped the pair to break through the monthly PP at 1,279.41.
USD/JPY Elliott Wave Analysis
USD/JPY - 112.45
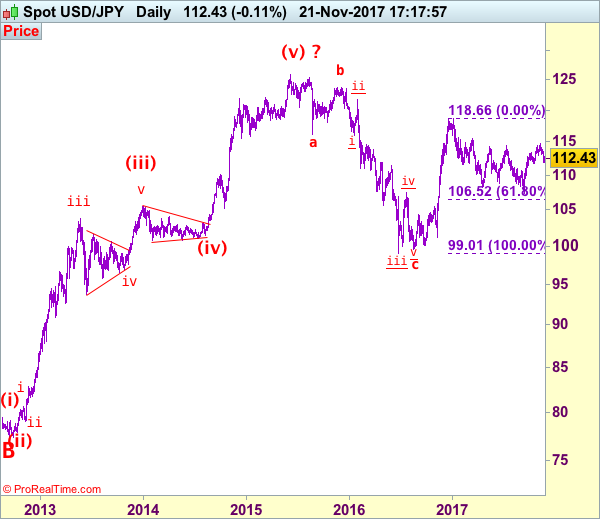
USD/JPY – Wave V of larger degree circle V has possibly ended at 75.31 and major correction has commenced and already met indicated target at 125.00.
Although the greenback dropped again since last week, as this move from 114.74 is still viewed as retracement of recent upmove, reckon downside would be limited to 111.85-90 and previous support at 111.65 should hold, bring rebound later, above 113.30-35 would suggest low is possibly formed, bring test of resistance at 113.91 but a daily close above this level is needed to retain bullishness and signal the pullback from 114.74 has ended, bring further gain to 114.05-10, then retest of 114.74 which is likely to hold from here. Looking ahead, above said resistance at 114.74 would extend recent upmove to 115.00, break there would signal the correction from 118.66 top has ended earlier at 107.32 and the rise from there may bring further gain to previous resistance at 115.51.
Our preferred count is that, triangle wave IV (with circle) ended at 101.45 and the circle wave V brought dollar down to the record low of 75.31 in 2011 and the subsequent rebound signal major correction has commenced with A leg ended at 84.19, followed by wave B at 77.14 and impulsive wave C is now unfolding (indicated upside target at 125.00 had been met) for gain towards 127.00 level. In the event dollar drops below support at 99.01, this would confirm medium term decline from 125.86 top (2015 high) has resumed for subsequent weakness to 98.00 and possibly 97.00.
Under this count, this wave C is unfolding as impulsive waves with (1) (2), 1 2 ended at 80.67, 79.07, 82.84 and 81.69 respectively, hence the extended wave 3 has ended at 103.74 and wave 4 correction of recent upmove should bring weakness to 92.57, then towards 90.88 but psychological support at 90.00 should limit downside and bring another rally later in wave 5, indicated target at 125.00 had been met and gain to 127.00 cannot be ruled out but reckon price would falter below 130.00.
On the downside, expect downside to be limited to 112.00 and said support at 111.65 should hold, bring another rise later. Only a daily close below said support at 111.65 would suggest a temporary top is formed instead, bring weakness to 111.00 but downside should be limited to 110.40-50 and support at 109.55 should remain intact. A breach of strong support at 109.55 would abort and suggest the rebound from 107.32 has ended instead, risk weakness to 109.00 and possibly 108.50-60 but price should stay well above said support at 107.32 and bring another rebound later.
Recommendation: Hold long entered at 112.50 for 114.50 with stop below 111.50.
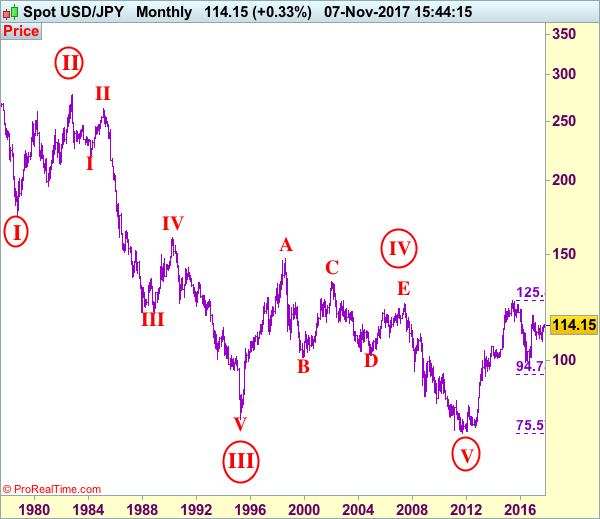
On the monthly chart, we have changed our preferred count that an impulsive wave is unfolding with major wave III with circle ended at 79.75, then followed by wave IV with circle and is labeled as a triangle with A: 147.64 (11 August, 1998), B: 101.25, C: 135.20, D: 101.67 and E leg ended at 124.14 to end the wave IV with circle. Hence, wave V with circle commenced from there and hit a record low of 75.31, however, the subsequent strong rebound signals this circle wave V has possibly ended there, hence gain to (indicated upside target at 122.00 and 125.00 had been met), the retreat from 125.86 suggests wave A of major correction has ended there and wave B correction back to 99.00, then 95.00 would be seen, however, reckon downside would be limited to 90.00, bring another rebound in wave C next year.
AUD/SGD 1H Chart: Aussie Stranded In Narrow Range
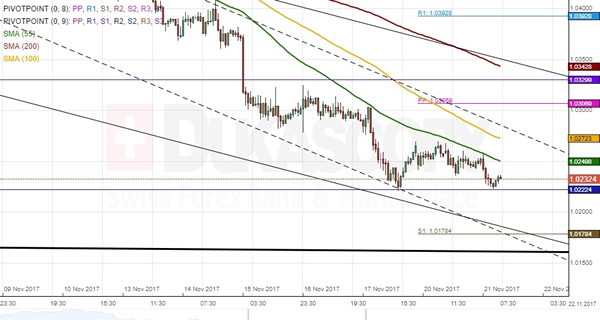
AUD/SGD has been dominated by a flat descending channel since late September, 2016. The pair's last wave down in this pattern has been stranded in two additional channels. As apparent on the hourly chart, the Aussie still falls short from the bottom boundary of the senior channel near 1.0140/60; thus, there is still some downside potential. The monthly S2 at 1.0222 has halted the rate on two separate occasions during the past week. This factor, together with neutral technical indicators, suggest that the strong bearish sentiment might have allayed, thus giving bulls an opportunity to take the upper hand in the nearest time. Given the fact that the pair has been confined in a narrow range between the monthly S2 and the 55-hour SMA, no significant changes might occur during this session (in case the RBA Governor Philip Lowe does not shake the market dramatically). Subsequently, appreciation is expected to follow.
USD/DKK 1H Chart: Rate Could Edge Lower In Short Term
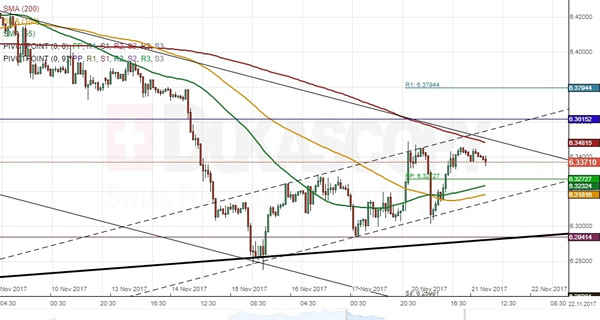
The US Dollar has been stranded in a channel up against the Danish Krone for the last three months. If looking at the pair's movement this month, two additional channels can be distinguished. The senior one has guided the pair towards the bottom boundary of the aforementioned dominant pattern circa 6.28. From that point forward, a junior ascending channel was formed. A retracement from the 6.28 area suggests that the pair might be set for appreciation in the medium term. However, in order to do so, the Greenback has to breach the upper line of the middle pattern, reinforced by the 200-hour SMA and the monthly PP in the 6.367 area. It is likely that the pair pushes up to this mark within the following trading sessions, but the subsequent movement should nevertheless be to the downside where it could test the most senior pattern and the monthly S1 circa 6.29/30. The pair should then resume its general direction north.
EUR/USD: German Producer Price Index
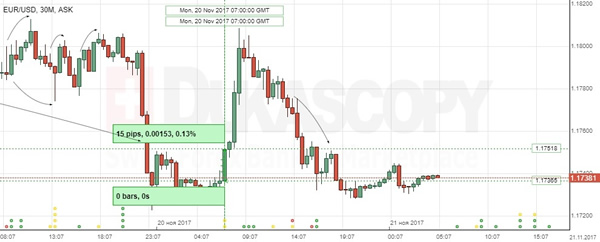
The EUR/USD currency pair failed to recover after falling sharply on Angela Merkel's unsuccessful attempt to form three-way coalition. The Euro gained against the Greenback 15 base points to the 1.1751 mark to reveal temporary increase, but continue trading in the 1.1740 area.
Destatis reported that German producer inflation eased slightly to mark a 2.7% yearly increase in October, while monthly growth pace remained at 0.3% in the same period. The most of contribution came from the Intermediate Goods Index climbing 4.1% year-over-year for the month. In the separate report, Deutsche Bundesbank noted that the country's economy is set to remain on a solid growth path entering in the Q4, buoyed by the surge in industrial activity.
Technical Outlook: USDJPY – Limited Recovery While Below Daily Tenkan-Sen
The pair is holding in extended consolidation above key supports at 111.90/71 (daily cloud top / Fibo 38.2% of 107.31/114.73 / converged 100/200SMA’s), but upside attempts were so far limited.
Daily techs are bearishly aligned and expected to keep near-term focus at the downside while the price remains below 112.97 pivot (daily Tenkan-sen / Fibo 38.2% of 114.73/111.88 downleg).
Renewed attempts through 111.90/71 zone could trigger significant bearish acceleration on sustained break and expose supports at 111.02 and 110.15 (Fibo 50% and 61.8% retracement of 107.31/114.73 ascend).
Conversely, sustained break above 113.00 zone would ease existing downside pressure and signal further recovery of 114.73/111.88 pullback.
Res: 112.71, 112.97, 113.30, 113.64
Sup: 112.70, 111.90, 111.71, 111.46
Trade Idea: EUR/JPY – Stand aside
EUR/JPY - 132.03
Original strategy:
Bought at 132.95, stopped at 132.35
Position: - Long at 132.95
Target: -
Stop: - 132.35
New strategy :
Stand aside
Position: -
Target: -
Stop:-
Despite dropping sharply to 131.17 initially yesterday, lack of follow through selling on break of previous support at 131.40 and the subsequent rebound suggest further choppy trading would be seen and recovery to 132.50-60 cannot be rued out, however, break of 133.15-20 is needed to signal low is formed, bring further gain to 133.50, then towards resistance at 133.89 (last week’s high) which is expected to cap euro’s upside.
On the downside, expect pullback to be limited to 131.55-60 and said support at 131.17 should remain intact, bring another rebound. Below 131.17 would signal the fall from 134.50 top is still in progress, then this erratic decline may extend weakness to 130.60-65 and possibly towards psychological level at 130.00 which is likely to hold from here. As near term outlook is mixed, would be prudent to stand aside for now.
Our latest preferred count is that wave (ii) is ABC-X-ABC which ended at 123.33 and wave (iii) is unfolding with wave iii ended at 100.77, followed by wave iv at 111.57 and wave v as well as the wave (iii) has ended at 97.04, followed by wave (iv) at 111.43 and wave (v) has ended at 94.12 which is also the end of the larger degree v, this also implied the major wave (C) has also ended there, hence major correction has commenced from there with (A) leg unfolding in its lower degree wave c which has possibly ended at 145.69. Under this count, A-B-C wave (B) has commenced with A leg ended at 136.23, wave B at 143.79 and wave C has possibly ended at 149.79.
Our larger degree count is that the decline from 139.26 is wave (C) and is sub-divided into a diagonal triangle i-ii-iii-iv-v with wave i - 105.44, wave ii- 123.33, wave iii - 97.03, wave iv - 111.43, followed by the final wave v as well as the end of wave (C) at 94.12, this also mark the bottom of larger degree wave B. Under this count, major rise in wave C has commenced as an impulsive wave with minor wave III ended at 145.69, wave V is still in progress for further gain to 150.00. Having said that, this so-called wave V could well be the first leg of larger degree 5-waver wave C and this wave C should bring at least a retest of wave A top at 169.97 (July 2008).

Forex: Political Turmoil In Germany Hurts EUR
The EUR lost ground against many of its peers on Monday on news that Chancellor Angel Merkel’s efforts to form a coalition government had collapsed, which could result in Germany having to call snap elections. With no viable government coalition, it seems highly likely that Germany will be forced to hold new elections. For the past month, Merkel had been in negotiations with the pro-business FDP and their leader Christian Linder. However, sources close to the negotiations stated that Lindner walked out of discussions saying that there was “no basis of trust” to form a government with Merkel’s conservative alliance CDU-CSU and the ecologist Green party. Germany now faces weeks/months of instability which has, initially, seen EUR come under pressure.
Earlier today, the Reserve Bank of Australia released the minutes from their last monetary meeting. The RBA has played down expectations of domestic wage rises and offered little hope to struggling retailers in an economic assessment that has pushed expectations for a future rate hike towards the end of 2018. The RBA suggested that “the experience of other advanced economies – where growth in wages had been low despite ongoing reductions in unemployment – might be unavoidable in Australia”. AUD saw selling pressure following the minutes’ release, trading to a low last seen in June before retracing higher.
EURUSD is 0.2% higher in early Tuesday trading at around 1.1755.
USDJPY is 0.15% lower in early session trading at around 112.46.
GBPUSD is 0.2% higher, currently trading around 1.3260.
AUDUSD recovered from early trading lows to currently trade around 0.7545.
Gold is 0.3% higher in early Tuesday trading at around $1,280.75.
WTI is nearly 0.3% higher in early session trading at around $56.55.
Major data releases for today:
At 09:05 GMT, the Reserve Bank of Australia’s Governor Phillip Lowe is scheduled to speak at the Australian Business Economists (ABE) Annual Dinner in Sydney Australia.
At 09:30 GMT, the UK Office for National Statistics will release Public Sector Net Borrowing for October. The PSNB captures an amount of new debt held by the UK government. The release is expected to come in at £6.600 billion compared to the previous release of £5.326 billion. We can expect to see GBP volatility if the release is substantially different from expectations.
At 15:00 GMT, European Central Bank Executive Board member Benoit Coure is scheduled to chair a Policy Panel “Economic convergence: before or beyond fiscal union” at ECB Conference “Public debt, fiscal policy and EMU deepening” in Frankfurt, Germany.
At 23:00 GMT, Federal Reserve Chair Janet Yellen is scheduled to speak in a Panel Discussion at the New York Stern School of Business in NY, NY, USA.
Euro Weakness On Political Risks Supports Dollar, Aussie Down After RBA Minutes
Trading conditions were thin on Tuesday as economic releases were few, while the US was in a holiday mode ahead of the Thanksgiving Day on Thursday. Japan is also celebrating its Labour Thanksgiving Day on Thursday. The dollar remained steady at one-week high levels during the session as political noise in Germany continued to weigh on the euro. The aussie touched a five-month low after the RBA meeting minutes signalled concerns on subdued wage growth.
The euro recouped some of its losses made yesterday in Asia, trading flat around $1.1741 as investors retained their confidence on Eurozone’s relative economic outlook. But the cloud surrounding Germany’s political environment restricted larger gains following the collapse of the coalition talks on Sunday. The German chancellor, Angela Merkel, said on Monday she would prefer to go through new elections rather than rule a minority government. A few hours earlier, the German president urged parties to resume coalition negotiations, hinting that he did not prefer fresh elections.
Meanwhile in the US, the Fed chair, Janet Yellen said she would step down from the Fed board after Jerome Powell, who was nominated as her successor earlier this month, takes the role. Note that Yellen’s term as a board governor expires at the end of January 2024. This brought some volatility to the market as the US president would now have to fill four seats in the board of governors including the position of the Fed vice chairman.
With the focus pulling away from the US tax developments for the moment as any progress on the tax plan is not expected before the Thanksgiving holiday, the dollar index inched down by 0.10% to 93.85 but remained close to one-week high levels. Higher Treasury yields also supported the greenback, with the two-year yields surging to a nine-year high overnight. Dollar/yen edged down by 0.12% to 112.48 and gold rose by 0.30% to $1,280.40 per ounce.
Attention will now turn to Fed meeting minutes due on Wednesday, where investors will be eager to identify any clues on the path of interest rates.
Pound/dollar was last trading at $1.3252 (+0.14%).
Elsewhere, minutes of the RBA’s meeting in October released early today showed that central bankers were worried that faster-rising employment would not translate into higher wage growth – a fact that is also observed in Japan, the US and the UK. This suggested that interest rates might stay at the current record low levels for longer as Australian households are also highly indebted. The aussie slipped to a fresh five-month low of $0.7531 in the wake of the statement, being 0.09% down on the day. Remarks by the RBA Governor, Philip Lowe, expected at 0900GMT will be also in focus.
The kiwi declined as well, falling by 0.10% to $0.6802 as dairy producers in New Zealand reported higher milk output in October, raising fears of a potential milk oversupply ahead of a global dairy auction.
In energy markets, oil prices increased amid expectations that the OPEC and non-OPEC members will agree to extend supply cuts in their next week’s meeting. Yet, rising output in the US and doubts about whether some members will indeed continue to curb their production limited upside price movements in the market. WTI crude was up 0.30% to $56.59 per barrel and Brent picked up by 0.48% to $62.52.
Trade Idea: AUD/USD – Sell at 0.7620
AUD/USD – 0.7540
Original strategy:
Sold at 0.7720, met target at 0.7550
Position: - Short at 0.7720
Target: - 0.7550
Stop:-
New strategy :
Sell at 0.7620, Target: 0.7470, Stop: 0.7680
Position: -
Target: -
Stop:-
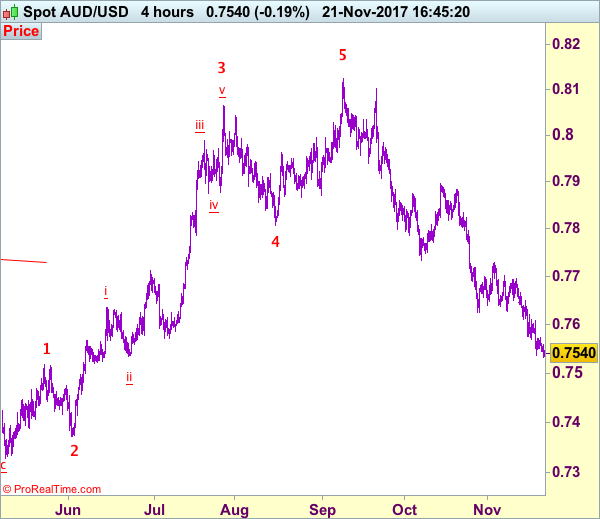
As aussie has remained under pressure after recent anticipated selloff, adding credence to our bearish view that recent decline from 0.8125 top is still in progress, hence downside bias remains for this fall to extend weakness to 0.7500, then 0.7470, however, loss of downward momentum should prevent sharp fall below 0.7440 and reckon 0.7400 would hold from here, risk from there is seen for a rebound later.
In view of this, would not chase this fall here and would be prudent to sell aussie on recovery as 0.7610-20 should limit upside. Above 0.7650 would bring rebound to 0.7670, however, reckon upside would be limited to 0.7701 resistance and price should falter well below this month’s high at 0.7730, bring another decline.
On the 4-hour chart, recent upmove from 0.7329 is unfolding as an impulsive rise with wave 3 as well as smaller degree wave (iii) extending, only minor wave v of (iii) has ended at 0.8125, hence bullishness remains for this move to extend headway to 0.8200, then towards 0.8300, however, reckon upside would be limited to 0.8400 and the final wave 5 should falter below 0.8500, bring correction later.