Sample Category Title
USD/CHF Holding Around Parity
USD/CHF is consolidating. Yet, the technical structure is still bullish. The technical structure suggests an improving short-term buying interest. Expected to show continued bullish momentum. Hourly support stands at 0.9951 (01/11/2017 low).
In the long-term, the pair is still trading in range since 2011 despite some turmoil when the SNB unpegged the CHF. Key support can be found 0.8986 (30/01/2015 low). The technical structure favours nonetheless a long term bullish bias since the unpeg in January 2015.
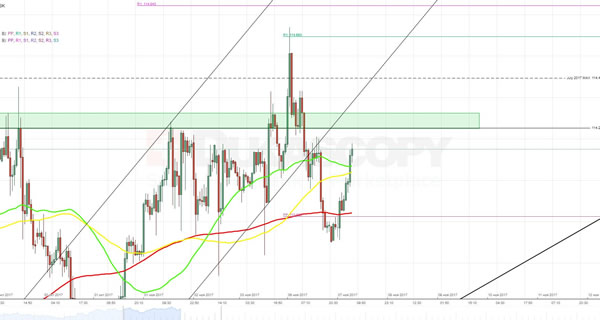
USD/JPY Ready For Another Leg Higher
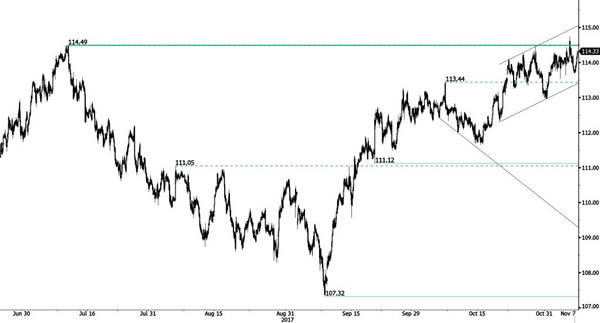
USD/JPY is edging higher above resistance at 114.49 (11/07/2017 high). Support is located at 111.12 (20/09/2017 low).
We favor a long-term bearish bias. Support is now given at 99.02 (10/08/2013 low). A gradual rise towards the major resistance at 125.86 (05/06/2015 high) seems unlikely. Expected to decline further support at 93.79 (13/06/2013 low).
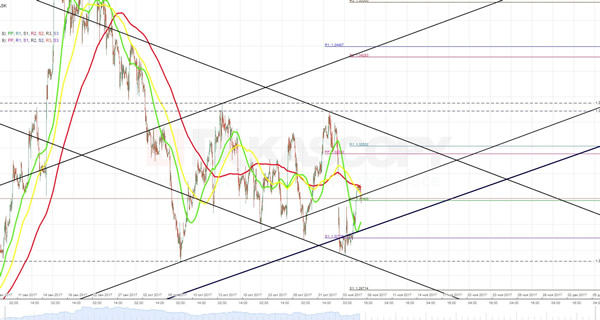
GBP/USD Monitoring Support At 1.3000
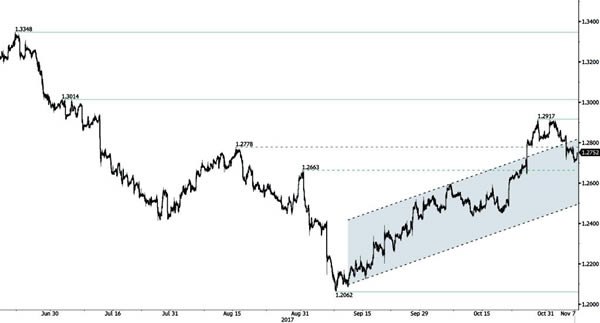
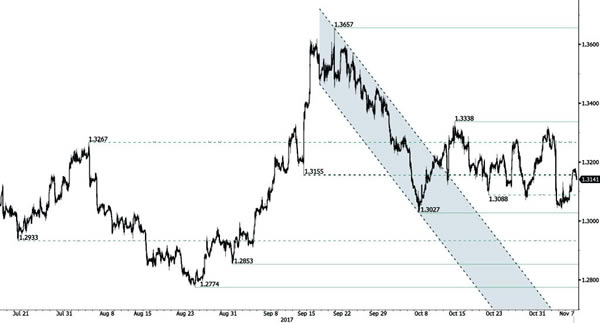
GBP/USD is back towards support given at 1.3027 (06/10/2017 low). String resistance is given at 1.3338 (13/10/2017 high). Expected to show continued decline.
The long-term technical pattern is reversing. The Brexit vote had paved the way for further decline. Long-term support can be found at 1.1841 (07/10/2017 low). Long-term resistance given around 1.35 is at stake and indicates a long-term reversal in the negative trend. Yet, it is very unlikely at the moment.
EUR/USD Stronger Selling Pressures
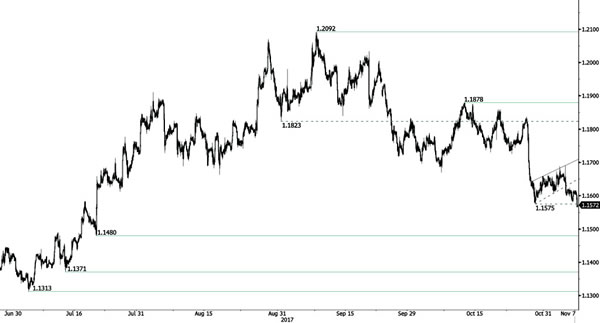
EUR/USD is biased to the downside after breaking hourly support at 1.1575 (27/10/2017 low). Hourly resistance is located at 1.1658 (30/10/2017 high). Expected to show some shortterm consolidation.
In the longer term, the momentum is now turning largely positive. We favour a continued bullish bias. Key resistance is holding at 1.2252 (25/12/2014 high) while strong support lies at 1.0341 (03/01/2017 low).
Technical Outlook: US CRUDE OIL – Bulls Are Pausing But Focus Remains At The Upside
Bulls are taking a breather on Tuesday after hitting fresh, marginally higher high at $57.67 (the highest since early July 2015).
The price action is holding within narrow range on Tuesday, following strong rally in past three days when oil was up nearly 5.5%.
Strong bullish sentiment on expectations oil producers will extend existing output cut agreement was boosted by weekend’s series of arrests of high-profile officials in Saudi Arabia, OPEC’s most influential member.
Strong rally on Monday managed to close above pivotal barrier at $57.12 (Fibo 38.2% of $107.40/$26.04, 2014/2016 fall), generating strong bullish signal for extension towards psychological $60.00 barrier.
Overextended daily studies warn of correction but so far without firmer signal.
Corrective dips would face strong support from rising 10SMA (currently at $54.71) which tracks the ascend in past one month.
Res: 57.67, 57.99, 59.04, 60.00
Sup: 57.12, 56.29, 55.64, 54.71
WTI Oil Futures In Uptrend But Rally Shows Signs Of Exhaustion
WTI oil futures are at their highest level since July 2015 after a strong rally took prices above the key 57.00 level, hitting as high as 57.66. The short-term trend is clearly to the upside but the market has become overextended. This is indicated by the RSI on the 4-hour chart, which is now above 70 in overbought territory.
As the rally appears to be exhausted, the market is likely to consolidate in the near term and possibly pull back towards support at 57.00. Breaking below this key level would place prices under pressure to slip back towards 54.00. From this point, further weakness can be expected, with scope to target 49.00, a level that was approached a month ago.
Trend indicators on the 4-hour chart remain bullish. The 20 and 50-period moving averages are sloping upwards, while Ichimoku cloud analysis is showing positively aligned Tenkan-sen and Kijun-sen lines.
The uptrend is still in progress with no signs of a reversal yet, although momentum has slowed. The current consolidation phase is deemed corrective and the bullish bias is expected to remain strong in the near term.
XAUUSD Analysis: Surges Amid Political Changes In Saudi Arabia
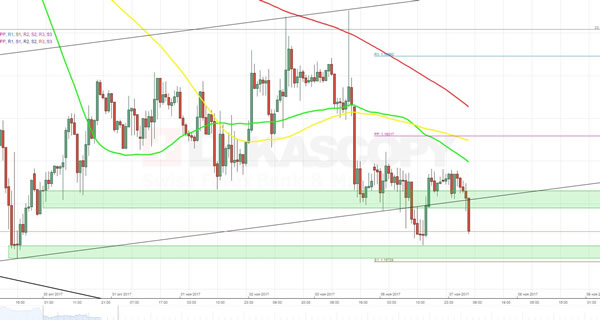
A sudden cleansing in the Saudi establishment enhanced uncertainly about the situation in the Middle East and, as a result, magnified demand for gold. On hourly chart this search for safe haven assets signified creation of a second reaction low a two-week long junior ascending channel. Moreover, the rapid surge allowed the pair to rapidly reach the weekly R1 at 1,281.00. As markets have calmed down already, bears are expected to start pushing the pair back to the bottom. However, there is little chance the rate will succeed to return back to support zone near 1,268.00, as the road to the south is obstructed by a combination of the 55-, 100- and 200-hour SMAs together with the weekly PP at 1,273.35. Unless the rate receives a proper impulse, it is expected to halt the fall there.
USDJPY Analysis: Falls To 113.70 But Quickly Recovers
From technical point of view, the currency rate had all means to make a rebound near the 114.24 mark and make one more attempt to reach the monthly R1 at 114.84. However, changes in ten-year treasury rates led to depreciation of the buck and drove the pair out of an ascending channel. The downfall was not sharp, as the pair managed to quickly recover near the 113.73 mark. Although location of moving averages and pivot points indicate on recovery of the Dollar, there is a need to bear in mind potentially high volatility that could be caused by fundamental factors. Namely, traders might suddenly turn to safe haven Yen if Donald Trump continues his hot rhetoric during the visit to South Korea and other Asian countries.
GBPUSD Anaysis: Meets Resistance At 1.3170
Due to quite active sell-off of the buck yesterday, the cable managed to break to the top instead of falling to support zone near the 1.3030 mark. However, the surge was boldly stopped by a combination of the 100- and 200-hour SMAs together with the 61.8% Fibonacci retracement level at 1.3166. For this reason, the currency rate is likely to start moving back to the 1.3120 mark. However, there is a need to take into account existence of an unconfirmed three-week long descending channel consisting of three reaction lows and one reaction high. If this assumption is true, then in medium perspective the Pound should continue its gradual recovery. But in daily range its valuation is expected to be influenced by release of the Halifax HPI and the Fed Chair Yellen speech.
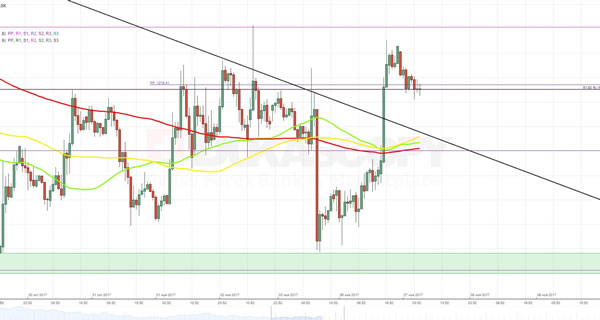
EURUSD Analysis: Tests 1.1580
During the previous trading session the rate slipped to support area near the 1.1580 mark, as expected, and returned to the place from which it started. As the pressure from falling 55- and 100-hour SMAs hasn’t gone anywhere, the pair is still projected to move in the southern direction towards the weekly S1 located at the 1.1572 level. There is also a need to take into account an additional barrier formed by the slope that is moving along the falling 200-hour SMA. Moreover, the market continues to be dominated by bears, as the number of traders with bullish sentiment reaches only 40% on average. Even if the Euro makes an attempt to surge amid an impulse from Draghi speech in Frankfurt, this recovery is expected to have a limited effect due to additional resistance set up by the weekly PP at 1.1631.