Sample Category Title
EUR/CAD Elliott Wave Analysis
EUR/CAD – 1.4984
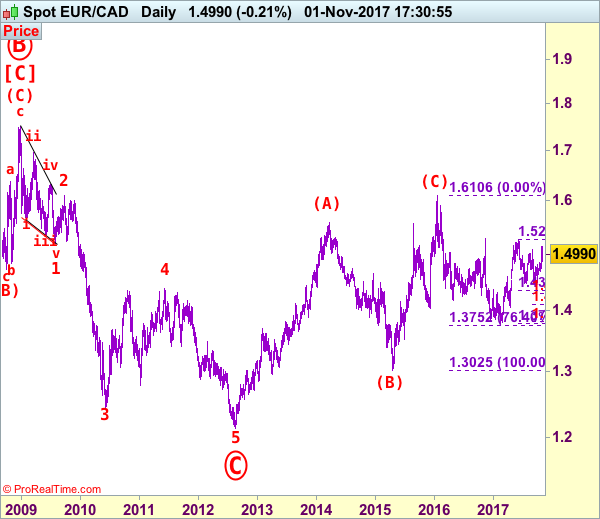
Although the single currency rallied to as high as 1.5146 last week, lack of follow through buying on break of previous resistance at 1.5076 and the subsequent retreat to 1.4868 suggest top is possibly formed there and consolidation mild downside bias is seen, below said support at 1.4868 would add credence to this view, bring further fall to 1.4800, then towards 1.4740-50. Looking ahead, only a drop below support at 1.4680-85 would retain bearishness and signal the rise from 1.4441 has ended, bring further fall to 1.4635 support, then towards 1.4550-55 which is likely to hold from here due to near term oversold condition.
Our latest preferred count is that larger degree wave [C] from 1.3289 as well as circle wave B ended at 1.7509 in Dec 2008 with (A): 1.6325, (B): 1.4719 followed by wave (C) at 1.7509, hence circle wave C is unfolding with wave 1 ended at 1.5186 (diagonal wave 1), wave 2 at 1.6096, impulsive wave 3 has ended at 1.2451, followed by wave 4 at 1.4380, in view of recent strong rebound, we are now treating the wave 5 as well as larger degree circle wave C has ended at 1.2129, hence (A)-(B)-(C) correction has commenced from there with impulsive wave (C) now unfolding and indicated initial upside target at 1.6000 had been met and reckon 1.6500 would hold.
On the upside, whilst initial recovery to 1.5050 cannot be ruled out, reckon upside would be limited and said resistance at 1.5146 should hold, bring another retreat. Above said resistance would signal the rebound from 1.4441 is still in progress for further gain too 1.5200, having said that, price should falter below previous chart resistance at 1.5259 and bring another decline later.
Recommendation: Sell at 1.5050 for 1.4850 with stop above 1.5150.
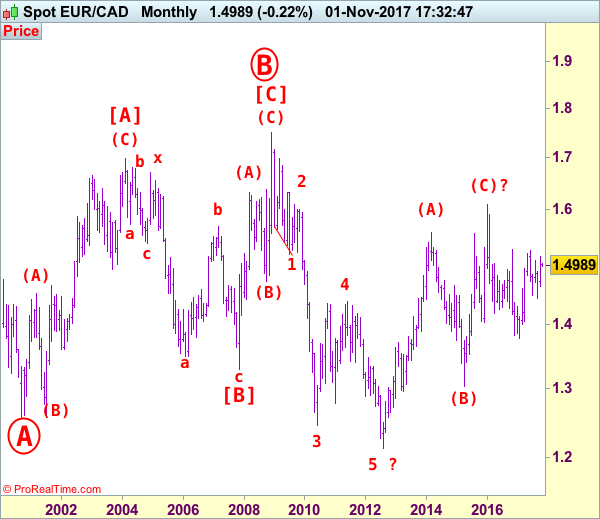
On the bigger picture, our long-term count on the monthly chart is that a big sideways consolidation from 2000 low of 1.2557 has possibly ended at 1.7509 as circle wave B with [A]: 1.6976 ( (A): 1.4513, (B): 1.2612, (C): 1.6976), wave [B]: 1.3289 is a double three with 1st a-b-c: 1.5384, x: 1.6709 and 2nd a-b-c: 1.3289. As indicated above, the wave [C] has ended at 1.7509. The selloff from there is now unfolding which itself should be labeled as an impulsive wave with wave 1: 1.5186 (diagonal wave 1), followed by wave 2: 1.6096 and wave 3: 1.2451, wave 4: 1.4380, wave 5 as well as larger degree circle wave C has possibly ended at 1.2129 and major correction has possibly commenced for retracement of recent decline towards 1.4000, then 1.4180-90 (38.2% Fibonacci retracement of 1.7509-1.2129). Below said support at 1.2129 would risk weakness to psychological support at 1.2000 and then 1.1851 (50% projection of 1.7509-1.2451 measuring from 1.4380) but reckon 1.1500 would remain intact, bring reversal later.
EURJPY Risk Tilted To The Upside In Short Run, Broader Neutral Trend Intact
EURJPY is firmer after the bounce up earlier this week following a sharp fall from highs not seen since late 2015. The cross continues to benefit from strong upside momentum in the short term. Looking at the broader trend, the market has been neutral since mid-September.
The level at 131.45 has provided strong support. Soft support is expected at yesterday's low of 132.31, which will keep risk to the upside if it holds during the next few sessions.
EURJPY needs to break the 50% Fibonacci and key 133 level to open up the way for more corrective gains towards the 134.48 peak.
Breaking below yesterday's low of 132.31 would turn the focus back to the downside to target 131.45. From here, the odds increase for a break out of the broader range to move to the downside.
Intra-day risk is tilted to the upside but EURJPY needs to regain the key 133-handle to relieve downside pressure. The broader range that has prevailed since mid-September is expected to remain intact as long as the 131.45 support holds.
AUD/USD Elliott Wave Analysis
AUD/USD – 0.7685
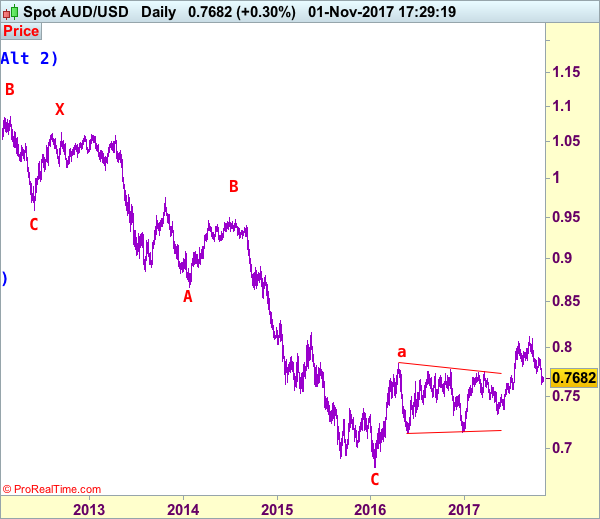
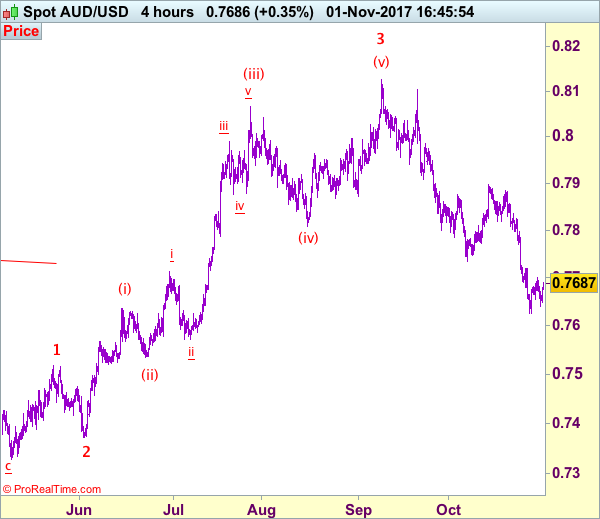
Aussie dropped in line with our bearish expectation, our short position entered at 0.7870 met downside target at 0.7670 with 200 points profit, however, as price has recovered after finding support at 0.7625, suggesting consolidation above this level would be seen and initial recovery to 0.7720-25 is likely, however, reckon 0.7780-85 would limit upside and bring another decline later, below said support at 0.7625 would extend the decline from 0.8125 top for retracement of early upmove to 0.7570, then towards 0.7520 but near term loss of momentum should limit downside and reckon 0.7500 would hold.
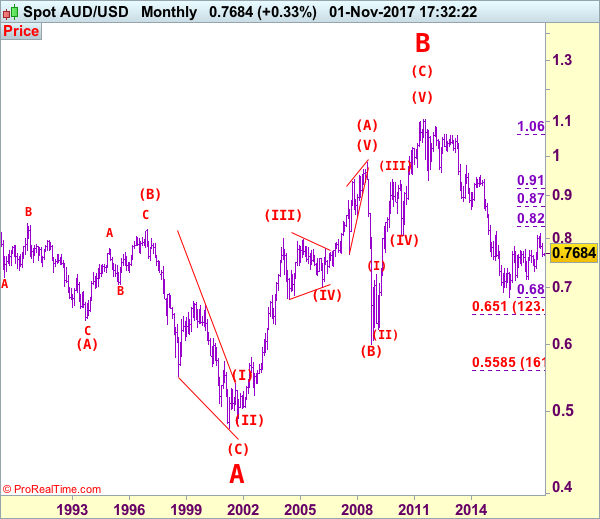
We are keeping our count that top has been formed at 1.1081 (wave 5 of V) and major correction (A-B-C-X-A-B-C) has commenced, indicated downside targets at 0.7945 (61.8% Fibonacci retracement of entire rise from 0.6007-1.1081) and 0.7750 had been met and downside bias is seen for further weakness to 0.6800, then 0.6700 but reckon 0.6500 would hold from here.
Our preferred count is that the rally from 0.6007 to 0.7270 (7 Jan 2009) is marked as wave A, the retreat to 0.6248 (2 Feb 2009) is wave B and the subsequent upmove is labeled as wave C with wave (iii) and wave (iv) ended at 0.8265 and 0.7700 respectively and wave (v) as well as 3 ended at 0.9407, then wave 4 ended at 0.8066 (instead of 0.8578). The wave 5 has met our indicated projection target of 1.1060 and could ended at 1.1081, this level is now treated as the peak of wave (C) as well as larger degree wave B, hence major fall in wave C has commenced, our initial downside target at psychological support at 0.7000 has just been met and further weakness to 0.6500 would be seen later.
On the upside, expect recovery to be limited to 0.7720-30 and bring another decline to aforesaid downside targets. Above 0.7795-00 would defer and risk a stronger rebound but only break of resistance at 0.7897 would abort and signal low is formed instead, risk test of previous support at 0.7908, break there would signal first leg of decline from 0.8125 has ended instead, bring a stronger rebound to 0.7940-50 but upside should be limited to 0.8020 and bring another decline later. A daily close above 0.8020 would risk test of 0.8080 but only break of resistance at 0.8103 would signal correction from 0.8125 has ended, bring retest of this level first.
Recommendation: Short entered at 0.7870 met target at 0.7670 with 200 points profit and would sell again at 0.7720 for 0.7520 with stop above 0.7820.
Our alternate count on the daily chart treated the top formed in 2008 at 0.9851 could be a larger degree wave I and was followed by a deep and sharp correction in wave II to 0.6007 and wave III is unfolding from there.
The long-term uptrend started from 0.4775 (2 Apr 2001) with an impulsive structure. Wave I is labeled as 0.4775 to 0.9851 (15 Jul 2008), wave II has ended at 0.6007 (Oct 2008) and wave III is still in progress which may extend further gain to 1.1265.
Trade Idea: GBP/USD – Stand aside
GBP/USD – 1.3285
Original strategy :
Sold at 1.3195, stopped at 1.3255
Position: - Short at 1.3195
Target: -
Stop: - 1.3255
New strategy :
Stand aside
Position: -
Target: -
Stop:-
As sterling has surged yesterday and broke above previous resistance at 1.3279-87, dampening our bearishness and gain towards resistance at 1.3338 cannot be ruled out, however, as broad outlook remains consolidative, reckon upside would be limited to 1.3390-00, price should falter well below resistance at 1.3455, bring another decline later.
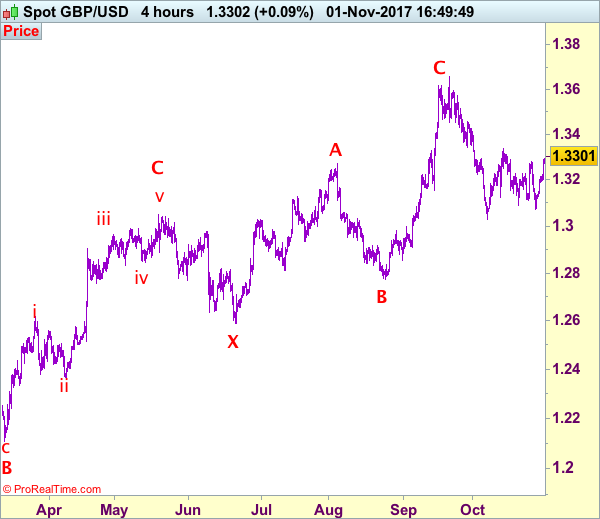
In view of this, would not chase this rise here and would be prudent to stand aside for now. Below 1.3260-65 would bring pullback to 1.3220-25 but only break of 1.3195-00 would signal top is formed instead, then further choppy trading within recent range would take place and weakness to 1.3150 and possibly 1.3117 would follow. Our preferred count is that (pls see the attached chart) the wave IV is unfolding as a complex double three (ABC-X-ABC) correction with 2nd wave B ended at 1.2774, hence 2nd wave C could have ended at 1.3658.
Our preferred count on the daily chart is that cable's rebound from 1.3500 (wave (A) trough) is unfolding as a wave (B) with A ended at 1.7043, followed by triangle wave B and wave C as well as wave (B) has ended at 1.7192, the subsequent selloff is the larger degree wave (C) which is still unfolding with minor wave (III) of larger degree wave 3 ended at 1.1986, hence wave (IV) correction is in progress which could either be a triangle wave (IV) of a complex formation but upside should be limited to 1.3500 and price should falter well below 1.4000, bring another decline in wave (V) of 3 for weakness to 1.1500, then 1.1200.
Trade Idea: GBP/JPY – Stand aside
GBP/JPY - 151.50
Original strategy:
Sold at 150.00, stopped at 150.60
Position: - Short at 150.00
Target: -
Stop: - 150.60
New strategy :
Stand aside
Position: -
Target: -
Stop:-
Sterling rallied after holding above support at 148.92 and broke above previous resistance at 151.40, signaling the rise from 146.95 is still in progress, hence near term upside risk remains for this move to extend further gain to 152.25-30 but break there is needed to retain bullishness and signal early upmove has resumed for retest of recent high of 152.85 which is likely to hold on first testing.
In view of this, would not chase this rise here and would be prudent to stand aside in the meantime. Below 151.00 would bring pullback to 150.50 but break of previous resistance at 150.00 is needed to suggest top is possibly formed, bring weakness to 149.15-20 but only break of support at 148.95 would confirm and revive bearishness for retracement of recent rise to 148.75, then towards 148.00-10.
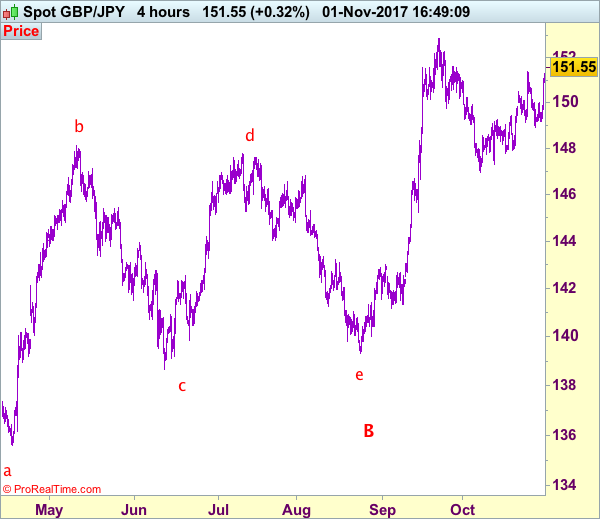
Our preferred count is that larger degree wave V with circle is unfolding from 251.12 with wave (I) 219.34, (II): 241.38 and wave (III) is subdivided into 1: 192.60, 2: 215.89 (23 Jul 2008) and wave 3 ended at 118.87 earlier in 2009. The correction from there to 162.60 is wave 4 which itself is a double three and is labeled as first a-b-c ended at 151.53, followed by wave x at 139.03, 2nd a ended at 162.60, 2nd b at 146.75 and 2nd c leg of wave 4 ended at 163.00. Therefore, the decline from 163.00 to 116.85 is now treated as wave 5 which also marked the end of larger degree wave (III), hence wave (IV) major correction has commenced for retracement of the wave (III) from 241.38 and upside target at 183.95-00 (50% Fibonacci retracement of the wave (II) from 241.38) had been met, a drop below 160.00 would suggest wave (IV) has ended at 195.85, bring decline in wave (V) for initial weakness to 130 (already met) and 120.
Forex Technical Analysis: EUR/USD, USD/JPY, GBP/USD
EUR/USD
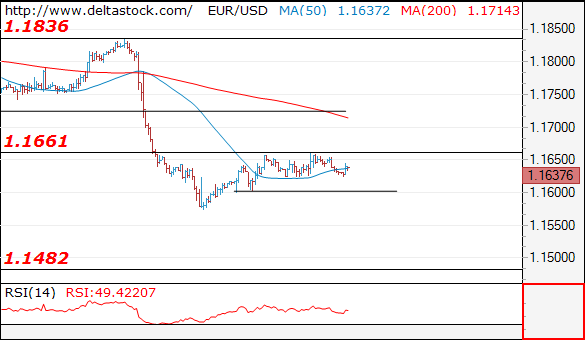
Current level - 1.1637
Despite the neutral intraday bias I still favor a higher rebound, through 1.1660, to 1.1720 area. The latter is expected to cap the upside and to provoke a large scale move towards 1.1480. Key intraday support lies at 1.1600.
| Resistance | Support | ||
| intraday | intraweek | intraday | intraweek |
|
1.1660 |
1.1840 |
1.1600 |
1.1480 |
|
1.1720 |
1.1940 |
1.1480 |
1.1300 |
USD/JPY
Current level - 113.93
The rebound above 113.50 show a completion of the current slide from 114.50 and the intraday bias is positive, for another test of the mentioned peak. The whole consolidation below 114.50 is still underway, with a risk of a third leg towards 113.00 and only a clear break through 114.50 will challenge 115.50.
| Resistance | Support | ||
| intraday | intraweek | intraday | intraweek |
|
114.00 |
114.50 |
113.50 |
111.00 |
|
114.50 |
115.50 |
113.05 |
107.30 |
GBP/USD
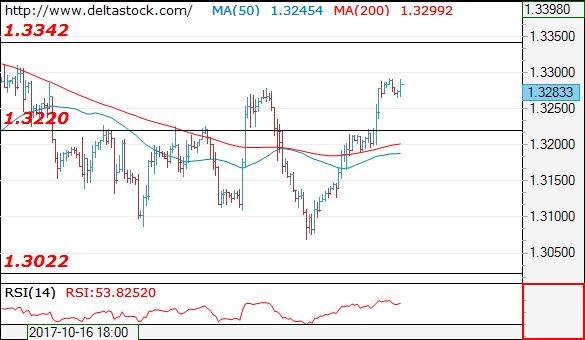
Current level - 1.3283
The break through 1.3220 resistance unleashed an upmove beyond 1.3280 and the bias is still positive, with a risk of a tight test at 1.3340 resistance. Initial support lie s at 1.3260, followed by 1.3220. A violation of the latter will signal a beginning of a senior move towards 1.3020.
| Resistance | Support | ||
| intraday | intraweek | intraday | intraweek |
|
1.3300 |
1.3340 |
1.3260 |
1.3020 |
|
1.3340 |
1.3650 |
1.3220 |
1.2760 |

Trade Idea: EUR/JPY – Hold short entered at 132.70
EUR/JPY - 132.72
Original strategy:
Sold at 132.70, Target: 130.70, Stop: 133.30
Position: - Short at 132.70
Target: - 130.70
Stop: - 133.30
New strategy :
Hold short entered at 132.70, Target: 130.70, Stop: 133.30
Position: - Short at 132.70
Target: - 130.70
Stop:- 133.30
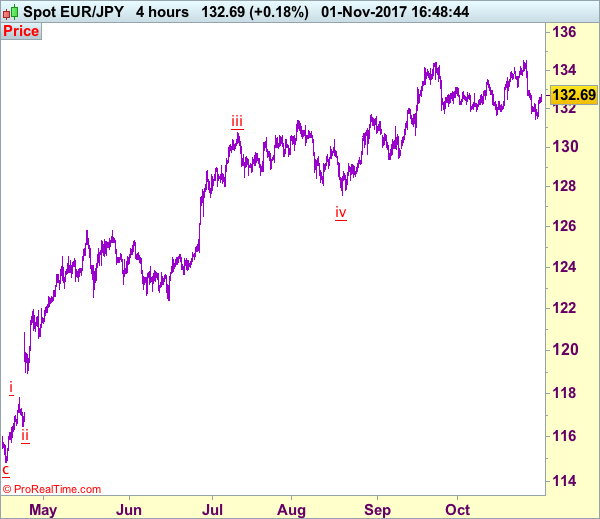
Although the single currency has risen again after brief pullback and marginal gain from here cannot be ruled out, as this move from 131.45 is viewed as retracement of the fall from 134.50, reckon upside would be limited and resistance at 132.96 should hold, bring retreat later, below 132.25-30 would bring weakness to 131.90-95 but break of latter level is needed to signal the rebound from 131.45 has ended, bring retest of this level, below there would extend the fall from 134.50 for a correction of early upmove to 131.00, then towards 130.50-60.
In view of this, we are holding on to our short position entered at 132.70. Above 133.10 would defer and suggest first leg of corrective decline from 134.50 top has ended, risk a stronger rebound to 133.50-60 but still reckon upside would be limited to 133.95-00, price should falter well below said last week’s high at 134.50, bring another selloff later.
Our latest preferred count is that wave (ii) is ABC-X-ABC which ended at 123.33 and wave (iii) is unfolding with wave iii ended at 100.77, followed by wave iv at 111.57 and wave v as well as the wave (iii) has ended at 97.04, followed by wave (iv) at 111.43 and wave (v) has ended at 94.12 which is also the end of the larger degree v, this also implied the major wave (C) has also ended there, hence major correction has commenced from there with (A) leg unfolding in its lower degree wave c which has possibly ended at 145.69. Under this count, A-B-C wave (B) has commenced with A leg ended at 136.23, wave B at 143.79 and wave C has possibly ended at 149.79.
Our larger degree count is that the decline from 139.26 is wave (C) and is sub-divided into a diagonal triangle i-ii-iii-iv-v with wave i - 105.44, wave ii- 123.33, wave iii - 97.03, wave iv - 111.43, followed by the final wave v as well as the end of wave (C) at 94.12, this also mark the bottom of larger degree wave B. Under this count, major rise in wave C has commenced as an impulsive wave with minor wave III ended at 145.69, wave V is still in progress for further gain to 150.00. Having said that, this so-called wave V could well be the first leg of larger degree 5-waver wave C and this wave C should bring at least a retest of wave A top at 169.97 (July 2008).
Trade Idea: AUD/USD – Sell at 0.7720
AUD/USD – 0.7685
Original strategy:
Sell at 0.7720, Target: 0.7550, Stop: 0.7780
Position: -
Target: -
Stop:-
New strategy :
Sell at 0.7720, Target: 0.7550, Stop: 0.7780
Position: -
Target: -
Stop:-
As aussie found support at 0.7639 and has rebounded again, retaining our view that further consolidation above last week’s low at 0.7625 would be seen and another bounce to 0.7699 resistance cannot be ruled out, however, reckon 0.7720-25 would limit upside and bring another decline later, below said support at 0.7639 would bring retest of 0.7625, break there would extend recent decline from 0.8125 top to 0.7600, having said that, loss of downward momentum should prevent sharp fall below 0.7550 and reckon 0.7500 would hold from here, bring rebound later.
In view of this, we are looking to reinstate short on recovery as 0.7720-25 should limit upside and bring another decline. Above previous support at 0.7770 would defer and suggest a temporary low is possibly formed, bring rebound to 0.7800 and then towards 0.7825-35 later.
On the 4-hour chart, recent upmove from 0.7329 is unfolding as an impulsive rise with wave 3 as well as smaller degree wave (iii) extending, only minor wave v of (iii) has ended at 0.8125, hence bullishness remains for this move to extend headway to 0.8200, then towards 0.8300, however, reckon upside would be limited to 0.8400 and the final wave 5 should falter below 0.8500, bring correction later.
NZD/USD Candlesticks and Ichimoku Analysis
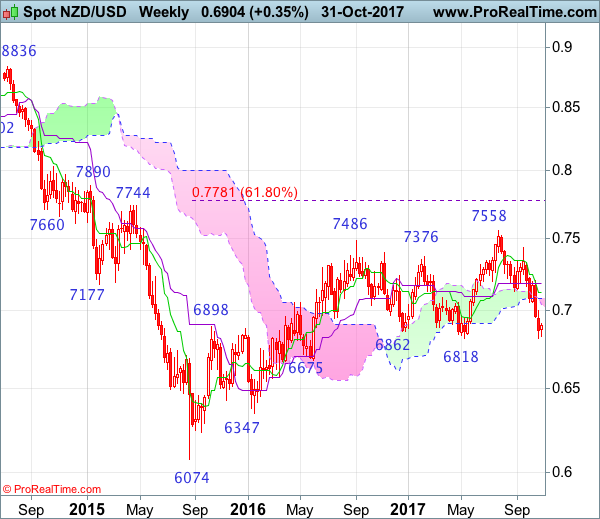
Weekly
• Last Candlesticks pattern: N/A
• Time of formation: N/A
• Trend bias: Up
Daily
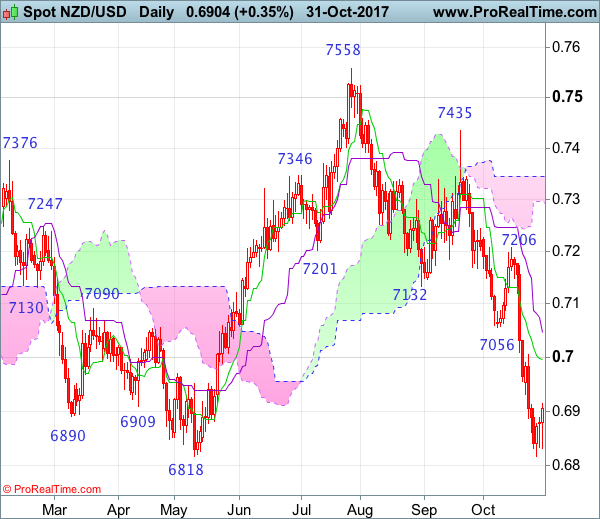
• Last Candlesticks pattern: Shooting star
• Time of formation: 20 Sep 2017
• Trend bias: Up
NZD/USD – 0.6915
Kiwi met renewed selling interest at 0.7206 last month and dropped sharply in line with our bearish expectation, adding credence to our bearish view that the decline from 0.7558 top is still in progress and bearishness remains for this move to bring retracement of early upmove, below support at 0.6818 would extend further decline to 0.6710-20, then 0.6675 support but a sustained breach below latter level is needed to retain bearishness and encourage for subsequent selloff towards strong support at 0.6575 which is likely to hold from here.
On the upside, whilst initial recovery to 0.7000 cannot be ruled out, reckon upside would be limited to the Kijun-Sen (now at 0.7031) and bring another decline. Only a daily close above 0.7056 (previous support now resistance) would suggest a temporary low is possibly formed, bring a stronger rebound to 0.7090-00 but still reckon upside would be limited to 0.7150-55 and price should falter well below said resistance at 0.7206, bring another selloff later this month.
Recommendation: Sell again at 0.7030 for 0.6830 with stop above 0.7130.
On the weekly chart, despite falling to 0.6818 again, as kiwi has recovered after failing to penetrate this support, suggesting minor consolidation above said support would be seen and corrective bounce to 0.7000 cannot be ruled out, reckon upside would be limited to the lower Kumo (now at 0.7043) and bring another decline. A break of said strong support at 0.6818 would add credence to our bearish view that the fall from 0.7558 top is still in progress for further weakness to 0.6700, then 0.6675, only a break below strong support at 0.6575 would signal the rise from 0.6074 low has ended.
On the upside, expect recovery to be limited to last week’s high at 0.7004 and the lower Kumo (now at 0.7043) should hold, bring another decline. Above the Tenkan-Sen (now at 0.7127) would defer and risk a stronger rebound to the Kijun-sen (now at 0.7188) but resistance at 0.7206) should remain intact, bring another decline later. Only a break of 0.7206 resistance would defer and suggest low is possibly formed instead, bring further gain to 0.7245-50 and possibly towards 0.7325-30 but price should falter well below resistance at 0.7435.
AUDUSD Holds Bearish Outlook Under 200-Day MA
AUDUSD is under pressure below its 200-day moving average. The market has been reversing the May to September uptrend, retracing over half of this move. The drop below the 50% Fibonacci level of the 0.7328 to 0.8124 upleg last week has strengthened the short-term bearish bias.
The market is now consolidating just above Friday’s low of 0.7624 and near the 61.8% Fibonacci level. This is expected to provide support in the near term, while prices are capped by the 200-day MA at 0.7691. The bounce on Friday failed to break above the 200-day MA resistance and left the AUDUSD pair neutral since the drop below it on October 26.
Downside momentum stalled as seen by RSI reaching oversold levels near 30, pointing to more sideways trading in the near term. A move above the 50% Fibonacci (0.7725) opens up AUDUSD for more gains to 0.7900. Only a rise above this key level would indicate that the short-term bearish phase has ended and increase the odds to break 0.8000 and re-test the 0.8124 peak.
The outlook for AUDUSD remains bearish below the 200-day MA and another leg lower towards 0.7525 and 0.7328 cannot be ruled out.