Sample Category Title
Daily Wave Analysis: GBP/USD Breaks Resistance Channel With Sturdy Bullish Momentum
Currency pair GBP/USD
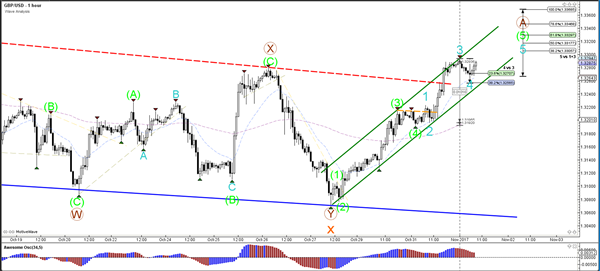
The GBP/USD break above the resistance trend line (dotted red) of the channel and has built a larger correction at the larger support trend lines (blue). A break above the 61.8% Fibonacci level invalidates the bearish wave pattern and indicates that more upside is likely.
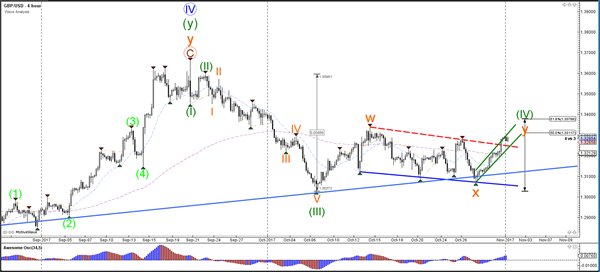
The GBP/USD is showing strong bullish momentum and is building a neat channel to the upside. Price could face sturdy resistance at the Fib levels of the 4 hour chart.
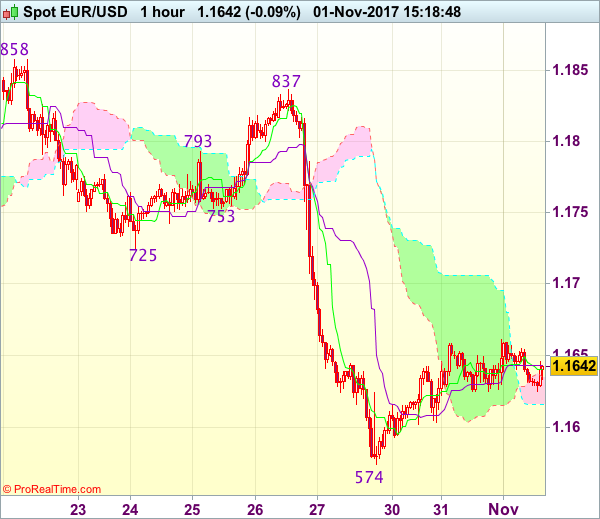
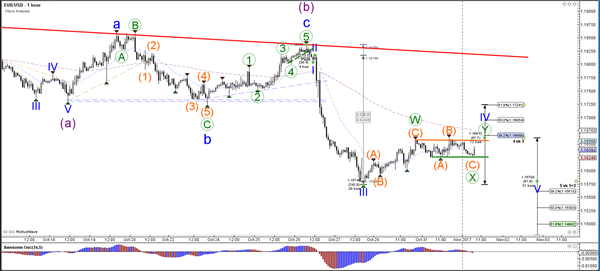
Currency pair EUR/USD
The EUR/USD is still building a bullish retracement within wave 4 (blue). A break below the support of the sideways zone (green) could indicate the continuation of the wave 5 (blue) within a larger wave C (purple).
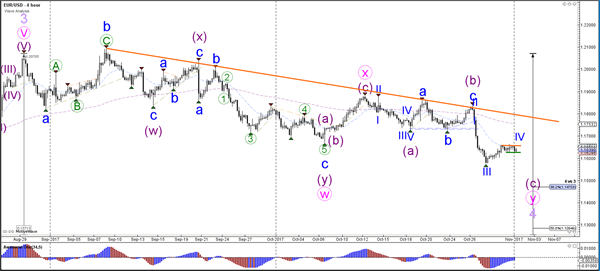
The EUR/USD will most likely complete the wave 4 (blue) if price breaks below the channel (green). In the meantime price could retrace to deeper Fibonacci levels of wave 4 (blue) but typically should not break above the 61.8% Fibonacci level.
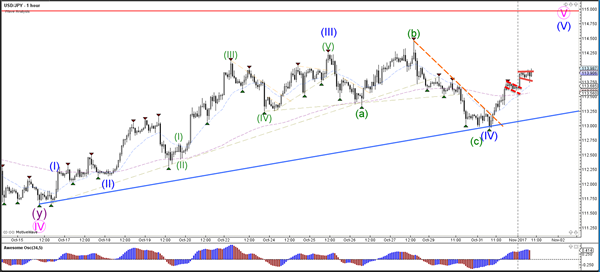
Currency pair USD/JPY
The USD/JPY strong bullish bounce is most likely indicating that one more bullish push is likely towards the 115-resistance level.
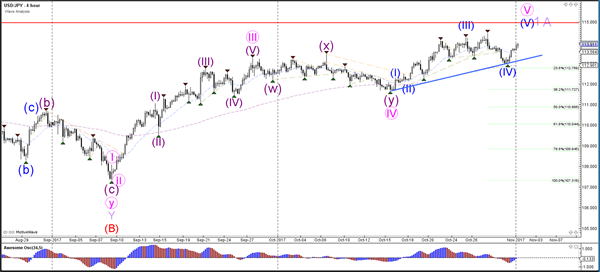
The USD/JPY broke above the resistance trend line (dotted orange) and then broke above the small bull flag chart pattern (dotted red). Price could continue higher if it breaks the next pattern
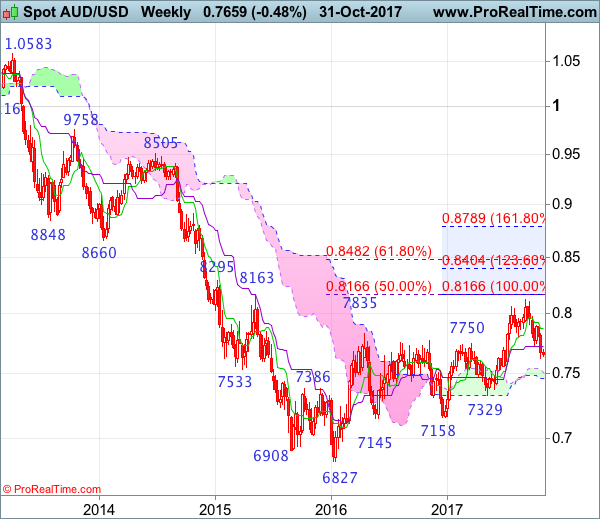
AUD/USD Candlesticks and Ichimoku Analysis
Weekly
• Last Candlesticks pattern: Long white candlestick
• Time of formation: 10 Jul 2017
• Trend bias: Up
Daily
• Last Candlesticks pattern: Long white candlestick
• Time of formation: 18 Jul 2017
• Trend bias: Up
Aussie has dropped again since late last week, justifying our bearish view and the breach of previous support at 0.7733 confirms recent fall from 0.8125 top has resumed, indicated downside target at 0.7680 was met (with 200 points profit), although this move may extend weakness to 0.7600, as this move is still viewed as retracement of early upmove, reckon downside would be limited to 0.7570-75 and support at 0.7535-40 would remain intact due to oversold condition, risk from there has increased for a rebound later.
On the upside, whilst initial recovery from 0.7625 may bring corrective bounce to the Tenkan-Sen (now at 0.7752), reckon upside would be limited to 0.7800 and previous support at 0.7819 should hold and bring another decline later. Only break of indicated resistance at 0.7897 would abort and signal low is formed instead, bring a stronger rebound to 0.7915-20, then towards 0.7970-75, however, still reckon upside would be limited to 0.8000 and price should falter below resistance at 0.8103, bring another decline later.
Recommendation: Short entered at 0.7880 met target at 0.7680 with 200 points profit
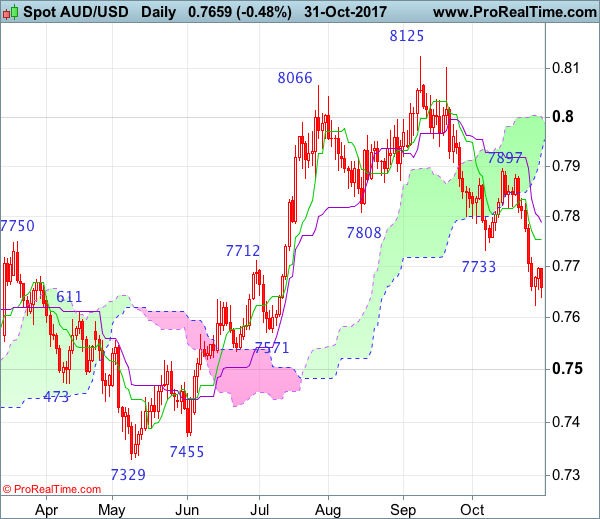
On the weekly chart, last week’s anticipated selloff formed another black candlestick and indicated support at 0.7733 was penetrated, adding credence to our view that top has been formed at 0.8125, hence consolidation with downside bias remains for weakness to 0.7570-75, then towards support at 0.7535, however, near term oversold condition should limit downside to the lower Kumo (now at 0.7462) and reckon support at 0.7372 would hold from here.
On the upside, although initial recovery back to previous support at 0.7733 cannot be ruled out, reckon upside would be limited to 0.7830-35 and price should falter well below the Tenkan-Sen (now at 0.7875), bring another decline later. A weekly close above resistance at 0.7897 would abort and signal low is formed instead, bring a stronger rebound to 0.7950-60 and possibly towards 0.8000 but upside would still be limited and 0.8103 resistance should remain intact, bring another decline later.
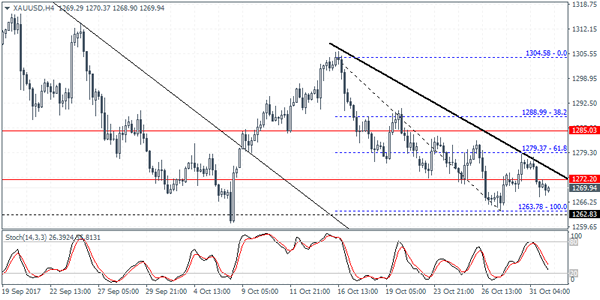
XAUUSD Intraday Analysis
XAUUSD (1269.94): Gold prices were seen trading weaker yesterday as price action fell below the 1272 level of support. This could potentially see a retest back to the lower support level of 1262 where gold prices could be seen testing this region for the third time. The bias remains flat although there is a potential for gold prices to break down below 1262. The possibility of a descending triangle pattern cannot be ruled out. This puts gold prices to the downside, targeting 1238 - 1240 levels in the near term.
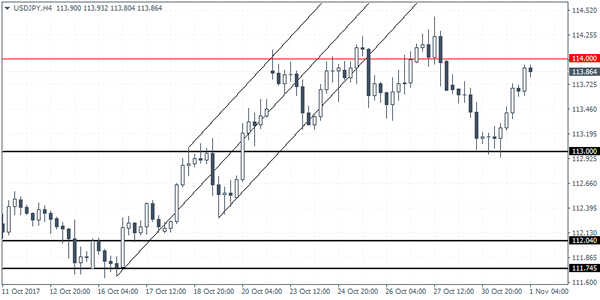
USDJPY Intraday Analysis
USDJPY (113.86): The USDJPY recovered the losses from Monday as price action turned bullish on yesterday's close. Still, the consolidation above 113.00 which marks a short term support level could see the currency pair trading sideways. The bounce off this support level will see USDJPY likely to test the previous resistance level near 114.00. The short-term range looks to be formed for the moment, and a breakout from either of these levels is required to post further gains or losses.
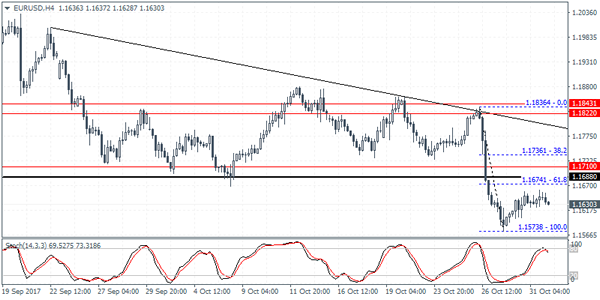
EURUSD Intraday Analysis
EURUSD (1.1630): The EURUSD established a short range yesterday as price action closed with a doji type pattern on the daily session. A bearish decline today could signal a continuation to the downside. This could be expected amid a host of economic releases from the U.S. On the 4-hour chart, price action has formed a potential bearish flag pattern. This could be validated on a close below 1.1573 and will see the euro extending the declines towards 1.1411. However, failure to close below 1.1573 could keep the bias neutral with the potential for price action to retrace the gains back to 1.1688.
Busy Day For The USD: FOMC, ADP Payrolls, And ISM Manufacturing
The markets were seen trading subdued yesterday. The Bank of Japan held its monetary policy steady, and in the Eurozone, flash inflation estimates showed that consumer prices rose 1.4% on the headline and 0.9% on the core. This was weaker than the estimates. However, flash GDP showed a 0.6% increase for the third quarter, while the second quarter GDP was revised higher to 0.7%. In Canada, the monthly GDP data posted a 0.1% decline which missed estimates of a 0.1% increase.
Looking ahead, the economic data today will see the release of the manufacturing PMI for the UK. Economists are forecasting a modest print of 55.8, slightly down from 55.9 in September. The NY trading session will see the ADP private payrolls data coming out. Estimates point to a 202k print for September. Revision for the previous month is expected as well. This is followed by the ISM manufacturing PMI which is expected to show a decline in the index to 59.5 in October, following 60.8 the month before.
The economic calendar concludes later in the day with the FOMC statement and BoC Governor Poloz's speech.
Currencies Stay Range Bound Ahead Of Fed’s Decision
It is a quiet Wednesday in the currency markets. Traders are favoring to remain on the sidelines ahead of multiple key risk events, including the Federal Reserve monetary policy decision latertoday;the Bank of England's rate decision on Thursday;President Trump's nomination of the next Fed Chair; theU.S. tax reform announcement and Friday's NFP report.
Today's FOMC meeting will not be accompanied by an update on economic projections, nor by a press conference. Traders have to act on very few amendments on a 500 words statement. The main theme is unlikely to change, and the Fed will stick to its plans of gradual tightening. However, recent economic releases have shown significant improvement in the U.S. economic activity, and GDP has grown 3% for two consecutive quarters, suggesting that we maysee slight, positive changes in assessing economic activity.
Despite an uptick in headline inflation in September, core CPI continued to miss estimates, and remained below the targeted 2%. Thus, I expect little tono change on inflation assessment.
Overall, the Fed will likely meet market expectations, by keeping interest rates unchanged in November, and signal a rate hike in its final meeting in December.
President Trump's nomination for Fed Chair on Thursday could easily overshadow today's statement, especially if Fed Governor Jerome Powell is not his first choice. Powell has been supportive of Janet Yellen's policy of gradual tightening in monetary policy; thus, I do not expect big moves in Treasuries, or the U.S. dollar, if he is nominated. However, if Stanford University'sProfessor of Economics,John Taylor, is nominatedinstead, expect big moves in Treasury yields and the dollar, which could appreciate sharply against its peers. According to Taylor rule, a forecasting model that determines where interest rates should be, based on targeted inflation and full employment, interest rates should be much higher the current levels.
The Kiwi was the only outperforming currency today, surging 1% against the dollar after labor market statistics showed that the cost of labor grew 1.9%, and the unemploymentrate fell to a nine-year low. If wages continue to show signs of strengthening, the Reserve Bank of New Zealand will likely start raising rates next year, as opposed to earlier forecasts of tightening in 2019.
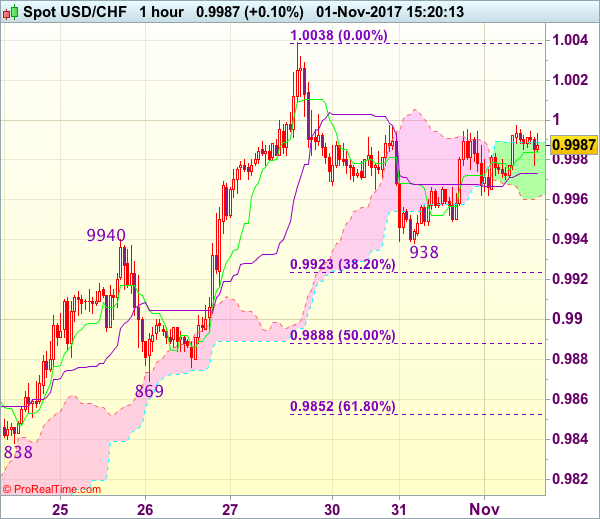
Trade Idea : USD/CHF – Buy at 0.9915
USD/CHF - 0.9987
Most recent candlesticks pattern : N/A
Trend : Up
Tenkan-Sen level : 0.9984
Kijun-Sen level : 0.9973
Ichimoku cloud top : 0.9973
Ichimoku cloud bottom : 0.9961
Original strategy :
Buy at 0.9915, Target: 1.0030, Stop: 0.9880
Position : -
Target : -
Stop : -
New strategy :
Buy at 0.9915, Target: 1.0030, Stop: 0.9880
Position : -
Target : -
Stop : -
Although dollar found support at 0.9938 and recovered since, reckon 1.0000-05 would limit upside and near term downside risk remains for the corrective fall from 1.0038 (last week’s high) to bring retracement of recent rise to 0.9920-25 (38.2% Fibonacci retracement of 0.9737-1.0038), however, 0.9905-10 should limit downside and bring another rise later, above 1.0000-05 would bring retest of said resistance at 1.0038, break there would extend recent rise from 0.9421 low to 1.0050-55, then towards 1.0075-80 but price should falter below 1.0100 resistance.
In view of this, we are looking to buy dollar again on pullback as 0.9915-25 should limit downside, bring another rise later. Below 0.9885-90 (50% Fibonacci retracement of 0.9737-1.0038) would defer and suggest top is possibly formed, risk test of support at 0.9869.
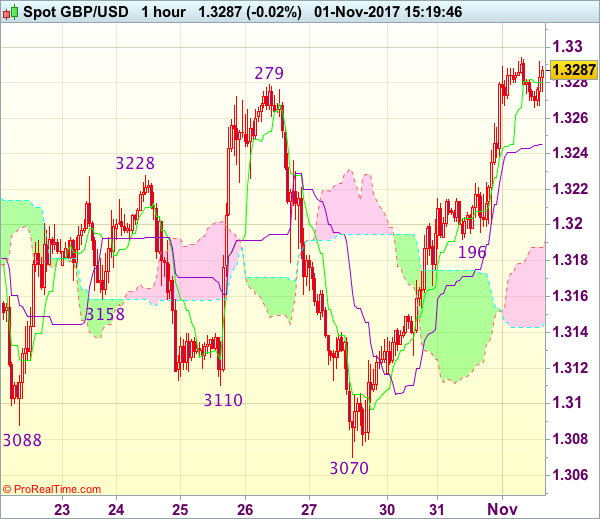
Trade Idea : GBP/USD – Stand aside
GBP/USD - 1.3288
Most recent candlesticks pattern : N/A
Trend : Near term up
Tenkan-Sen level : 1.3281
Kijun-Sen level : 1.3246
Ichimoku cloud top : 1.3187
Ichimoku cloud bottom : 1.3143
Original strategy :
Sold at 1.3255, stopped at 1.3290
Position : - Short at 1.3255
Target : -
Stop : - 1.3290
New strategy :
Stand aside
Position : -
Target : -
Stop : -
As cable has surged again and broke above indicated previous resistance at 1.3279-87, suggesting early erratic rise from 1.3027 low is still in progress and near term upside risk remains for this move to bring retracement of early decline to 1.3310, then towards resistance at 1.3338, however, as broad outlook remains consolidative, reckon upside would be limited and price should falter below 1.3380-90, bring retreat later.
In view of this, would not chase this rise here and would be prudent to stand aside for now. below the Kijun-Sen (now at 1.3246) would bring pullback to 1.3215-20 but only break of minor support at 1.3196 would signal top is formed, bring further fall to 1.3170, then test of the lower Kumo (now at 1.3143) which is likely to hold from here.
Trade Idea : EUR/USD – Sell at 1.1700
EUR/USD - 1.1647
Most recent candlesticks pattern : N/A
Trend : Down
Tenkan-Sen level : 1.1640
Kijun-Sen level : 1.1643
Ichimoku cloud top : 1.1635
Ichimoku cloud bottom : 1.1616
Original strategy :
Sell at 1.1700, Target: 1.1595, Stop: 1.1735
Position : -
Target : -
Stop : -
New strategy :
Sell at 1.1700, Target: 1.1595, Stop: 1.1735
Position : -
Target : -
Stop : -
Euro’s near term sideways trading is likely to continue and although initial upside risk remains for the rebound from 1.1574 low to extend gain to 1.1670-75 (38.2% Fibonacci retracement of 1.1837-1.1574), as this move is still viewed as retracement of recent decline, reckon upside would be limited to 1.1700-05 (50% Fibonacci retracement) and bring retreat later, below 1.1600-05 would signal the rebound from 1.1574 low has ended, bring retest of this level first. A drop below said support at 1.1574 would extend recent decline from 1.2093 top to 1.1550-55 but loss of downward momentum should prevent sharp fall below 1.1520-25 and reckon 1.1500 would hold.
In view of this, we are looking to sell euro on further subsequent recovery as 1.1700-05 should limit upside and bring another decline. Only above previous support at 1.1725 (now resistance) would signal low is formed instead, bring retracement of recent decline to 1.1750-55 first.