
Sample Category Title
Trade Idea : USD/JPY – Buy at 113.00
USD/JPY - 113.39
Most recent candlesticks pattern : N/A
Trend : Near term up
Tenkan-Sen level : 113.37
Kijun-Sen level : 113.61
Ichimoku cloud top : 113.68
Ichimoku cloud bottom : 113.20
Original strategy :
Buy at 113.20, Target: 114.20, Stop: 112.85
Position : -
Target : -
Stop : -
New strategy :
Buy at 113.00, Target: 114.00, Stop: 112.65
Position : -
Target : -
Stop : -
Although rose to 114.10 after opening higher yesterday, the subsequent retreat suggests consolidation below this level would be seen and pullback to 113.20 (50% Fibonacci retracement of 112.30-114.10) cannot be ruled out, however, reckon 112.95-00 (61.8% Fibonacci retracement) would hold and bring another rise later, above 113.80 would suggest the pullback from 114.10 has ended, bring retest of this resistance but break there is needed to confirm recent rise from 111.65 has resumed for headway to 114.40-50 but reckon 114.75-80 would hold from here.
In view of this, we are looking to buy dollar again on further pullback as 112.95-00 should limit downside and bring another rise. Below 112.65-70 would abort and signal top is formed instead, risk test of indicated support at 112.30 which is likely to hold from here.

Loonie Reverses Its Losses In The Asian Session
For the 24 hours to 23:00 GMT, the USD rose 0.13% against the CAD and closed at 1.2644.
In the Asian session, at GMT0300, the pair is trading at 1.2629, with the USD trading 0.12% lower against the CAD from yesterday’s close.
The pair is expected to find support at 1.2609, and a fall through could take it to the next support level of 1.2588. The pair is expected to find its first resistance at 1.2655, and a rise through could take it to the next resistance level of 1.2680.
With no macroeconomic releases in Canada today, investors will focus on global macroeconomic factors for further direction.
The currency pair is trading between its 20 Hr and 50 Hr moving averages.

GBP/USD Elliott Wave Analysis
GBP/USD – 1.3254
Although sterling found support at 1.3088 late last week and has recovered, suggesting consolidation would be seen, however, reckon upside would be limited to 1.3240-50 and bring another decline, a daily close below said support at 1.3088 would signal the rebound from 1.3027 low has ended and bring retest of this level. Looking ahead, a drop below this level would signal the fall from 1.3658 top has resumed for weakness to 1.3000, then towards 1.2950 but support at 1.2909 should limit downside and another previous support at 1.2852 would remain intact.
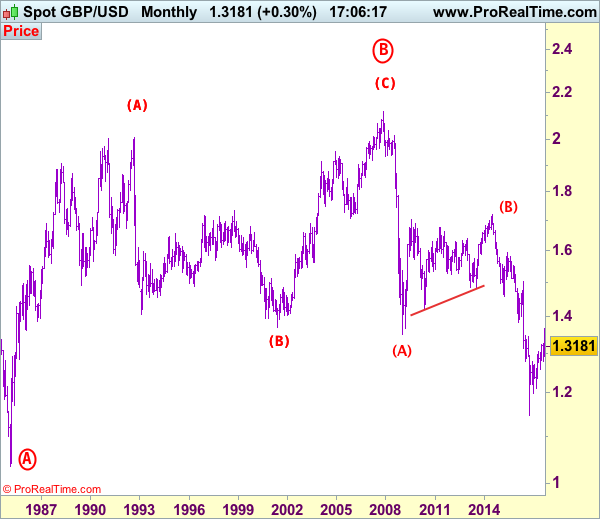
Our preferred count on the daily chart is that cable's rebound from 1.3500 (wave (A) trough) is unfolding as a wave (B) with A ended at 1.7043, followed by triangle wave B and wave C as well as wave (B) has possibly ended at 1.7192, below support at 1.4232 would add credence to this count, then further fall to 1.4000 level would follow but reckon downside would be limited to 1.3655 support and price should stay above previous support at 1.3500.
On the upside, expect recovery to be limited to 1.3240-50 and bring another decline. Above resistance at 1.3287 would defer and suggest the retreat from 1.3338 has ended at 1.3088 and risk a stronger rebound to 1.3300, then towards 1.3338-43 resistance level, break there would extend the rebound from 1.3027 low to 1.3400 and possibly towards resistance at 1.3455, however, if our view that top has been formed at 1.3658 is correct, upside would be limited and bring another decline later.
Recommendation: Hold short entered at 1.3300 for 1.3050 with stop lowered to 1.3250.

Longer term - Cable's rise from 1.0520 (Feb 1985) to 2.0100 (September 1992) is seen as [A], the decline to 1.3682 is labeled as (B) and (C) wave rally has ended at 2.1162 (9 Nov, 2007) which is also the top of larger degree wave B with circle. The selloff from there is a 5-waver with wave (A) ended at 1.3500 (23 Jan 2009), wave (B) itself is labeled as A: 1.6733, triangle wave B: 1.4813 and wave C as well as top of wave (B) ended at 1.7192 (2014), hence the selloff from there is an impulsive wave (C) with wave I : 1.4566, wave II 1.5930, an extended wave III is unfolding and already exceeded our downside target at 1.3500 and 1.3000, hence weakness to 1.2500 and possibly 1.2000 cannot be ruled out, however, price should stay well above psychological level at 1.0000.
GBP/CHF Elliott Wave Analysis
GBP/CHF – 1.3010
As sterling found renewed buying interest at 1.2829 late last week and has rebounded again, retaining our bullishness and consolidation with mild upside bias remains for the rebound from 1.2746 low to extend gain to 1.3050-60, however, reckon upside would be limited to 1.3105-10 and price should falter well below said resistance at 1.3197, bring retreat later. In the event sterling is able to penetrate said resistance at 1.3195, this would indicate early erratic rise from 1.1475 has resumed for further gain to 1.3250, then towards 1.3300-10 but overbought condition should prevent sharp move beyond 1.3400 and reckon 1.3526 (previous support) would remain intact.
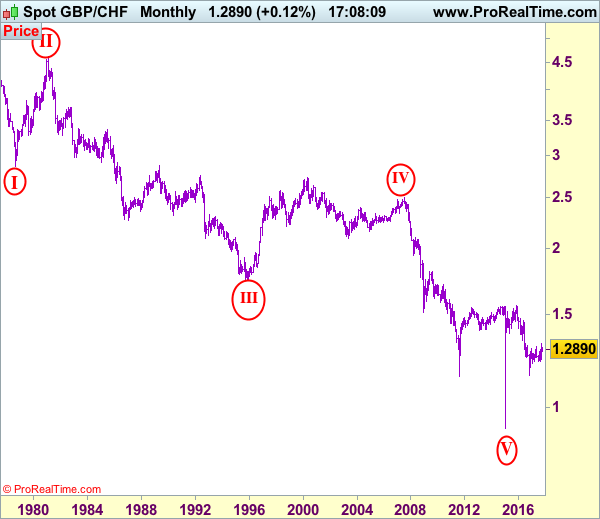
To recap the larger degree count, the selloff from 2.4965 (July 2007) is the beginning of wave V with circle and is labeled as 1: 2.3760, 2: 2.4425, wave 3 extension ended at 1.1470, followed by wave 4 at 1.5547, the quick rebound from 0.9106 suggests wave 5 as well as entire circle wave V could have ended there, hence consolidation with mild upside bias is seen for major correction to take place, bring initial test of 1.5547 (previous 4th of a lesser degree).
On the downside, expect pullback to be limited to 1.2930-40 and said support at 1.2829 should remain intact, bring another rebound later. A drop below this level would suggest the rebound from 1.2746 has ended instead, bring retest of this level later. A break below 1.2746 support would signal the fall from 1.3197 top is still in progress for retracement of recent rise to support at 1.2716, a daily close below this level would suggest a temporary top has been formed, bring correction to 1.2650-60 and later towards 1.2600.
Recommendation: Hold long entered at 1.2800 for 1.3050 with stop below 1.2825.

On the Monthly chart, the longer-term count is that major downtrend is under way with circle wave I at 2.8645 (Sep 1.978), then wave II with circle at 4.6175 (Feb 1981), the wave III with circle ended at 1.7425 (Nov 1995) and followed by wave IV with circle at 2.4965 (July 2007 with a short wave C) and wave V with circle has possibly ended at 0.9106. A monthly close above 1.5547 would add credence to this view, bring major correction to 1.7000, then towards psychological level at 2.0000.
Trade Idea: GBP/USD – Stand aside
GBP/USD – 1.3219
New strategy :
Stand aside
Position: -
Target: -
Stop:-
As sterling has rebounded after last week’s anticipated fall to 1.3088, retaining our view that further consolidation would be seen and test of resistance at 1.3229 cannot be ruled out, however, break there is needed to suggest the fall from 1.3338 has ended at 1.3088, then a stronger rebound to 1.3287 resistance cannot be ruled out, having said that, price should falter well below resistance at 1.3338 and bring further choppy trading later.
On the downside, whilst pullback to 1.3155-60 cannot be ruled out, reckon 1.3115-20 would hold and bring further sideways trading. Only a break below said support at 1.3088 would revive bearishness for resumption of recent decline towards recent low at 1.3027. Our preferred count is that (pls see the attached chart) the wave IV is unfolding as a complex double three (ABC-X-ABC) correction with 2nd wave B ended at 1.2774, hence 2nd wave C could have ended at 1.3658.
Our preferred count on the daily chart is that cable's rebound from 1.3500 (wave (A) trough) is unfolding as a wave (B) with A ended at 1.7043, followed by triangle wave B and wave C as well as wave (B) has ended at 1.7192, the subsequent selloff is the larger degree wave (C) which is still unfolding with minor wave (III) of larger degree wave 3 ended at 1.1986, hence wave (IV) correction is in progress which could either be a triangle wave (IV) of a complex formation but upside should be limited to 1.3500 and price should falter well below 1.4000, bring another decline in wave (V) of 3 for weakness to 1.1500, then 1.1200.

Trade Idea: GBP/JPY – Hold long entered at 149.50
GBP/JPY - 149.85
Original strategy:
Bought at 149.50, Target: 151.50, Stop: 148.90
Position: - Long at 149.50
Target: - 151.50
Stop: - 148.90
New strategy :
Hold long entered at 149.50, Target: 151.50, Stop: 148.90
Position: - Long at 149.50
Target: - 151.50
Stop:- 148.90
Although sterling has retreated after meeting resistance at 150.50 yesterday and consolidation below this level would be seen, reckon pullback would be limited to previous resistance at 149.40 and bring another rise later, above said resistance would extend the erratic rise from 146.95 for a retracement of the fall from 152.85 to 150.50-55 and possibly 151.00 but still reckon upside would be limited to resistance at 151.60, bring retreat later.
In view of this, we are holding on to our long position entered at 149.50. Below 148.90-00 would defer and risk weakness to 148.55-60, break there would signal top is formed instead, then weakness to indicated support at 147.80 would follow. Once this level is penetrated, this would signal the rebound from 146.95 has ended, bring weakness to another previous support at 147.30, below would confirm the fall from 152.85 has resumed for retest of 146.95. Looking ahead, below there would extend the fall from 152.85 top for retracement of recent upmove to 146.60-65 and then 146.00 but previous support at 145.25 should remain intact.
Our preferred count is that larger degree wave V with circle is unfolding from 251.12 with wave (I) 219.34, (II): 241.38 and wave (III) is subdivided into 1: 192.60, 2: 215.89 (23 Jul 2008) and wave 3 ended at 118.87 earlier in 2009. The correction from there to 162.60 is wave 4 which itself is a double three and is labeled as first a-b-c ended at 151.53, followed by wave x at 139.03, 2nd a ended at 162.60, 2nd b at 146.75 and 2nd c leg of wave 4 ended at 163.00. Therefore, the decline from 163.00 to 116.85 is now treated as wave 5 which also marked the end of larger degree wave (III), hence wave (IV) major correction has commenced for retracement of the wave (III) from 241.38 and upside target at 183.95-00 (50% Fibonacci retracement of the wave (II) from 241.38) had been met, a drop below 160.00 would suggest wave (IV) has ended at 195.85, bring decline in wave (V) for initial weakness to 130 (already met) and 120.

Trade Idea: EUR/JPY – Hold long entered at 133.20
EUR/JPY - 133.34
Original strategy:
Bought at 133.20, Target: 135.20, Stop: 132.60
Position: - Long at 133.20
Target: - 135.20
Stop: - 132.60
New strategy :
Hold long entered at 133.20, Target: 135.20, Stop: 132.60
Position: - Long at 133.20
Target: - 135.20
Stop:- 132.60
Although the single currency rose to as high as 134.13, as the retreated after meeting resistance there, suggesting consolidation below this level would be seen, however, reckon 133.00 would limit downside and bring another rise later, above said resistance would bring a retest of recent high at 134.41, break there would confirm early upmove has resumed and extend headway to 135.00-10 and later towards 135.50-60 which is likely to hold from here due to overbought condition.
In view of this, we are holding on to our long position entered at 133.20. Only below said support at 132.47 would abort and prolong choppy trading, risk weakness to 132.00, having said that, strong support at 131.66 should remain intact, bring another rebound later.
Our latest preferred count is that wave (ii) is ABC-X-ABC which ended at 123.33 and wave (iii) is unfolding with wave iii ended at 100.77, followed by wave iv at 111.57 and wave v as well as the wave (iii) has ended at 97.04, followed by wave (iv) at 111.43 and wave (v) has ended at 94.12 which is also the end of the larger degree v, this also implied the major wave (C) has also ended there, hence major correction has commenced from there with (A) leg unfolding in its lower degree wave c which has possibly ended at 145.69. Under this count, A-B-C wave (B) has commenced with A leg ended at 136.23, wave B at 143.79 and wave C has possibly ended at 149.79.
Our larger degree count is that the decline from 139.26 is wave (C) and is sub-divided into a diagonal triangle i-ii-iii-iv-v with wave i - 105.44, wave ii- 123.33, wave iii - 97.03, wave iv - 111.43, followed by the final wave v as well as the end of wave (C) at 94.12, this also mark the bottom of larger degree wave B. Under this count, major rise in wave C has commenced as an impulsive wave with minor wave III ended at 145.69, wave V is still in progress for further gain to 150.00. Having said that, this so-called wave V could well be the first leg of larger degree 5-waver wave C and this wave C should bring at least a retest of wave A top at 169.97 (July 2008).

Trade Idea: AUD/USD – Hold short entered at 0.7875
AUD/USD – 0.7818
Original strategy:
Sold at 0.7875, Target: 0.7700, Stop: 0.7890
Position: - Short at 0.7875
Target: - 0.7700
Stop:- 0.7935
New strategy :
Hold short entered at 0.7875, Target: 0.7700, Stop: 0.7860
Position: - Short at 0.7875
Target: - 0.7700
Stop:- 0.7860
Although aussie recovered after finding support at 0.7796 and minor consolidation above this level would be seen, reckon upside would be limited to 0.7840 and bring another decline, below said support would extend the fall from 0.7897 to support at 0.7771, however, break there is needed to signal the rebound from 0.7733 has ended at 0.7897, bring a retest of said support at 0.7733, below there would confirm recent fall from 0.8125 top has resumed for weakness to 0.7700-10 and later towards 0.7660-65.
In view of this, we are holding on to our short position entered at 0.7875. Only above previous support at 0.7908 (now resistance) would defer and risk a stronger rebound to 0.7950 but resistance at 0.7986 should remain intact and bring another decline later.
On the 4-hour chart, recent upmove from 0.7329 is unfolding as an impulsive rise with wave 3 as well as smaller degree wave (iii) extending, only minor wave v of (iii) has ended at 0.8125, hence bullishness remains for this move to extend headway to 0.8200, then towards 0.8300, however, reckon upside would be limited to 0.8400 and the final wave 5 should falter below 0.8500, bring correction later.

GBP/USD Candlesticks and Ichimoku Analysis
Weekly
• Last Candlesticks pattern: Shooting star
• Time of formation: 31 Jul 2017
• Trend bias: Down
Daily
• Last Candlesticks pattern: Morning star
• Time of formation: 25 Aug 2017
• Trend bias: Near term up
GBP/USD – 1.3215
Although cable fell marginally to 1.3088 late last week, lack of follow through selling and the subsequent rebound suggest further consolidation would be seen and recovery to 1.3240-45 (61.8% Fibonacci retracement of 1.3338-1.3088), however, resistance at 1.3287 should limit upside and bring another decline later. Below said support at 1.3088 would extend the fall from 1.3388 to 1.3075 but break there is needed to signal decline from 1.3658 top has resumed and bring retest of 1.3027 but only break there would retain bearishness and extend this move to 1.3000, then towards 1.2940-50.
On the upside whilst recovery to 1.3240-45 cannot be ruled out, resistance at 1.3287 should hold and bring another decline. A daily close above said resistance at 1.3287 would suggest the retreat from 1.3338 has ended, bring another test of this level but a daily close above the Kijun-Sen (now at 1.3343) is needed to suggest the fall from 1.3658 has ended, bring a stronger rebound to 1.3400, then test of previous resistance at 1.3455 which is likely to hold on first testing.
Recommendation: Stand aside for this week.

On the weekly chart, cable remained confined within early established range and further consolidation would be seen and as the pair found support at 1.3088 and recovered, initial bounce to 1.3240-45 and possibly 1.3287 cannot be ruled out, however, reckon upside would be limited to 1.3338 and bring another decline later. Only a sustained breach above this level would suggest the retreat from 1.3658 has ended instead, bring further gain to 1.3400-05 but still reckon upside would be limited to 1.3505-10 and bring another leg of corrective decline later. In the event sterling breaks above 1.3571 resistance, this would signal the pullback from 1.3658 has ended, risk retest of this last month’s high, break there would extend recent erratic rise from 1.1986 low to 1.3750-60 and 1.3800 but overbought condition should prevent sharp move beyond 1.3860 (61.8% Fibonacci retracement of 1.5018-1.1986).
On the downside, expect pullback to be limited to 1.3130-35 and said support at 1.3088 should hold, bring another rebound. A weekly close below 1.3088 support would signal the rebound from 1.3027 low has ended, bring retest of 1.3027, break of this support would add credence to our view that top has been formed at 1.3658, bring further fall to 1.3000, then towards support at 1.2909, however, anticipated near term oversold condition should prevent sharp fall below previous chart support at 1.2774 and price should stay well above another previous chart support at 1.2589, bring rebound later.

USD/CHF Candlesticks and Ichimoku Analysis
Weekly
• Last Candlesticks pattern: Shooting star
• Time of formation: 7 Mar 2017
• Trend bias: Sideways
Daily
• Last Candlesticks pattern: Morning star
• Time of formation: 9 May 2017
• Trend bias: Near term up
USD/CHF – 0.9854
As the greenback has risen again after brief retreat to 0.9737 late last week, suggesting the rise from 0.9421 low is still in progress, hence bullishness remains for this move to extend further gain to 0.9900-10, however, as this move is still viewed as retracement of early decline from 1.0344, reckon upside would be limited to 0.9950-60 and 0.9991-1.0000 (61.8% Fibonacci retracement of 1.0344-0.9421) should hold from here due to near term overbought condition, bring retreat later.
On the downside, whilst initial pullback to 0.9800-05 cannot be ruled out, reckon downside would be limited to 0.9760-70 and bring another rise later. A daily close below said support at 0.9737 would defer and suggest a temporary top is possibly formed instead, risk weakness to 0.9700, then test of minor support at 0.9670. A drop below this level would suggest the rise from 0.9421 has ended instead, risk further fall to 0.9642 support but reckon downside would be limited to 0.9590-00 and support at 0.9565 should remain intact.
Recommendation: Buy at 0.9770 for 0.9970 with stop below 0.9670.

On the weekly chart, as the greenback has edged higher again after forming a white candlestick last week, adding credence to our near term bullishness for the rebound from 0.9421 low to bring retracement of recent entire decline from 1.0344, hence further gain to the lower Kumo (now at 0.9894), then test of the upper Kumo (now at 0.9970) would be seen, however, near term overbought condition should limit upside to 0.9991-1.0000 (61.8% Fibonacci retracement of 1.0344-0.9421 and psychological resistance) and price should falter well below resistance at 1.0100-08.
On the downside, although initial pullback to 0.9800-05 is likely, support at 0.9737 would contain downside and bring another rise. A weekly close below 0.9737 would defer and suggest first leg of rebound from 0.9737 has ended and bring weakness to 0.9690-00 but reckon support at 0.9642 would limit downside and price should stay above support at 0.9565 and the greenback shall stage another strong rebound later this month or next month.
