Sample Category Title
Trade Idea Update: USD/JPY – Buy at 113.20
USD/JPY - 113.75
Original strategy :
Buy at 113.20, Target: 114.20, Stop: 112.85
Position : -
Target : -
Stop : -
New strategy :
Buy at 113.20, Target: 114.20, Stop: 112.85
Position : -
Target : -
Stop : -
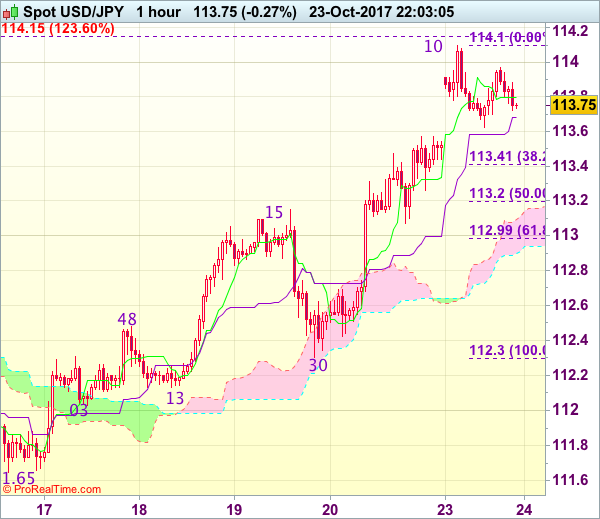
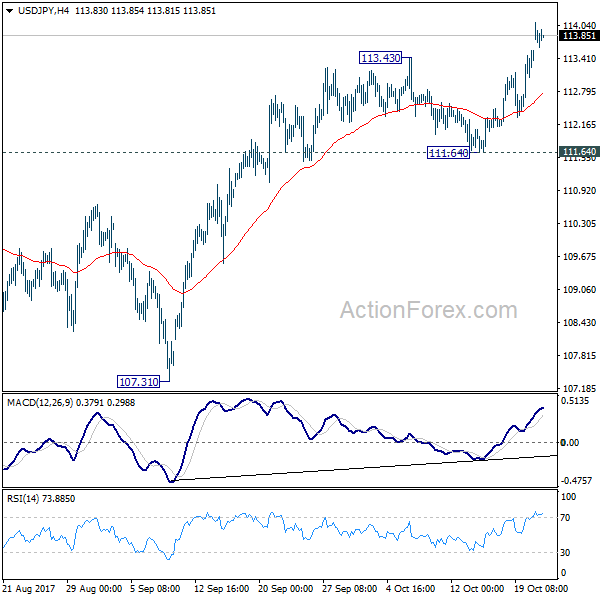
Although the greenback opened higher and rose to 114.10, current retreat suggests consolidation below this level would be seen and pullback to 113.40-45 (38.2% Fibonacci retracement of 112.30-114.10) cannot be ruled out, however, reckon 113.15-20 (previous resistance and 50% Fibonacci retracement) would hold and bring another rise later, above said resistance at 114.10 would extend recent rise from 111.65 to 114.40-50 but reckon 114.75-80 would hold from here due to oversold condition.
In view of this, we are looking to buy dollar again on pullback as 113.15-20 should limit downside and bring another rise. Below the lower Kumo (now at 112.72) would defer and suggest top is possibly formed instead, risk test of indicated support at 112.30 which is likely to hold from here.
Gold Correction In Play
The yellow metal dropped after the morning gap and reached new lows. The rate is almost to reach a first downside target, where he may find temporary support again. Is located at $1275 per ounce as has squeezed a little in the last hours. Gold dropped as the USDX has forced to climb much higher on the short term. The dollar index stands much above the 93.81 static resistance, but we'll see in the upcoming days if this will be a valid breakout.
Technically, the USDX is somehow expected to climb much higher on the short term after the failure to reach and retest the 92.49 static support. The Gold drops as the dollar received a helping hand from the United States data. Personally, I believe that the USDX still needs a boost from the fundamental factors to be able to stabilize above the 93.81 level because technically is located below several resistance levels again.
Gold dropped further after the breakdown below the 50% retracement level and now is almost to hit the sliding parallel line (SL) of the major ascending pitchfork. Technically, it should breakdown through the sliding line (SL) after the retest of the WL1. Is on a declining path, could move downwards between the WL1 and the 150% Fibonacci line. A valid breakdown below the SL will signal a larger drop in the upcoming weeks.
Brent Oil Break or Bounce?
Brent has managed to recover in the Friday's trading session and closed the week above the median line (ML) of the major ascending pitchfork and above the 57.72 static resistance. The rate decreased today and retested the mentioned support levels, so only a valid breakdown below the Ml will announce a further drop in the upcoming period. An increase will be confirmed by a breakout above the upper median line (ml) of the minor descending pitchfork.
EUR/GBP On The Way Down
The EUR/GBP opened with a gap down today and dropped further. Technically, it should drop much below the 0.8900 psychological level, we have an important downside target at the 0.8813. Support can be found at the third warning line (wl3) as well. Should drop much deeper after the several false breakouts above the ML, the major downside target will be at the LML.
Elliott Wave Analysis: Long-term View On GBPUSD Still Bearish
Good Monday traders! Hope you had a nice weekend, and a pleasant Sunday. Let's take a look at GBPUSD and its long-term look.
On the weekly chart of GBPUSD we can see that price is looking overall bearish. We see a nice impulsive structure in the making, with price trading in one of its corrective waves. We are talking about wave IV), that can be ending its temporary rally. Sub-waves A-B and now C may have fully unfolded, which means a new drop lower may follow in weeks and months ahead. We can also see that some important Fibonacci ratios had been hit near the 38.2 and 50.0 region and even former swing high of lower degree wave IV, where all can offer resistance and a truning point. On that note, a minor fall in five-waves and a breach below the 1.23000 region would indicate final red wave V) to be in progress.
EURGBP Extends Weakness after Double Upside Rejection
The cross holds in red on Monday and extended weakness from Friday, when it fell 0.8% after repeated rejection under daily cloud.
Daily cloud is thickening after twisting today and producing increased pressure, together with double-top which has formed on daily chart (12 / 20 Oct highs).
Close below 0.8919 (Fibo 61.8% of 0.8855/0.9022) would generate bearish signal for extension through daily Kijun-sen (0.8889) towards key near-term support at 0.8855 (16 Oct low / Fibo 61.8% of larger 0.8745/0.9032 upleg).
Break here is needed to confirm completion of double-top pattern and spark fresh bearish acceleration towards targets at 0.8813/00 (Fibo 76.4% / round-figure support).
Broken Tenkan-sen (0.8944) is expected to limit recovery attempts and keeps near-term bears intact.
Res: 0.8929; 0.8944; 0.9005; 0.9014
Sup: 0.8889; 0.8855; 0.8813; 0.8800
Euro Can’t Catch a Break, Gold Sinks
The vulnerable Euro tumbled into the trading week under renewed selling pressure, thanks to brewing political chaos in Catalonia.
Spain's government invoked Article 155 of the constitution over the weekend, in a move designed to weaken Catalonia president, Carles Puigdemont, and seize control of the region's administration. Reports are circulating that officials in Catalonia would disobey orders from the Spanish government if Madrid enforced direct rule on the region, suggesting things could get messy. Anxiety is likely to heighten ahead of a vote by Spain's upper house on Catalonia's takeover this Friday, which may spell more pain for the Euro.
With political drama in Spain punishing the Euro, could Mario Draghi offer a lifeline to the currency on Thursday? Although expectations remain elevated over the European Central Bank QE tapering this month, investors still need clarity on how much the monthly purchases will be reduced by in 2018 and how long tapering will last. If Draghi adopts a cautious stance, and suggests that QE may be extended beyond 2018, the Euro is at risk of depreciating further as markets acknowledge this as a dovish taper.
Taking a look at the technical picture, the EURUSD remains pressured on the daily charts. A breakdown below 1.1730 may encourage a further decline, towards 1.1680.
Commodity spotlight - Gold
A renewed sense of optimism over Trump's tax reforms and strengthening US Dollar dulled Gold's allure on Monday, with prices sinking to a two-week low, below $1275.
The yellow metal is coming under selling pressure on the daily charts, with sustained weakness below the $1280 encouraging a further decline towards $1267. While geopolitical tensions and headlines centered on Spain have offered some support to Gold bulls, the current price action suggests that bears are winning the battle. With the economic calendar fairly light today, the present downside may encourage bears to attack prices lower. From a technical standpoint, previous support around $1280 could transform into a dynamic resistance, opening a path towards $1267. With weekly bulls displaying weakness after Gold secured a weekly low of $1280, the next levels of interest are $1267, $1260 and $1250.
USD/JPY Mid-Day Outlook
Daily Pivots: (S1) 112.81; (P) 113.18; (R1) 113.88; More...
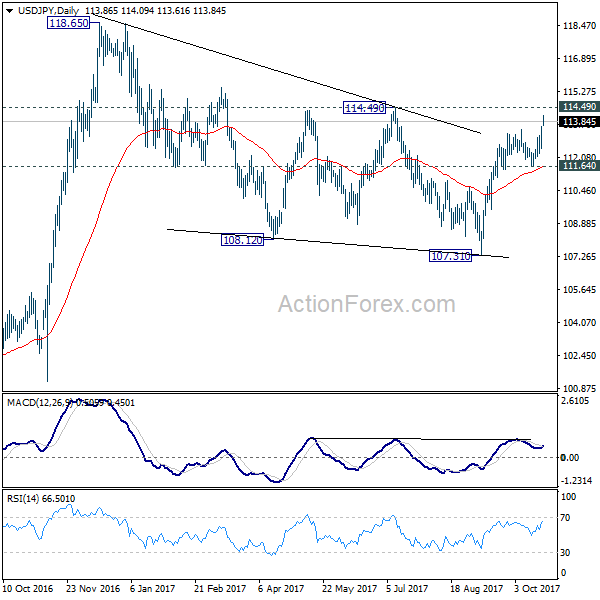
Intraday bias in USD/JPY remains on the upside for 114.49 resistance . As noted before, correction pattern from 118.65 could have completed at 107.31 already. Decisive of 114.49 resistance should confirm this bullish case and target 118.65 resistance and above. For now, this will be the preferred case as long as 111.64 support holds.
In the bigger picture, medium term rise from 98.97 (2016 low) is not completed yet. It should resume after corrective fall from 118.65 completed. Break of 114.49 resistance will likely resume the rise to 61.8% projection of 98.97 to 118.65 from 107.31 at 119.47 first. Firm break there will pave the way to 100% projection at 126.99. This will be the key level to decide whether long term up trend is resuming.
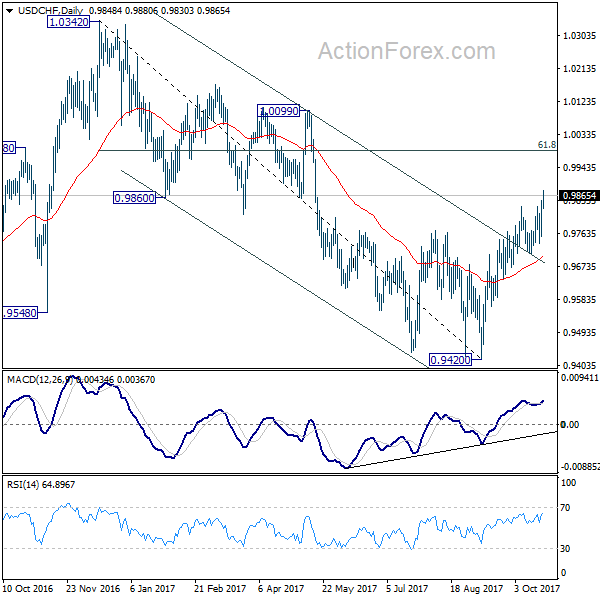
USD/CHF Mid-Day Outlook
Daily Pivots: (S1) 0.9773; (P) 0.9813; (R1) 0.9875; More....
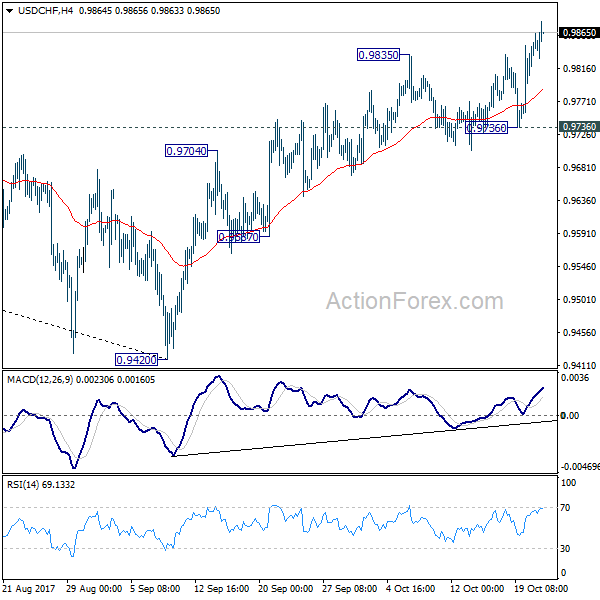
USD/CHF's rise from 0.9420 is still in progress and intraday bias remains on the upside. As noted before, medium term fall from 1.0342 should have completed at 0.9420 already. Further rally would be seen back to 61.8% retracement of 1.0342 to 0.9420 at 0.9990. Sustained break there will pave the way to retest 1.0342 high. However, break of 0.9736 support will mixed up the near term outlook and turn bias back to the downside for 0.9587 support instead.
In the bigger picture, current development suggests that USD/CHF has defended 0.9443 (2016 low) key support level again. Rise from 0.9420 could develop into a medium term move and target a test on 1.0342 high. This represents the upper end of a long term range that started back in 2015. On the downside, break of 0.9587 support is now needed to indicate completion of the rise from 0.9420. Otherwise, further rally will remain in favor in medium term.
GBP/USD Mid-Day Outlook
Daily Pivots: (S1) 1.3113; (P) 1.3157; (R1) 1.3226; More....
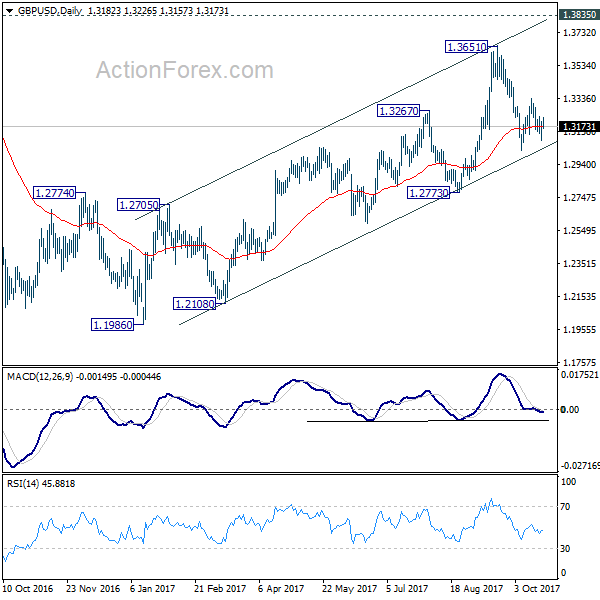
At this moment, intraday bias in GBP/USD stays neutral. On the downside, break of 1.3026 will resume the decline from 1.3651 and target 1.2773 key support level. This will also revive the case of medium term reversal. Meanwhile, on the upside, break of 1.3337 will resume the rebound from 1.3026 to 61.8% retracement of 1.3651 to 1.3026 at 1.3412 and above.
In the bigger picture, while the medium term rebound from 1.1946 was strong, GBP/USD hit strong resistance from the long term falling trend line. Outlook is turned a bit mixed and we'll stay neutral first. On the downside, decisive break of 1.2773 key support will argue that rebound from 1.1946 has completed. The corrective structure of rise from 1.1946 to 1.3651 will in turn suggest that long term down trend is now completed. Break of 1.1946 low should then be seen. On the upside, break of 1.3835 support turned resistance will revive the case of trend reversal and target 38.2% retracement of 2.1161 (2007 high) to 1.1946 (2016 low) at 1.5466.