Sample Category Title
Forex Technical Analysis: EUR/USD, USD/JPY, GBP/USD
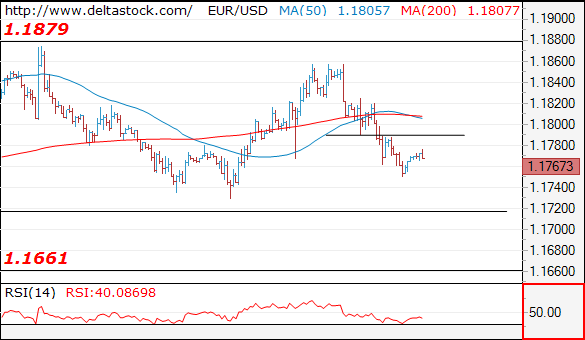
EUR/USD
Current level - 1.1767
The intraday outlook remains bearish below 1.1790, for a slide towards 1.1715 area. Only a violation of 1.1790 will signal a reversal of the slide from 1.1860.
| Resistance | Support | ||
| intraday | intraweek | intraday | intraweek |
| 1.1790 | 1.1940 | 1.1715 | 1.1660 |
| 1.1880 | 1.2030 | 1.1660 | 1.1480 |
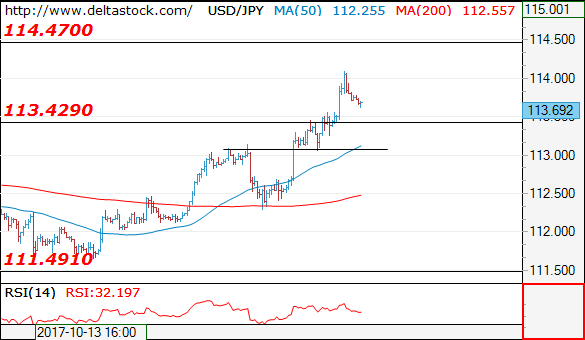
USD/JPY
Current level - 113.69
The uptrend is intact, heading towards 114.50, en route to 115.50 zone. Key support lies at 113.50 and crucial on the downside is 113.10.
| Resistance | Support | ||
| intraday | intraweek | intraday | intraweek |
| 114.50 | 114.50 | 113.10 | 111.00 |
| 115.50 | 115.50 | 112.30 | 107.30 |
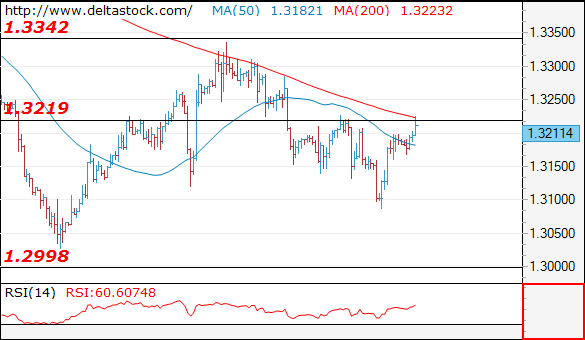
GBP/USD
Current level - 1.3211
A reversal has been confirmed at 1.3085 and the intraday bias is positive, with a risk of a rise towards 1.3340 hurdle. On the senior frames the current leg should be the final one of the prolonged consolidation above 1.3020, preceding a renewal of the general slide towards 1.2590. Minor intraday support lies at 1.3160.
| Resistance | Support | ||
| intraday | intraweek | intraday | intraweek |
| 1.32220 | 1.3340 | 1.3160 | 1.2910 |
| 1.3340 | 1.3650 | 1.3020 | 1.2760 |
EUR Slides As Investors Await ECB Meeting, USD/JPY Gains Momentum
EUR tumbles ahead of ECB decision
The single currency started the week on the back foot as the ECB decision looms. The euro was down roughly 0.30% against the US dollar but lost even more ground against high quality commodity currencies such as the Aussie and the Kiwi, which gained 0.30% and 0.45% respectively. For the past two weeks the single currency has been trading in a volatile range as investors awaited the European Central Bank’s penultimate meeting of the year. Although there is absolutely no doubt that the ECB will trim its monthly bond purchase, which currently stands at €60bn/month, the date of the announcement is still quite uncertain.
There is a high probability that Mario Draghi will make this announcement on Thursday as waiting longer would send a negative signal to investors. Indeed, waiting until December will suggest that the ECB is not happy with the current economic conditions in the EU. However, In order to avoid throwing the cat among the pigeons, Mario Draghi will likely adopt a very cautious tone and will also reiterates that the ECB could potentially increase again its support to the economy should the situation require. Indeed, is there is one thing that Draghi wants to avoid is to trigger further EUR appreciation as it would both damage the economic outlook but, most importantly, it will add pressure on an already anaemic inflation.
Looking at the market this morning, EUR/USD realized volatility has reached its lowest level since August 2014 which suggest that investors are too worried. However, the 1-week implied volatility has spiked to 9.36%, compared to 6% a week ago. The 1-week 25 delta risk-reversal measure rose to 0.53% indicating that investors are buying protection against an upside move in EUR/USD. On the longer-term, it is worth mentioning that the 6-month 25 delta risk reversal measure has returned in negative territory, sliding to -0.17%. This move below the neutral threshold is clear indication that investors await a reversal of EUR/USD within the next 6-month.
In addition, the appreciation of the Swiss franc against the single currency also suggests a certain tensions among investors. Although we believe that the market is almost done pricing in the upcoming QE reduction, the single has still upside potential, though limited thanks to political uncertainties.
Abe win give USD/JPY a boost
In Japan Prime Ministers Shinzo Abe ruling LDP-Komeito coalition was handed a resounding victory in the Lower House elections. Upstart opposition Party of Hope failed to converted general popularity into votes but did end up splitting the opposition vote making its easer for Abe to obtain a 2/3 majority. Despite the fact that Abenomics does have much room to debase the JPY, USDJPY rallied to 114.10 result on the removal of political uncertainty. Looking forward Prime Minister Abe will run again for the LDP leadership next year while the BoJ will be dominated by dovish members as BoJ governor and deputy governor’s selection next April will be under Abe strong control. Moving forward the fate of USDJPY depends less on BoJ policy and more the outlook for the Fed.
Growing expectations for a positive turn in US data has added to higher US interest rates. In addition, positive developments over a tax reform and continuity in naming the next Fed chairperson should keep USD firm against the JPY. Finally Japanese’s institutional investors knowing lower interest rates and YCC are unlikely to changes will further search overseas of yields. FX Asia is looking increasingly balanced with higher US yields on one side and solid global growth (expected around 3.0% 2017) and trade data on the other. We suspect that the risk is skewed towards USD upside. US data momentum is expected to reverse softness starting with 3Q GDP and PCE this week. However, given the recent strength of upside surprises in export momentum we anticipate cyclical softening which will send Asia FX lower.
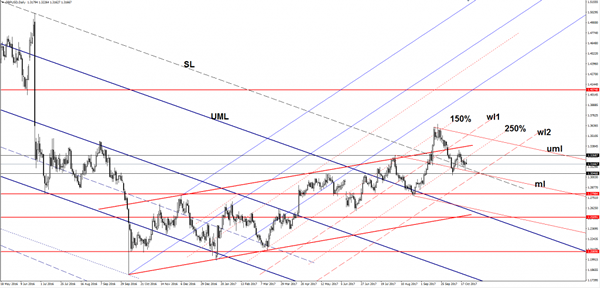
GBP/USD Rebounded
Price increased in the morning, but failed to reach and retest the 250% Fibonacci line. Technically is should drop further on the short term after the failure to stabilize above the 250% level. It could come down to retest the SL of the major descending pitchfork and could move in range on the short term before we’ll see what will happen on the USDX.
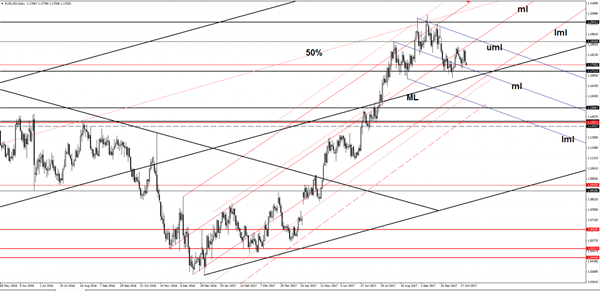
EUR/USD Undecided
EUR/USD opened with a gap down as well and looks determined to resume the bearish momentum as the USDX is trading in the green. Price is almost to reach the median line (ml) of the minor blue descending pitchfork, where could find temporary support again. Technically is somehow expected to drop much deeper after the failure to retest the median line (ml) of the ascending pitchfork, the next downside should be at the lower median line (lml) of the minor ascending pitchfork. A valid breakdown below the 1.1711 and below the median line (ML) of the major ascending pitchfork will confirm the Head and Shoulders pattern.
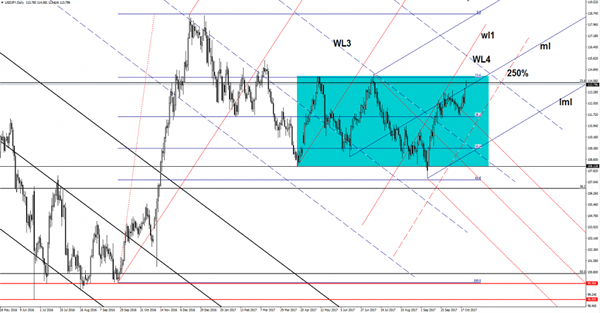
USD/JPY Above Crucial Resistance
The USD/JPY opened with a gap up and reached fresh new highs today. Was strongly bullish as the Yen was punished by the Nikkei’s impressive jump, the index opened with a gap up as well and touched new highs.
The JP225 continues the upside movement, technically should approach and reach new highs if will stay above the morning gap. A Nikkei’s minor drop will be confirmed only if the index will drop and will close today’s gap up.
Personally, I still believe that the Nikkei will decrease a little to correct after the amazing rally, the USD/JPY has already lost altitude after the morning bullish momentum. The USD was expected to increase versus its rivals as the after the last days’ very good US data, the USDX climbed above the 93.81 horizontal resistance, but remains to see if will have enough energy to make a valid breakout.
The USD/JPY edged higher and jumped above the 23.6% retracement level, but failed to stay there and now could retest the median line (ml) of the minor ascending pitchfork. A valid breakout above the median line (ml) will signal a further increase on the Daily chart . The bullish movement was expected after the failure to reach and retest the 38.2% retracement level, but only a valid breakout from the extended sideways pattern will confirm a larger increase, while a false breakout above the median line (ml) will send the rate tumbling.
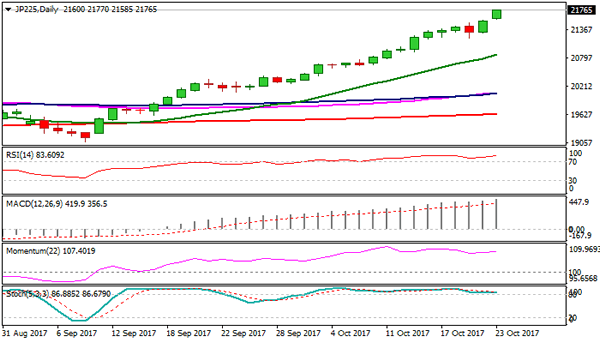
Technical Outlook: Nikkei 225 Rallied On Abe’s Election Victory, Hits New Multi-Year High
Nikkei 225 index rose to fresh multi-year high at 21770 on Monday (the highest since July 1996) in fresh bullish extension of last Friday's strong rally.
The index was boosted by election victory of Japan PM Abe's ruling coalition, signaling continuation of their policy for fiscal spending and monetary easing.
The price was up around 0.75% since opening and maintaining strong bullish momentum for further advance.
Bulls eye immediate target at 22402 (Fibo 123.6% projection of the upleg from monthly higher base at 14761 (2016 lows) and may extend to 23305 (Fibo 138.2% projection).
On the other side, strongly overbought daily studies warn of correction but so far without firmer bearish signal.
Monday's low at 21585 marks initial support, followed by Friday's low at 21300, reinforced by rising daily Tenkan-sen. Ascending thick 4-hr Ichimoku cloud (spanned between 21235 and 20985) which tracks the ascend in past two weeks, should contain corrective dips.
Res: 22000, 22286, 22402, 22760
Sup: 21680, 21585, 21300, 21235
EUR/USD Elliott Wave Analysis
EUR/USD – 1.1751
EUR/USD: Wave (c) of 2 ended at 1.3993 and wave 3 of III has commenced for weakness to 1.0411 (1.236 of wave 1), then 1.0000.
Although the single currency rebounded to 1.1858 last week, as the pair has retreated after faltering below resistance at 1.1880, suggesting further consolidation would take place, however, still reckon support at 1.1730 (last week’s low) would limit downside and bring another rebound later. Above 1.1858 would bring test of 1.1880 resistance, a daily close above there would suggest the pullback from 1.2093 has ended at 1.1669, bring further gain to 1.1950-60, then towards 1.2000-05. Only a break of resistance at 1.2034 would confirm and bring retest of 1.2093, break there would signal recent upmove from 1.0340 low has resumed for headway to 1.2150-55 (61.8% projection of 1.1119-1.1910 measuring from 1.1662), having said that, loss of upward momentum should prevent sharp move beyond 1.2200-10 and price should falter below 1.2255-60, risk from there remains for a much-needed correction to take place later.
Our preferred count on the daily chart remains that a wave (II) from 1.2329 ended at 1.5145 with A-leg ended at 1.4720, followed by wave B at 1.2457, the wave C from there was also a 3 legged move and is labeled as (a): 1.3739, (b): 1.2885, the wave iii of the 5-waver (c) from 1.2885 has ended at 1.4339 and wave iv is a triangle ended at 1.3878 and wave v formed a top at 1.5145. The decline from there is a 5-waver (C) with minor wave (i) of I of (C) ended at 1.4218 with wave (ii) ended at 1.4580, wave (iii) ended at 1.3267 and wave (iv) ended at 1.3692 and wave (v) ended at 1.1876, this is also the low of wave I of (C) and wave II ended at 1.4940, hence wave III is now in progress with a diagonal wave 1 ended at 1.2042, the breach of previous support at 1.1876 (wave I trough) adds credence to our view that the wave 2 has ended at 1.3993, wave 3 has commenced for further weakness to 1.0411, then towards 1.0000.
On the downside, a drop below said support at 1.1730 would risk another fall to 1.1669 but only a sustained breach below this level would signal the leg of corrective fall from 1.2093 top is underway for retracement of early upmove to previous support at 1.1662 (previous 4th of a lesser degree), break there would extend weakness to 1.1600-10 and possibly 1.1550-60 but reckon downside would be limited to 1.1500 and support at 1.1479 should remain intact, bring rebound later.
Recommendation: Hold long entered at 1.1765 for 1.1965 with stop below 1.1665.
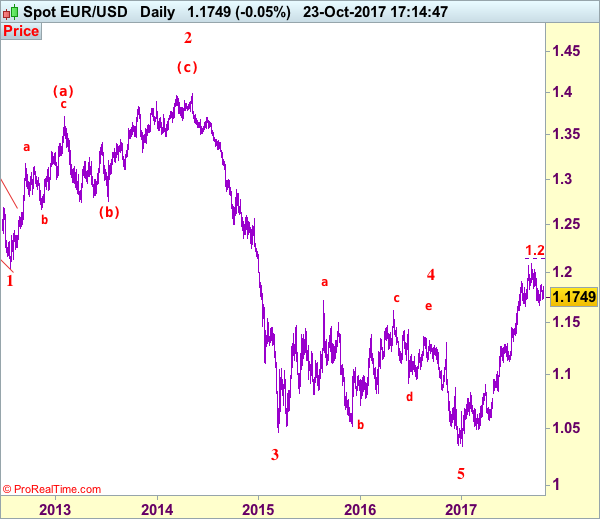
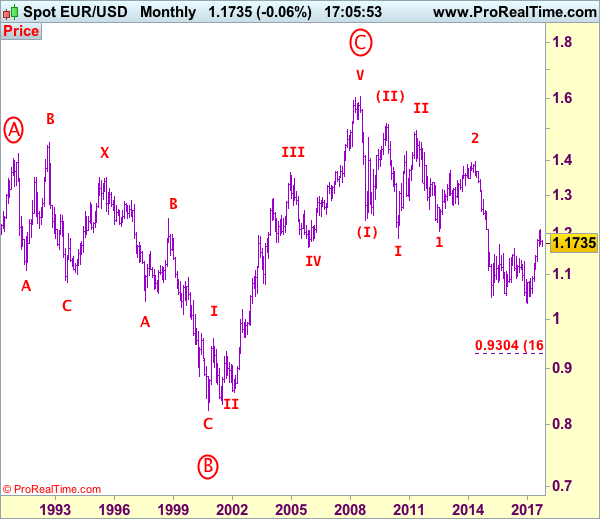
Euro's long-term uptrend started from 0.8228 (26 Oct 2000) with an impulsive structure. The rise from 0.8228 to 0.9593 (5 Jan 2001) is labeled as wave I, the retreat to 0.8352 (6 Jul 2001) is wave II and the rally to 1.3670 (31 Dec 2004) is wave III. Wave IV from there ended at 1.1640 (15 Nov 2005), the subsequent upmove to 1.6040 (July 15, 2008) is treated as wave V, the major selloff from the record high of 1.6040 to 1.2329 (October 27, 2008) signals a reversal has taken place with (I) leg ended at 1.2329 and once (II) ended at 1.5145, wave (III) itself is an extended move with I: 1.1876 and complex wave II ended at 1.4902, wave III has commenced with wave 1 and 2 ended at 1.2042 and 1.3993 respectively, wave 3 of III is now unfolding for weakness towards parity.
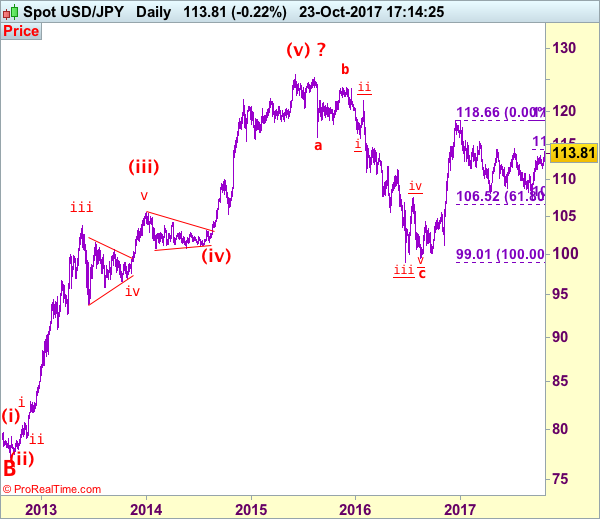
USD/JPY Elliott Wave Analysis
USD/JPY - 113.52
USD/JPY – Wave V of larger degree circle V has possibly ended at 75.31 and major correction has commenced and already met indicated target at 125.00.
The greenback found renewed buying interest at 111.65 early last week and has rallied, adding credence to our bullishness that the rise from 107.32 is still in progress and upside bias remains for further gain to 114.00, then 114.30-35 (61.8% Fibonacci retracement of 118.66-107.32) but a daily close above this level is needed to suggest recent fall from 118.66 has ended at 107.32, bring headway to 115.00, then test of another previous resistance at 115.51. Looking ahead, a sustained breach above this level at 115.51 would provide confirmation, then further subsequent gain to 116.00-10 and possibly 116.50-60 would follow.
Our preferred count is that, triangle wave IV (with circle) ended at 101.45 and the circle wave V brought dollar down to the record low of 75.31 in 2011 and the subsequent rebound signal major correction has commenced with A leg ended at 84.19, followed by wave B at 77.14 and impulsive wave C is now unfolding (indicated upside target at 125.00 had been met) for gain towards 127.00 level. In the event dollar drops below support at 99.01, this would confirm medium term decline from 125.86 top (2015 high) has resumed for subsequent weakness to 98.00 and possibly 97.00.
Under this count, this wave C is unfolding as impulsive waves with (1) (2), 1 2 ended at 80.67, 79.07, 82.84 and 81.69 respectively, hence the extended wave 3 has ended at 103.74 and wave 4 correction of recent upmove should bring weakness to 92.57, then towards 90.88 but psychological support at 90.00 should limit downside and bring another rally later in wave 5, indicated target at 125.00 had been met and gain to 127.00 cannot be ruled out but reckon price would falter below 130.00.
On the downside, whilst pullback to 112.50-60 cannot be ruled out, reckon 112.00-05 would contain downside and bring another rise later. Only a drop below last week’s low at 111.65 would suggest a temporary top is formed instead, bring weakness to 111.00 but downside should be limited to 110.40-50 and support at 109.55 should remain intact. Only a drop below strong support at 109.55 would abort and suggest the rebound from 107.32 has ended instead, risk weakness to 109.00 and possibly 108.50-60 but price should stay well above said support at 107.32 and bring another rebound later.
Recommendation: Buy at 112.70 for 114.70 with stop below 111.70.
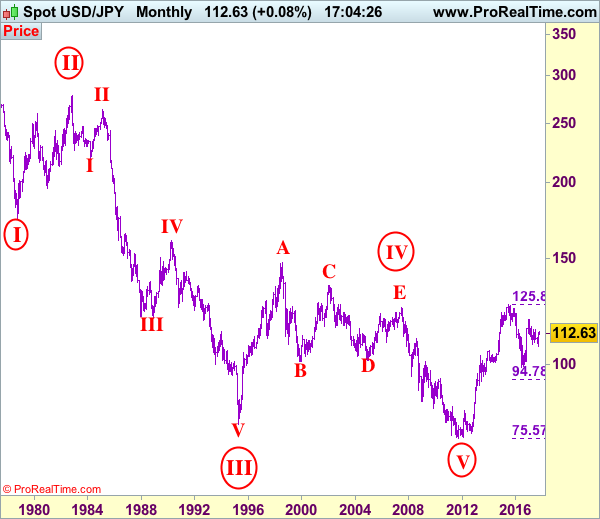
On the monthly chart, we have changed our preferred count that an impulsive wave is unfolding with major wave III with circle ended at 79.75, then followed by wave IV with circle and is labeled as a triangle with A: 147.64 (11 August, 1998), B: 101.25, C: 135.20, D: 101.67 and E leg ended at 124.14 to end the wave IV with circle. Hence, wave V with circle commenced from there and hit a record low of 75.31, however, the subsequent strong rebound signals this circle wave V has possibly ended there, hence gain to (indicated upside target at 122.00 and 125.00 had been met), the retreat from 125.86 suggests wave A of major correction has ended there and wave B correction back to 99.00, then 95.00 would be seen, however, reckon downside would be limited to 90.00, bring another rebound in wave C next year.
Economic Data From China Broadly In Line With Expectations
It was a rather busy week for China as the currency battled to remain in the headlines amid political developments from New Zealand and Spain. Looking at an economical data heavy week, China report on its inflation and GDP figures against the backdrop of the twice a decade Communist party congress meet.
Although not all eyes were on China, investors were no doubt paying attention.
China CPI slows in September but PPI beats estimates
China's inflation data was the first report to be released alongside the producer price index data. According to official data, consumer prices were seen rising 1.6% on the year in September, matching forecasts.
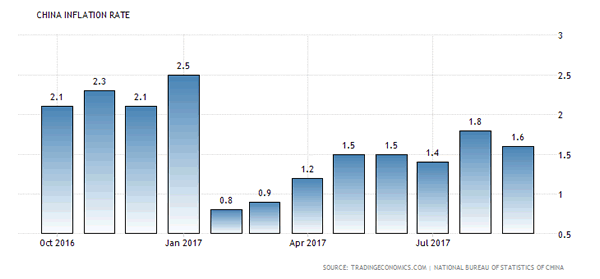
China Inflation Rate, September: 1.6%
Producer prices index rose 6.9%, beating estimates of a 6.3% increase on the year, according to data from China's National Bureau of Statistics (NBS).
Inflation was forecast to rise 1.6% according to the economists' poll. Consumer prices rose 1.6% as expected in September. But this was slower than the 1.8% increase that was registered in August.
In contract, PPI was forecast to rise just 6.3% with actual data crushing the estimates by a strong margin. The higher than expected price increase at factory gate showed that economic activity among China's trade partners continued to grow; especially demand for raw materials.
The PPI data suggested that imported inflation is likely to rub off on the consumer side as well.
China GDP growth in line with estimates
Later in the week, on Wednesday, the NBS released the monthly GDP report. Official figures put China's third quarter GDP at 6.8%. This was slightly slower than the 6.9% GDP expansion seen in the previous quarter.
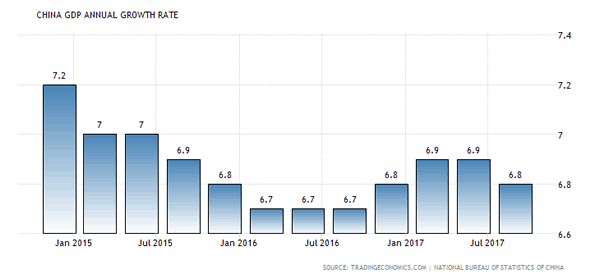
China Annual GDP Growth Rate: 6.8% (Q3 2017).
The NBS said that growth was steady and positive economic developments were seen in the first three quarters. The current global economic recovery was also said to have contributed to the economic expansion.
The GDP figures came about as earlier in the week, the People's Bank of China (PBoC) governor, Zhou Xiaochuan was quoted by the wires saying that the economy could post a 7% growth in the second half of the year. Zhou also said that he might retire after being at the helm of the PBoC for nearly fifteen years, although he refused to give out more details.
Overall, China grew at a pace of 6.9% in the first six months of the year. The PBoC governor's projections were seen to be slightly hawkish compared to the projections given by the government earlier this year. On a quarterly basis, the third quarter GDP was seen rising 1.7% from the second quarter with revisions made to the previous quarterly GDP data.
Consumption, including government spending, was said to have contributed nearly 64% to the GDP activity from January through September months.
Retail sales were also stronger, rising 10.3% in September compared to a year ago.
The PBoC governor was also quoted by the media stating that he would work towards making the yuan a more freely convertible currency. However, the yuan is expected to maintain its trading band.
The broadly positive economic data was welcome news as the party congress event was underway. The GDP numbers especially beneficial for President Xi as he said that China was moving from a rapid growth model to being focused more on development.
Xi said that his country would continue to welcome foreign businesses and defend against any systemic risks and continue to strengthen the financial sector. The strong economic performance so far is expected to validate Xi’s view on the economy and is likely to provide theimpetus for the President to push forth with further economic reforms.
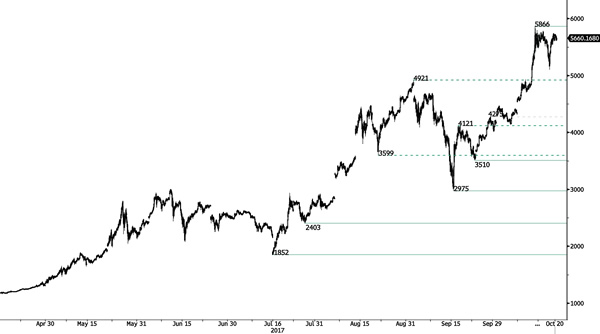
BITCOIN Consolidating Near Highs
Bitcoin has bounced strongly suggesting a near term test of 5866 (all-time high). Strong support stands very far at 2975 (22/08/2017 low). Bitcoin si ready to set up new all-time high. The road is wide open for further increase. In the short-term, the digital currency should monitor $6000.
In the long-term, the digital currency has had an exponential growth. There are decent likelihood that the asset will reach $10'000.