Sample Category Title
Market Update – European Session: Quiet Start To Trading Week, Focus On ECB QE Taper
Notes/Observations
ECB poised to indicate its QE policy later this week
Abenonics continues with decisive victory for PM Abe in Japan
Overnight
Asia:
Japan PM Abe’s ruling LDP/Komeito coalition won a supermajority in elections with 312 seats* or ~67.1% compared to 290 under prior Parliament (as speculated)
Europe:
Spain PM Rajoy invoked Article 155 of the Constitution: plans to dissolve the Catalonia govt and curb its powers, and call elections within 6 months. Powers of Catalan administration to be transferred to the central govt
Catalan Leader Puigdemont: People of Catalonia cannot accept measures decided by Spanish Govt; Spanish govt steps on Catalonia worst attacks since Franco dictatorship; requests Catalan parliament meet to debate Spain govt measures
Catalan parliament speaker Forcadell: Measures taken by Spanish govt are a "coup"; committed to defending the sovereignty of the Catalan parliament
Northern regions of Veneto and Lombardy claimed victory in autonomy referendums that seek to grab additional powers and tax revenue from Rome. leaders of the neighboring regions hope to leverage strong turnout in talks with Italy's center-left government
Czech Election Results: Centrist and populist ANO party wins ~30% (78 of 200 Seats in Chamber of Deputies) Billionaire Babis expected to become PM
Fitch affirmed Italy sovereign rating at BBB; outlook Stable
S&P affirmed Norway sovereign rating at AAA; outlook Stable
Fitch raised Cyprus sovereign rating one notch to BB from BB-; outlook Positive
Americas:
Fed Chair Yellen: must keep our unconventional policy tools ready to be deployed due to "uncomfortably high" risk of short term rates dropping to lower bound again in the future
President Trump: Confident about tax reform plan, should be approved by the end of the year or maybe "much sooner than that"
President Trump: Both Fed chair possibilities John Taylor and Jerome Powell are very talented; likes Janet Yellen 'a lot'; will make decision on Fed chair shortly
Economic Data
(CH) Swiss Sept M3 Money Supply Y/Y: 4.4 v 4.1% prior
(DK) Denmark Oct Consumer Confidence: 7.1 v 7.5e
(TR) Turkey Oct Consumer Confidence: 67.3 v 67.7e
(TW) Taiwan Sept Industrial Production Y/Y: 5.2% v 5.4%e
(TW) Taiwan Sept Unemployment Rate: 3.7% v 3.8%e
(HK) Hong Kong Sept CPI Composite Y/Y: 1.4% v 2.0%e
Fixed Income Issuance:
None seen
SPEAKERS/FIXED INCOME/FX/COMMODITIES/ERRATUM
Equities
Indices [Stoxx600 +0.2% at 390.9, FTSE +0.1% at 7532, DAX +0.3% at 13035, CAC-40 +0.3% at 5389, IBEX-35 -0.4% at 10184, FTSE MIB flat at 22353, SMI +0.2% at 9255, S&P 500 Futures flat]
Market Focal Points/Key Themes:
European Indices trade mostly higher across the board with the exception of the Spanish Ibex which trades lower on continuing worries over Catalonia as Spanish Banks weigh on the Index.
In the UK Dialight and Pendragon trade sharply lower after profit warnings, while in the Netherlands Philips trade higher after Q3 results. In the healthcare space DBV Tech trades lower by over 40% after its Phase III trial failed to meet primary endpoint.
Looking ahead to the US morning notable earners include T-Mobile, Halliburton and Kimberly Clark, in whats expected to be a busy week for earnings.
Equities
Consumer discretionary [ Air France [AF.FR] +1% (New pension scheme agreements reached by KLM with its pilot and cabin staff unions), Pendragon [PDG.UK] -17% (Cuts outlook)]
Industrials: [GKN [GKN.UK] +3% (Considering splitting aerospace and automotive businesses), Dialight [DIA.UK] -15.6% (Profit warnings)]
Healthcare:[Cosmo Pharma [COPN.CH] +1% (FDA approves QIDP and Fast Track designations forAemcolo), Philips [PHIA.NL] -0.4% (Earnings), DBV Tech [DBV.FR] -44% (Topline results of Phase III clinical trial in Peanut-Allergies failed to meet primary endpoint), Spire Healthcare [SPI.UK] +13% (Takeover approach by Mediclinic)]
Speakers
Spain Dep PM Saenz; Catalan govt will not disappear; May choose a single representative to govern the region temporarily. To apply Article 155 in a gradual manner and noted that the Catalan leader would lose all powers once Senate approved direct intervention
Bank of Korea (BOK) Gov Lee: 2018 GDP growth forecast of 2.9% excludes any potential rate hike
Japan PM Abe: Signed coalition agreement with Komeito. Would implement policies as promised during campaign and think about new Cabinet. To reach cross-party consensus on constitution
Currencies
USD was slightly firmer against the major pairs as the week began.
EUR/USD was trading in the mid-1.17 area ahead of Thursday’s ECB meeting where the central bank is expected to take action in tapering its bond buying program.
USD/JPY pair hit a 3-month high just above the 114 level following PM Abe super-majority win in the lower house over the weekend. The political victory removed uncertainty for the course of Abenomics. Dealers noted that the dovish policy from the BOJ seen continuing even in the context of BOJ Gov Kuroda's term coming to an end in April of next year
Fixed Income
Bund futures trade at 161.63 up 12 ticks as German government bonds looks more balanced going into the European Central Bank meeting Thursday. Support lies at 161.24, followed by 160.38. Resistance stands initially at 162.75, followed by 163.51.
Gilt futures trade at 124.30 down 7 ticks and below a strong horizontal resistance at 124.75 and remains under pressure. Continued downside eyeing 123.26. Upside targets 124.90 then 125.24.
Monday’s liquidity report showed Friday’s excess liquidity fell to €1.791T from €1.792T and use of the marginal lending facility dropped to €315M from €338M.
Corporate issuance saw primary market finish week with over $20B priced
Looking Ahead
(UR) Ukraine Sept Industrial Production M/M: No est v 3.0% prior; Y/Y: 0.6%e v 1.2% prior
(BR) Brazil Oct CNI Industrial Confidence: No est v 55.7 prior
(BR) Brazil Sept Total Federal Debt (BRL): No est v 3.404T prior
05:30 (BE) Belgium Debt Agency (BDA) to sell €2.3-2.8B in 2023, 2026 and 2043 OLO bonds
06:00 (UK) Oct Industrial Trends Total Orders: 9e v 7 prior, Selling Prices: No est v 18 prior, Business Optimism: No est v 5 prior
06:00 (TR) Turkey to sell 2018, 2022 and 2027 bonds (3 tranches)
06:00 (IL) Israel to sell 2022, 2026, 2027 and 2047 bonds
06:00 (DE) German Bundesbank Monthly Report
06:25 (BR) Brazil Central Bank Weekly Economists Survey
06:45 (US) Daily Libor fixing
07:00 (IN) India announces details of upcoming bond sale (held on Fridays)
08:00 (PL) Poland Sept M3 Money Supply M/M: 0.6%e v 0.4% prior; Y/Y: 5.6%e v 5.5% prior
08:05 (UK) Baltic Dry Bulk Index
08:30 (US) Sept Chicago Fed National Activity Index: -0.10e v -0.31 prior
08:30 (CA) Canada Aug Wholesale Trade Sales M/M: 0.5%e v 1.5% prior
08:50 (FR) France Debt Agency (AFT) to sell combined €4.3-5.5B in 3-month, 6-month and 12-month Bills
09:30 (EU) ECB announces Covered-Bond Purchases
09:35 (EU) ECB calls for bids in 7-Day Main Refinancing Tender
10:00 (EU) Euro Zone Oct Advance Consumer Confidence: -1.1e v -1.2 prior
11:30 (US) Treasuries to sell 3-Month and 6-Month
(IT) Italy Debt Agency (Tesoro) announcement for upcoming CTZ and BTPei auction for Thurs., Oct 26th
13:30 (EU) ECB’s Nouy (SSM chief) in London
15:00 (CO) Colombia Aug Economic Activity Index (Monthly GDP) Y/Y: 1.4%e v 3.0% prior
16:00 (US) Weekly Crop Progress Report
Focus On Earnings As Fed Enters Blackout Period
- EUR lower ahead of Thursday's ECB QE announcement;
- IBEX stumbles again as Madrid prepares to impose direct rule on Catalonia;
- Yen slips as Abe secures super majority.
US futures are relatively flat ahead of the open on Monday, but sentiment remains very positive as we head into a key week for corporate earnings.
With 185 S&P 500 companies due to report on the third quarter this week, earnings will naturally be a key factor when it comes to the sustainability of the stock market rally. Global risk appetite remains strong though and investors are becoming increasingly optimistic about the economic outlook. Add tailwinds such as US tax reform into the mix and despite lingering geopolitical and political risks, the rally may have some way to go yet.
While the week is looking busy from an earnings perspective for the US, it's looking a little light when it comes to economic data. Durable goods orders and third quarter GDP represents the most notable of the data releases this week while the Federal Reserve blackout period came into effect this weekend ahead of next week's meeting, meaning all will go quiet on that front.
The ECB will be the headline act this week, with the central bank apparently preparing to announce details of its bond buying extension on Thursday. While the extension itself will come as no surprise, the size and duration of the extension will be of keen interest. With the extension largely priced in at this stage, it will be interesting to see whether we see much more upside in the euro which has already reached levels the ECB clearly deems to be uncomfortable in recent months.
The IBEX is underperforming its European peers once again on Monday as Madrid moves closer to imposing direct rule on Catalonia and leaders in the region discuss their next steps, having rejected the motion. The prolonged stand-off creates more uncertainty for businesses in the region, many of which have proposed moving headquarters out of Catalonia. Given the steps being taken by Madrid, it's difficult to see a situation that doesn't involve more unrest and altercations, at the very least.
The Japanese election over the weekend which saw Shinzo Abe's Liberal Democratic Party retain its two thirds super majority in the lower houses of parliament, has weighed on the yen and lifted the Nikkei 225 to its highest since 1996. The result has effectively given Abe a fresh mandate to continue with Abenomics which means more fiscal stimulus and a prolonged period of ultra-loose monetary policy. This could continue to weigh on the yen, particularly as other central banks across the globe pursue tighter monetary policy.
DAX Starts Week With Gains, German Manufacturing PMI Ahead
The DAX had a quiet week, spending most of it close to the symbolic 13,000 level. In the Monday session, the index is at 13,051.00, up 0.46% since the Friday close. On the release front, the sole economic indicator is Eurozone Consumer Confidence, which is expected to remain to remain at -1 point. On Tuesday, Germany and the eurozone will release Manufacturing PMIs.
What's next for Catalonia? On Saturday, the central government said it was imposing direct rule, invoking Article 155 of the Spanish Constitution. However, there is plenty of uncertainty, as this clause has never been used and it is unclear what steps Madrid will take. Spanish media is reporting that the central government will strip Catalan President Carles Puigdemont of all his powers and take over Catalonia's local police force. Unsurprisingly, the Catalan government has condemned Madrid and said it will not accept direct rule. The crisis has led to many companies in Catalonia moving their legal headquarters to Madrid, and investors are nervously watching as developments unfold in Spain, which is the eurozone's fourth largest economy. The Spanish stock market has started the week with losses, but this has not weighed on other European stock markets.
German politicians are busy conducting coalition negotiations, which could continue until the end of the year. The current talk are especially complex, because Chancellor Angela Merkel will have to rely on two other parties to form a government. The FDP, a pro-business party, is expected to be in the coalition. On the weekend, the head of the party, Christian Lindner, said that the governments should close tax loopholes for large companies such as Apple. This comment raised some eyebrows among investors, as the FDP has been a strong proponent of tax cuts. Traders should keep an eye on the coalition negotiations, as the makeup of the new government could have a substantial impact on the German stock markets.
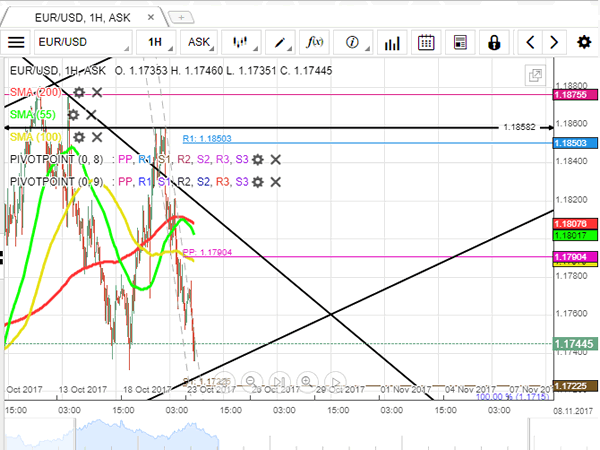
EUR/USD Analysis: Trades Near 1.1760
Due to anticipation of the ECB meeting as well as referendum on extension of autonomy in Lombardy and Veneto regions the common European currency slipped against the Dollar to the 1.7520 mark.
As the northern side is protected by a combination of the 100-hour SMA and the weekly PP plus the 55- and 200-hour SMAs, the pair is expected to continue to move to the bottom towards the bottom boundary of an alleged three-week long ascending channel that is located a little bit above the updated weekly PP at 1.1722.
The general strengthening of the Greenback is also supported by the average market sentiment, which is 59% bearish.
As there are no data releases planned for today, the pair should not make any unexpected and sharp moves.
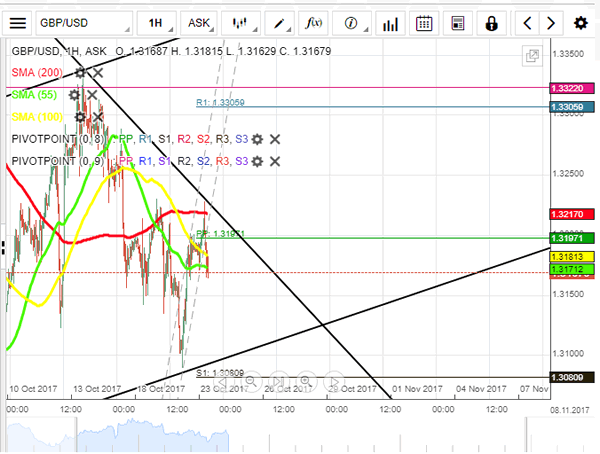
GBP/USD Analysis: Returns To 1.3200
Despite a sharp fall after release of worse than expected data about the UK retail sales, the cable managed to bounce off from the bottom trend-line of a large ascending channel and by Monday morning restore lost positions returning back to the 1.32 level.
However, the pair is not expected to climb higher this day, as the further road to the north is obstructed by a combination of the 200-hour SMA and the upper edge of a dominant descending channel, which has already managed to neutralize the surge couple of times.
But even in the case of a breakthrough in weekly perspective the Pound is likely to lose value against the Dollar because of release of information on the UK Preliminary GDP, which might appear to be below the 0.3% growth rate.
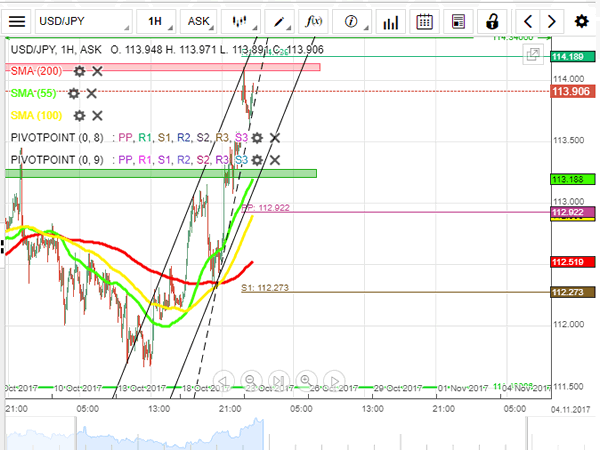
USD/JPY Analysis: Surges To 114.00 Amid Abe’s Victory
In accordance with experts' expectations, the Japanese Prime Minister Shinzo Abe and his Liberal Democratic Party secured their seats for another term.
Anticipation and confirmation of this result led to sharp appreciation of the Dollar against the Yen, allowing the pair to reach a new cellar at the 114.00 mark.
This advance signified a breakthrough through the upper resistance line of large falling wedge. This fact allows assuming that the buck is going to continue strengthening at least until the clash with the monthly R1 at 114.75.
But in shorter perspective the pair is likely to return back to the 113.35 mark and make a rebound from the bottom edge of a junior ascending channel that will be backed up by the rising 55- and 100-hour SMAs.
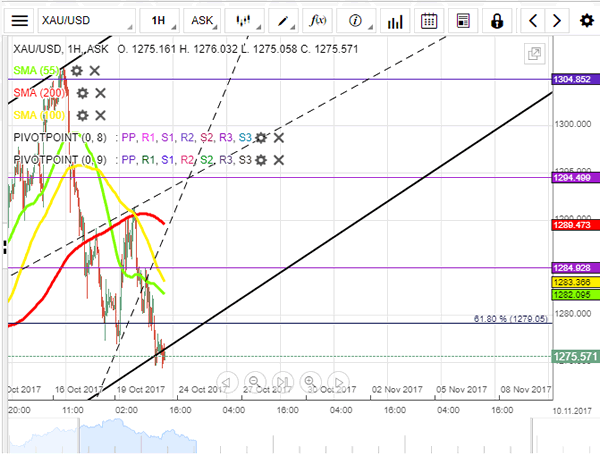
XAUUSD Analysis: Approaches 100-Day SMA
Previous trading week the exchange rate ended at the intersection of the 61.8% Fibonacci retracement level and the bottom boundary of two ascending channels and was ready to make a rebound.
However, an unconfirmed victory of the Japan's PM Shinzo Abe and his party strengthened the Dollar and pushed the through this combined support barrier.
This fact as well as Donald Trump's intention to complete tax reform, after successful vote on budget in the Senate, indicates that the pair might continue to move in the southern direction towards the weekly S1 at 1,270.00.
On the other hand, the fact that on daily chart the pair is facing the 100-day SMA suggests that the pair is likely to retreat for some while. Plus there is a need to take into account that market sentiment is 53% bullish.
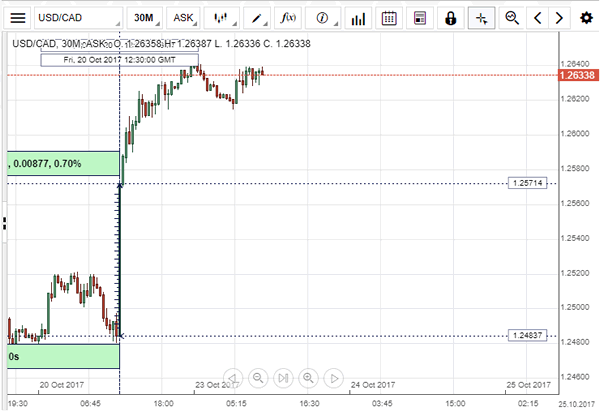
USD/CAD: Canadian Consumer Price Index
Canadian Dollar dropped markedly against the Greenback after data showed slightly weaker-than-anticipated monthly gain in consumer inflation, while the yearly rate moved closer to the Bank of Canada's 2% target. The USD/CAD currency pair rose 88 base points or 0.70% to the 1.2571 mark and continued consolidation in the 1.2620 area.
Statistics Canada reported on Friday that the country's consumer inflation marked a 0.2% monthly increase in September, putting an annual growth rate to 1.6% in the reported period. These gains were mainly supported by rising gasoline prices, as well as higher shelter and food costs. The BoC is expected to meet this Wednesday to discuss if further monetary tightening is appropriate at this time.
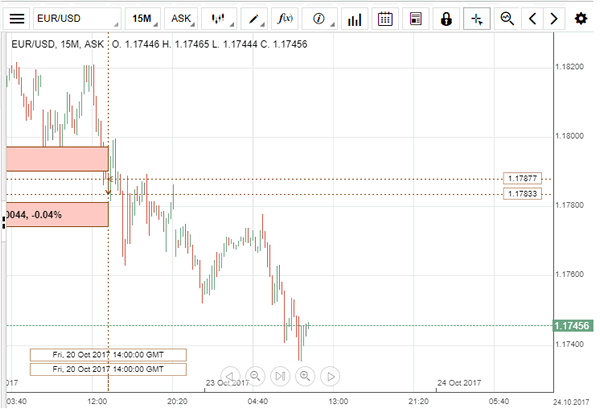
EUR/USD: US Existing Home Sales
The EUR/USD currency pair revealed a modest reaction on the US economic reports showing some positive changes in the US existing home sales. The Euro lost against the US Dollar just 4 base points to continue slipping further into the 1.1770 area.
The National Association of Realtors reported on Friday that the US existing home sales gained 0.7% to a seasonally adjusted yearly rate of 5.39M in September. The increase was sustained by dissipation of the effects of Hurricanes Harvey and Irma, though an enduring dearth of available properties kept weighing on overall activity. Moreover, weak affordability is likely to keep prices high confusing considerable buyers' interest throughout the US.
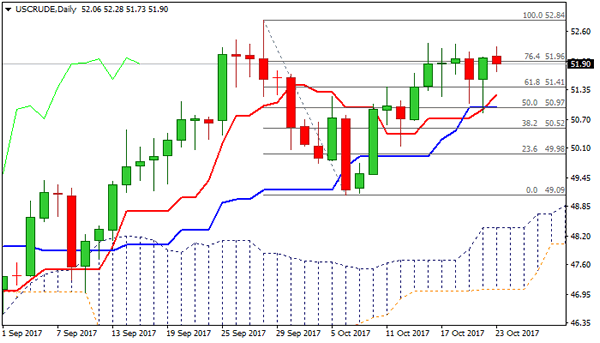
Technical Outlook: WTI OIL Struggles To Break Above $52.00
WTI Oil continues to struggle at $52.00 barrier on Monday, following several unsuccessful attempts last week after upticks hit highs at $52.35 but failed to clearly break higher.
Two strong downside rejections on Thu/Fri signaled strong bullish bias but did not manage to generate stronger momentum for final break higher and test of target at $52.84 (28 Sep high).
Overall structure remains bullish with signs of US oil market tightening and rising demand in Asia being supportive for further advance.
Formation of daily Tenkan-sen / Kijun-sen bull cross underpins, but the price may stay in extended consolidation, as negative signal has been generated on reversal of slow stochastic from overbought territory on daily chart, with south-heading indicator showing plenty of room at the downside.
Extended downticks face solid supports from rising 10SMA ($51.54) and Tenkan-sen ($51.25) which are expected to contain and keep the downside protected.
Res: 51.96, 52.35, 52.84, 53.00
Sup: 51.73, 51.54, 51.25, 50.97