Sample Category Title
Light Release Schedule On Monday
Investors can expect a very light release schedule on Monday, giving them more time to assess the outcome of Japan's election result. There's actually nothing much to assess as Shinzo Abe won in an absolute landslide.
The European calendar sees its first release at 08:00 GMT when the Greek government reports on the current account balance for the month of August.
About two hours later, the Confederation of British Industry (CBI) will release its latest industrial trends survey for the month of October. The release is expected to show a reading of 13, which is a near doubling of last month's 7.
In North America, the Chicago Federal Reserve Bank will release the National Activity Index at 12:30 GMT.
North of the border, the Canadian government will report on wholesale sales at 12:30.
A short while later, the European Commission will deliver its preliminary consumer confidence index for the month of October.
Prime Minister Shinzo Abe's ruling coalition scored a big victory in Sunday's election, boosting his chance of becoming Japan's longest-serving premier. Abe's Liberal Democratic-led coalition secured a combined 31.2% seats, maintaining its two-thirds “super majority” in the lower house.
Abe first took office in 2012 and pursued an aggressive growth policy predicated on fiscal stimulus, monetary easing and structural reforms. After struggling for many years under Abe, the Japanese economy appears to have turned a corner in 2017. Gross domestic product (GDP) has now expanded in six consecutive quarters, the longest streak of uninterrupted growth in over a decade.
The calendar heats up later this week with policy decisions from the Bank of Canada and European Central Bank, not to mention a slew of economic data.
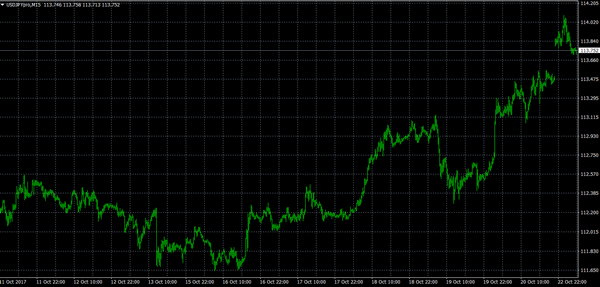
USD/JPY
The Japanese yen declined sharply on Monday following Abe's victory, with the USD/JPY exchange rate touching a session high of 114.10. That's the highest level in over three months. The pair was last up 0.2% at 113.74. Immediate resistance is located at the psychological 114.00 handle. A clean break above this level would expose 114.50 as the next target. On the opposite side of the ledger, immediate support is located at 113.10.
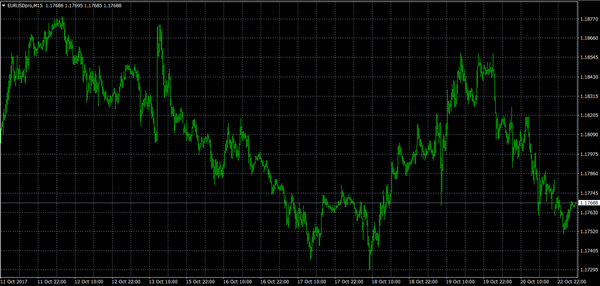
EUR/USD
The EUR/USD edged lower on Monday, as the greenback strengthened against a basket of world currencies. The pair reached a session low of 1.1750 before rebounding back toward the 1.175 region. Current support levels include 1.1760 and 1.1720. On the flip side, immediate resistance is located at 1.1835, followed by 1.1865.
USD/CAD
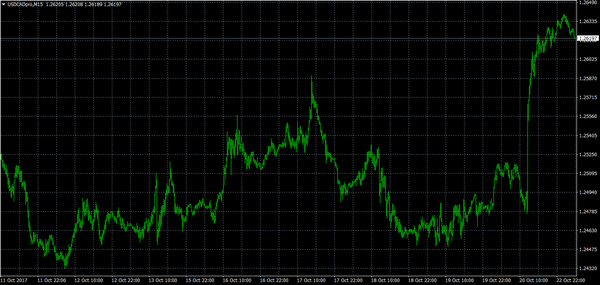
The Canadian dollar is coming off one of its worst sessions in recent memory after retail sales and inflation data missed the mark. The USD/CAD soared to its highest level since August. The pair was last seen trading at 1.2621, little changed from the previous close.
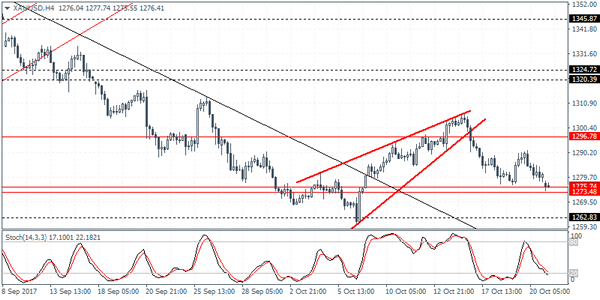
XAUUSD Intraday Analysis
XAUUSD (1276.41): Gold prices touched down the support level at 1275 - 1274 level and this marks the downside correction in price following the rising wedge pattern. We can expect some consolidation near the support level with the potential for a short-term bounce in prices. Still, gold prices could be seen maintaining the sideways range within 1296 and 1274 levels of resistance and support. A breakout from this range will signal further gains or losses in price.
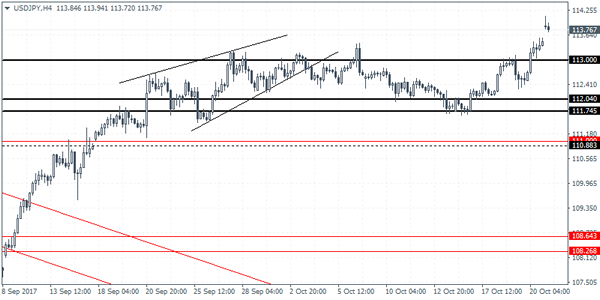
USDJPY Intraday Analysis
USDJPY (113.76): The USDJPY gapped higher on today's open and price action looks to have cleared the resistance level at 113.00. Any near-term declines could be seen holding near this resistance level which could be tested for support. With price briefly testing the 114.00 level, USDJPY could be seen consolidating above the support level of 113.00. Failure to establish support at 113.00 could signal some weakness in the currency pair that could see price once again turning flat near this level.
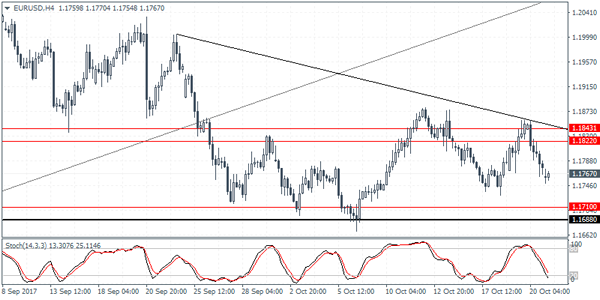
EURUSD Intraday Analysis
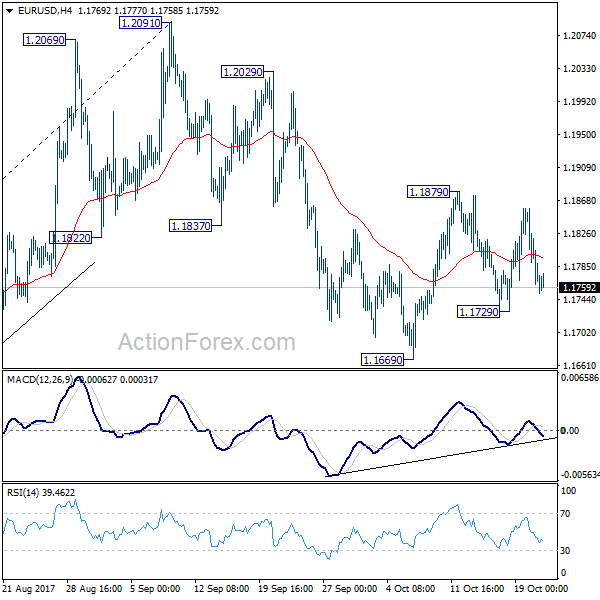
EURUSD (1.1767): The euro gapped lower this morning following Friday's bullish close. Any near term gains are likely to be limited to Friday's close following which we expect to see the common currency push towards the main support level at 1.1710 region. Price action is seen maintaining the bearish bias on the 4-hour chart with the descending triangle pattern has been developing. A breakdown below the support could signal further declines to come.
Japan PM Abe Wins Elections With A Strong Mandate
The weekend snap elections called by Prime Minister Shinzo Abe saw the voters giving Abe a strong mandate. This pushed the Japanese yen lower as the US dollar briefly touched 114.00. Abe called the snap elections in a bid to consolidate power amid threats from North Korea.
In Spain, the government was seen moving ahead with its bid to dissolve the Catalonian parliament. A parliamentary vote is pending on Tuesday. The move saw the Catalonian parliament rejecting the government's move. The euro was seen opening weaker on the day.
Looking ahead, the economic calendar today will see the flash manufacturing and services PMI from the Eurozone and the US No major events are lined up today ahead of this week's BoC and the ECB meetings. The US dollar continues to briefly trade higher amid hopes of tax cuts from the Trump administration.
Forex: Abenomics Continue Into 2021?
Japanese Prime Minister Shinzo Abe's party has won a resounding, albeit not surprising, victory in Japan's election on Sunday. The victory will maintain Japan's ultra-easy monetary policy for the foreseeable future. The markets had been concerned that Abe's economic policy would have been disrupted if his party did not maintain their 'super majority' two-thirds win in Japans 465-member lower house. It is now apparent that, with an uninterrupted economic policy, the Bank of Japan will continue its 'Abenomics' policy of mega-stimulus. The markets initially reacted with Japanese equities climbing higher, whilst JPY declined. However, as we enter the European trading session, the markets are behaving with a 'business as usual approach' which has resulted in the Japan225 and USDJPY both retracing from earlier highs.
The EUR weakened over the weekend, as Spain's Senate is expected to approve Prime Minister Rajoy's call to impose direct rule on Catalonia. Catalan leader Puigdemont commented on Saturday that the anticipated move by Madrid as being the 'the most serious attack on Catalonia's foundations and principals since the dictatorship of Franco'. He also stated on Spanish TV that he would consult with the regional parliament on how to react to 'these attacks on democracy'. The markets are concerned as to the economic fallout that may occur as Catalan contributes over 20% to Spain's economy and how this will affect the greater Eurozone.
The Czech Republic has 'voted in' their own version of Trump with the weekend victory of Czech Business mogul Andrej Babis in the country's general election. Mr. Babis, a populist business billionaire, was voted in as Czech Prime Minister on a manifesto focusing on cutting taxes, increasing public investment and reducing immigration (sound familiar?). Babis is the latest 'nationalist' to secure a victory in Europe which could bring into question the strength, and unity, of Eurozone members.
EURUSD is little changed from Friday. Currently, EURUSD is trading around 1.1772.
USDJPY is 0.15% lower in early Monday trading. Currently, USDJPY is trading around 113.70.
GBPUSD is 0.1% higher in early session trading. Currently, GBPUSD is trading around 1.3200.
Gold is 0.2% lower in early trading. Currently, Gold is trading around $1,277.
WTI is little changed from Friday's close. WTI is currently trading around 52.12.
Major data releases for today:
At 09:00 BST, Markit Economics will release Eurozone Manufacturing, Services & Composite PMI for October. Manufacturing is expected to come in at 57.8 from the previous 58.1, Services at 55.9 from 55.8 and Composite at 56.6 from 56.7.
At 14:45 BST, Markit Economics will release US Manufacturing, Services & Composite PMI for October. Manufacturing is expected to come in at 53.5 from the previous 53.1 & Services at 55.5 from 55.3.
Can Euro Hold This Vs US Dollar?
Key Highlights
- The Euro failed near the 1.1860 level this past week against the US Dollar and moved down.
- There are two bearish trend lines formed with resistance near 1.1850 on the 4-hours chart of EUR/USD.
- The US Existing Home Sales released this past Friday posted a rise of 0.7% in Sep 2017 (MoM).
- Today, the Euro Zone’s Consumer Confidence for Oct 2017 (Prelim) will be released, which is forecasted to increase from -1.2 to -1.0.
EURUSD Technical Analysis
The Euro after a decent uptrend from the 1.1740 swing low found sellers near 1.1860 against the US Dollar. The EUR/USD pair is currently under pressure, but trading above a crucial support at 1.1750.
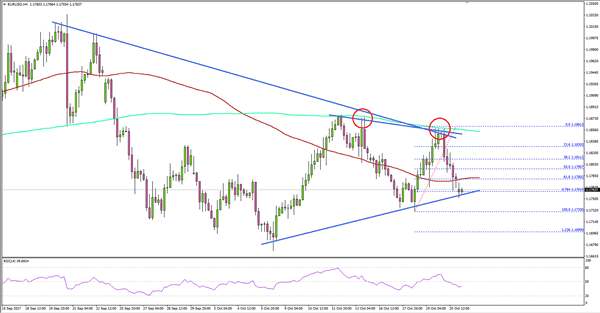
The recent failure was from two bearish trend lines with resistance near 1.1850 on the 4-hours chart. Moreover, the 200 simple moving average (green, 4-hour), currently at 1.1855 also prevented gains this past week in EUR/USD.
The pair has already breached the 61.8% Fib retracement level of the last wave from the 1.1730 low to 1.1861 high. Therefore, there are chances of more declines below 1.1760 in the short term.
On the downside, there is a connecting bullish trend line forming with support at 1.1750. A break and close below 1.1750 would call for a move towards 1.1730. Below 1.1730, the pair could even test the 1.236 extension of the last wave from the 1.1730 low to 1.1861 high at 1.1699.
US Existing Home Sales
This past Friday, the Existing Home Sales report for Sep 2017 was released by the National Association of Realtors. The forecast was slated for a decline of 1% in sales compared with the previous month.
The actual result was way above the forecast, as there was a rise of 0.7% in sales to a seasonally adjusted annual rate of 5.39 million. Considering the yearly change, there was a decline of 1.5% in Sep 2017.

Commenting on the report, the NAR chief economist, Lawrence Yun, stated:
Home sales in recent months remain at their lowest level of the year and are unable to break through, despite considerable buyer interest in most parts of the country. Sales activity likely would have been somewhat stronger if not for the fact that parts of Texas and South Florida – hit by Hurricanes Harvey and Irma – saw temporary, but notable declines.
Overall, the EUR/USD pair might continue to struggle above 1.1800. On the flip side, the 1.1750 support area is a break point for the Euro buyers in the near term.
Currencies: Dollar Extends Cautious Rebound
Sunrise Market Commentary
- Rates: US 10-yr yield tests 2.4%, countdown to ECB meeting
The US 5-yr yield closed above the psychological 2%-mark while the US 10-yr yield tested 2.4% resistance after a first breakthrough in the US tax reform process. We expect trading to slow down this week ahead of Thursday's ECB meeting. Investors might be too complacent about a 9-month APP extension, ignoring the possibility of a shorter APP lifetime. - Currencies: Dollar extends cautious rebound
The dollar was better bid at the end of last week. This morning, there are tentative signs that this trend might continue. However, the gain of USD/JPY (decline of the yen) after Abe's victory remains modest. At the same time, euro losses are limited despite Spanish uncertainty. In a broader perspective, the US currency is still captured in directionless trading
The Sunrise Headlines
- US equities closed the week on Friday with solid gains and new all-time highs as hopes on a tax cut improved after passage of the 2018 budget deal. Asian stock markets book small gains with Japan outperforming after the election outcome.
- The Spanish government will take over the regional Catalan government, once the Senate votes on art. 155 (Friday?). The Catalan government is considering an declaration of independence within days. The stand-off continues.
- The ANO party (29.6%) won the Czech elections before the Civic Democrats (11.3%) ANO party leader Babis is accused for fraud and will face difficulties to form a government. The impact on Czech markets should be modest.
- Two wealthy regions of northern Italy voted overwhelmingly for greater autonomy in referendums that could fan regional tensions in Europe at a time when Spain is striving to prevent Catalonia from breaking away.
- Japanese PM Abe's ruling coalition secured a two-thirds parliamentary “super majority” that gave him a fresh mandate for “Abenomics” and the chance to pursue his personal priority of revising Japan's post-war constitution.
- Fitch affirmed Italy's BBB rating stable outlook, and raised Cyprus BB- rating to BB with a pos. outlook. Moody's surprisingly didn't update the Hungarian Ba1, stable outlook, rating, contrary to expectations of an upgrade of the outlook.
- The market calendar is thin today. Key eco data are limited to the EMU consumer confidence and the UK CBI trends survey. Belgium holds its OLO auction.
Currencies: Dollar Extends Cautious Rebound
Dollar cautiously higher, but within current ranges
On Friday, the dollar staged a gradual rebound after a Senate budget vote that might also pave the way for a US tax reform. The dollar traded hesitant in Europe, but captured a better momentum later in US dealing. Interest rate differentials moved only marginally in favour of the dollar. Political uncertainty in Spain maybe caused some caution on the euro going into the weekend. EUR/USD closed the session at 1.1784 (from 1.1852 on Thursday). USD/JPY finished the day at 113.52, again off one figure on a daily basis.
Overnight, the trade weighted dollar gains cautiously ground. USD/JPY is taking the lead. The yen falls as the coalition of Japanese PM Abe secured a two-thirds majority in the lower house of Parliament. The Japanese economy is expected to continue receiving support from a stimulating monetary (and fiscal) policy. Japanese equities outperform with gains of abound 1.0% . Gains in the rest of the region are modest. EUR/USD hovers in the 1.1750/75 area. The single currency remains resilient giving rising political uncertainty in in Spain. The kiwi dollar extends its decline below NZD/USD as markets ponder the impact of the new government.
The economic calendar is light today. The US Chicago Fed National Activity index is no market mover. The October EMU consumer confidence is interesting. A slight further increase to a 17-year high is expected. The reaction in the currency market will only be of intraday significance at best. The focus for euro trading will gradually turn to the ECB policy meeting on Thursday and to the developments in Catalonia. On the ECB decision, consensus has been building around a 9-month APP extension while lowering monthly purchases from the start of 2018 from €60 bn to €30 bn. We agree with the reduction in purchases, but think that growth developments argue for a shorter, 6-month. Speculation on the successor of Yellen and on the chances for fiscal easing in the US remain wildcards for USD trading.
At the end of last week, the USD momentum improved slighlty as investors saw rising chances for a US tax refrom. Still, the gain of the USD currency remained modest. The price action this morning sugests a continuation of this pattern. EUR/USD trades below the 1.18 barrier, but the euro remains resilent given the political uncertainty in the region (Spain). USD/JPY jumped temporary above the 114 barrier, but for now, the rally shows no strong momentum. We start the week with a catuious EUR/USD negative bias as we see a case for some by default USD buying (tax speculation)/euro selling (Spain). However, there is no sign that the dollar (EUR/USD and even USD/JPY ) are ready for a technically singificant move.
From a technical point of view, EUR/USD dropped below the 1.1823/ 1.2070 consolidation pattern but there were no sustained follow-through gains which was disappointing for EUR/USD bears. We maintain a cautious sell-on upticks bias. The pair needs to drop below the 1.1670/62 support to give comfort to EUR/USD bears. The USD/JPY momentum was constructive in September. The pair regained 110.67/95 (previous resistance), a short-term positive. The 114.49 correction top is the next important resistance. Sentiment improved further last week, but we still assume that a break beyond 114.49 will be difficult
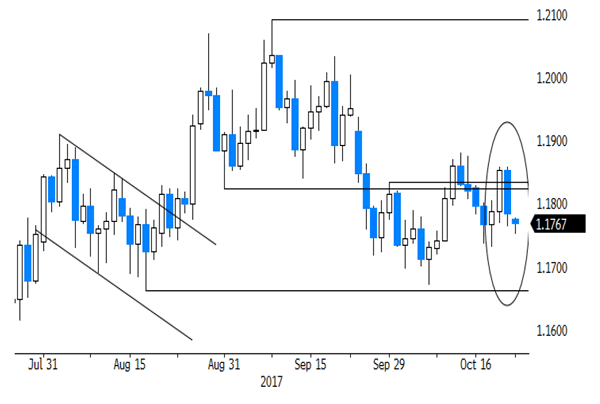
EUR/USD: euro declines, but stays within the established
EUR/GBP
GBP rebounds, but uncertainty remains omnipresent
Sentiment on the UK currency improved gradually on Friday. European investors apparently drew some comfort from reconciliatory remarks of German Chancellor Merkel on Brexit. The monthly UK public finance data were also better than expected. EUR/GBP drifted again below the 0.90 barrier. Euro softness on Spain was maybe also a slightly negative for the cross rate. EUR/GBP finished the session at 0.8931 (near the intraday low). GBP/USD finished the week at 1.3190.
Today, the CBI Business optimism and trend orders will be published. Orders are expected little changed (9 from 7). This CBI report has usually only limited impact on sterling trading. Even so, after some disappointing eco data, markets are trying to find out how much room the BoE has to hike rates. Investors will also look out whether UK PM May gets backing to make further steps that might help to unlock the stalemate in the Brexit negotiations. At least this weekend's political headlines didn't show that things are becoming easier. Sterling still trades with a slightly positive bias against the dollar and the euro this morning. We don't expect this trend to go far, unless the euro suffers from political uncertainty (Spain).
EUR/GBP staged a strong uptrend from April till late August and set a top at 0.9307. Rising UK inflation data and hawkish BoE comments reinforced a sterling rebound, but this rebound has run its course. EUR/GBP supports at 0.8743 and 0.8652 proved difficult to break. The recent rebound above 0.89 improved the ST technical picture of EUR/GBP, but for now there were no convincing followthrough gains. EUR/GBP 0.9026 is 50% retracement of the recent countermove
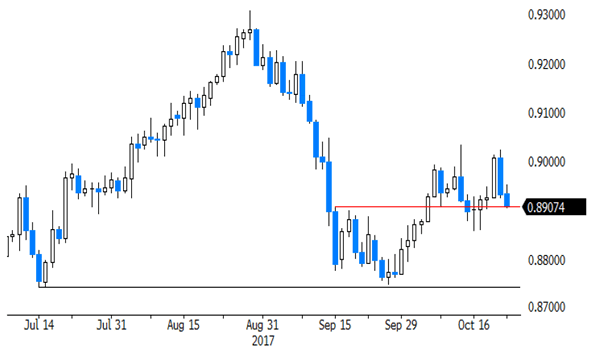
EUR/GBP: test of 0.9000 barrier rejected, for now.
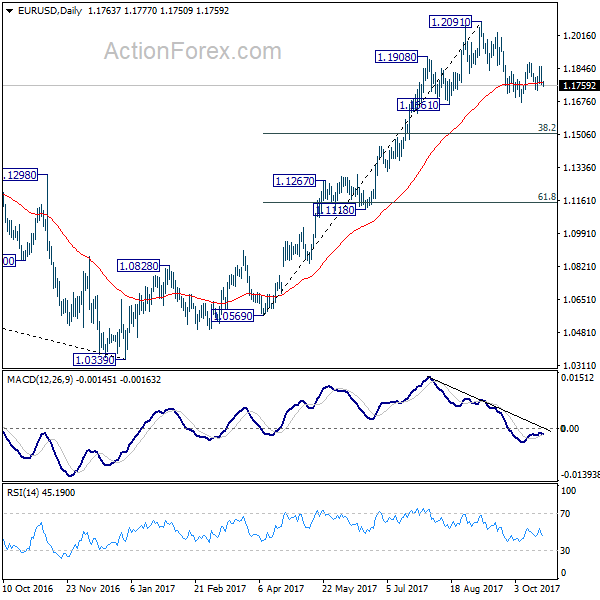
EUR/USD Daily Outlook
Daily Pivots: (S1) 1.1740; (P) 1.1799 (R1) 1.1835; More...
Intraday bias in EUR/USD remains neutral first. On the upside, break of 1.1879 will affirm the case that pull back from 1.2091 has already completed at 1.1669. In such case, intraday bias will be turned back to the upside for retesting 1.2091 high. On the downside, break of 1.1669 will resume the fall from 1.2091 to 38.2% retracement of 1.0569 to 1.2091 at 1.1510. We'd expect strong support from there to complete the correction.
In the bigger picture, rise from medium term bottom at 1.0339 is not finished yet. It's expected to continue after pull back from 1.2091 completes. And, next target will be 38.2% retracement of 1.6039 (2008 high) to 1.0339 (2017 low) at 1.2516. However, it should be noted that there is no confirmation of trend reversal yet. That is, such rebound from 1.0399 could be a correction. And the long term fall from 1.6039 (2008 high) could resume. Hence, we'd be cautious on strong resistance from 1.2516 to limit upside.
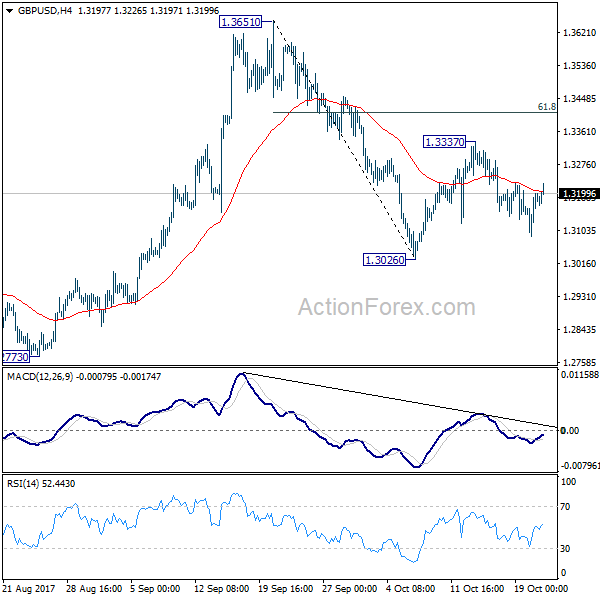
GBP/USD Daily Outlook
Daily Pivots: (S1) 1.3113; (P) 1.3157; (R1) 1.3226; More....
Intraday bias in GBP/USD remains neutral at this point. On the downside, break of 1.3026 will resume the decline from 1.3651 and target 1.2773 key support level. This will also revive the case of medium term reversal. Meanwhile, on the upside, break of 1.3337 will resume the rebound from 1.3026 to 61.8% retracement of 1.3651 to 1.3026 at 1.3412 and above.
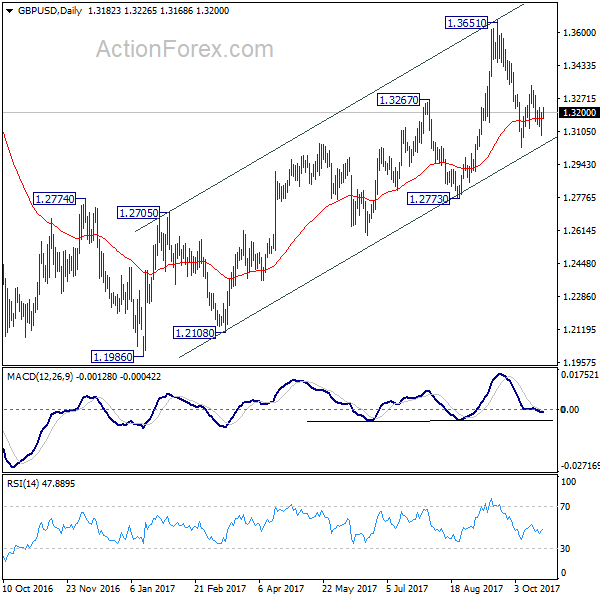
In the bigger picture, while the medium term rebound from 1.1946 was strong, GBP/USD hit strong resistance from the long term falling trend line. Outlook is turned a bit mixed and we'll stay neutral first. On the downside, decisive break of 1.2773 key support will argue that rebound from 1.1946 has completed. The corrective structure of rise from 1.1946 to 1.3651 will in turn suggest that long term down trend is now completed. Break of 1.1946 low should then be seen. On the upside, break of 1.3835 support turned resistance will revive the case of trend reversal and target 38.2% retracement of 2.1161 (2007 high) to 1.1946 (2016 low) at 1.5466.