
Sample Category Title
USD/CHF Strongly Bullish
Price rallied and resumed the upside movement as the USD was pushed higher by the USDX's rally. USD/CHF jumped much above the 0.9787 static resistance and could reach the median line (ml) of the ascending pitchfork in the upcoming days.
The rate reached the 0.9835 previous high, but failed to pass above it, I've said in the previous reports that we may have a minor consolidation above the 0.9787 level before the rate will jump much higher.
EUR/CHF Breakout In Play
The EUR/CHF increases and climbs above the upper media line (uml) of the descending pitchfork and above the fifth warning line (wl5) of the former descending pitchfork. A valid breakout will signal a further increase, the near term target will be at the 1.1621 previous high.
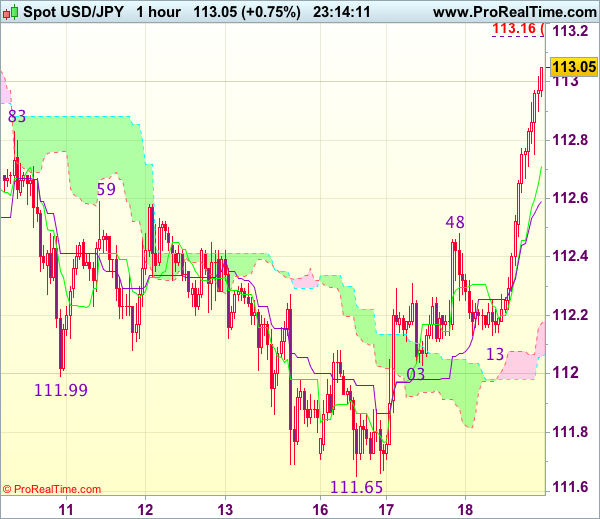
Trade Idea Wrap-up: USD/JPY – Buy at 112.50
USD/JPY - 113.00
Most recent candlesticks pattern : N/A
Trend : Near term up
Tenkan-Sen level : 112.71
Kijun-Sen level : 112.59
Ichimoku cloud top : 112.17
Ichimoku cloud bottom : 112.06
Original strategy :
Buy at 112.50, Target: 113.50, Stop: 112.15
Position : -
Target : -
Stop : -
New strategy :
Buy at 112.50, Target: 113.50, Stop: 112.15
Position : -
Target : -
Stop : -
As dollar has surged again after finding renewed buying interest at 112.13 and just broke above resistance at 112.83, adding credence to our view that low has been formed at 111.65 and consolidation with mild upside bias remains for the rise from 111.65 low to extend gain towards 113.30, however, near term overbought condition should limit upside to resistance at 113.44 and reckon 113.75-80 would hold on first testing.
In view of this, we are looking to buy dollar on pullback as previous resistance at 112.48 (now support) should contain downside and bring another rise later. Below 112.25-30 would risk test of support area at 112.03-13 but price should stay well above said low at 111.65, bring another rise later.
Pound Ticks Lower on Mixed UK Job Numbers
The British pound is showing losses for a third straight day. In Wednesday's North American session, GBP/USD is trading at 1.3174, down 0.11% on the day. On the release front, British employment numbers were mixed. Wage growth improved to 2.2%, above the forecast of 2.1%. However, unemployment claims increased by 1.7 thousand, above the estimate of 1.3 thousand. The unemployment rate remained pegged at 4.3 percent. In the US, the focus was on housing data, and the September numbers were soft. Building Permits slowed to 1.22 million, shy of the estimate of 1.25 million. Housing Starts dropped to 1.13 million, missing the forecast of 1.18 million. On Thursday, the UK releases retail sales, and the US will publish unemployment claims and the Philly Fed Manufacturing Index.
The British labor market remains tight, as underscored by an unemployment rate of just 4.3%, the lowest since 1975. However, much like the situation in the US, a strong employment picture has failed to translate into strong wage growth. This is even more perplexing in the case of the UK, where inflation is running at clip of 3 percent. When inflation is taken into account, wages actually declined 0.4% compared to a year ago. The lack of wage growth has squeezed consumers, and has complicated the Bank of England's plans to raise interest rates.
British inflation continues to accelerate, as CPI, the primary gauge of consumer spending, showed that inflation in September was 3.0% higher than a year ago. This marked the fastest rise in inflation since April 2012. The continuing rise in inflation is primarily due to the weak British pound, which has dropped 12 percent since the Brexit vote in June 2016. The CPI release likely means that the Bank of England remains on track to raise interest rates at its November policy meeting. Inflation was on the mind of lawmakers on Tuesday, who grilled BoE Governor Mark Carney when he testified before a parliamentary committee. Carney said that he expected inflation would peak in October or November, and that the bank had refrained from acting earlier to raise rates in order to lower inflation, saying that high inflation was a "trade-off" in order to protect economic growth.
Are the Brexit talks dead in the water? The two sides have little progress to show after several rounds of negotiations. Prime Minister Theresa May is keen to talk trade with the Europeans, but the latter have conditioned trade talks on progress being reached on a number of issues, such as Britain's payment when it leaves the European Union, the status of the border with Northern Ireland and the jurisdiction of the European Court of Justice on European citizens living in the UK. The two sides remain far apart on all of these issues, and each party has criticized the other for lack of flexibility. The EU holds a summit on Thursday, and could announce that they won't talk trade with Britain until 2018. The lack of progress means that the possibility of a 'hard Brexit', in which Britain would leave with no deal being reached, is growing. BoE Governor Mark Carney acknowledged on Tuesday that the Bank has made contingency plans in case there is no agreement. However, British businesses are lobbying hard for an agreement, and want a 2-year interim period, such as a temporary customs union with the EU, in order to soften the blow of leaving the EU.
Elliott Wave Analysis: EURUSD Searching For A Bounce
Good day traders! Today, let's look at EURUSD.
EURUSD made a sharp and overlapping drop in the last couple of trading sessions, which we identified it as a complex correction. We can see that price may be ending this complex seven leg correction around the 1.1739 region, from where a new intra-day rally is already seen. A five-wave recovery and a breach above the 1.1820 level would indicate a bullish reversal.
EURUSD, 1H
Canadian Manufacturing Sales Unexpectedly Bounced Back in August
Highlights:
- Manufacturing sales bounced back 1.6% in August. That was much stronger than the 0.3% decline expected by markets largely reflecting an unexpected bounce-back in motor vehicle sales after a July drop.
- The auto sale gain entirely accounted for a 1.2% increase in overall sale volumes although machinery sales also posted an encouraging gain of 4.2.
Our Take:
Canadian manufacturing sales unexpectedly jumped 1.6% in August after declining sharply in each of the two prior months. Most of the upward surprise came from a rebound in the motor vehicle component where sales rebounded 12.9% after an almost 20% drop in July. The auto component is notoriously volatile over the traditional July-August 'retooling' period in the industry but earlier reports had suggested a risk another significant sales decline in August. The auto increase accounted for almost three-quarters of the total sales gain in nominal terms and all of a 1.2% increase excluding the impact of prices. This did mask, though, some encouraging elements outside of the auto sector, perhaps most notably a 4.2% jump in machinery sale volumes that more-than-retraced a 2.0% drop in July. Industrial equipment exports declined in August, so that increase would seem to have been driven by stronger domestic Canadian business investment.
The monthly GDP calculation uses a slightly different methodology for measuring motor vehicle production, so not all of the rebound in motor vehicle sales reported today will ultimately flow through to the motor vehicle component of GDP. Nonetheless, the data is broadly consistent with our view that GDP returned to a positive growth rate in August after a pause in July that followed 8 consecutive increases.
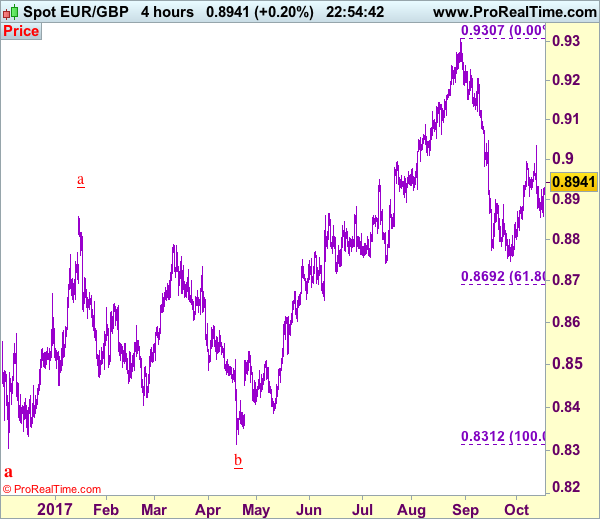
Trade Idea: EUR/GBP – Sell at 0.8975
EUR/GBP - 0.8939
Original strategy :
Sell at 0.8965, Target: 0.8825, Stop: 0.9005
Position : -
Target : -
Stop : -
New strategy :
Sell at 0.8975, Target: 0.8855, Stop: 0.9015
Position : -
Target : -
Stop : -
Although the single currency rebounded after holding above support at 0.8856 and further consolidation above this level would be seen, if our view that top has been formed at 0.9033 last week is correct, reckon upside would be limited to 0.8965-75 and bring another decline later, below said support at 0.8850-56 would add credence to this view and signal the rebound from 0.8746 low has ended, bring further fall to 0.8800-10 later.
In view of this, would be prudent to sell euro on recovery as 0.8965-75 should limit upside. Above 0.8985-90 would defer and risk a stronger rebound to 0.9000 but price should falter well below said resistance at 0.9033, bring another selloff.
Our preferred count is that, after forming a major top at 0.9805 (wave V), (A)-(B)-(C) correction is unfolding with (A) leg ended at 0.8400 (A: 0.8637, B: 0.9491 and 5-waver C ended at 0.8400. Wave (B) has ended at 0.9413 and impulsive wave (C) has either ended at 0.8067 or may extend one more fall to 0.8000 before prospect of another rally. Current breach of indicated resistance at 0.9043 confirms our view that the (C) leg has ended and bring stronger rebound towards 0.9150/54, then towards 0.9240/50.
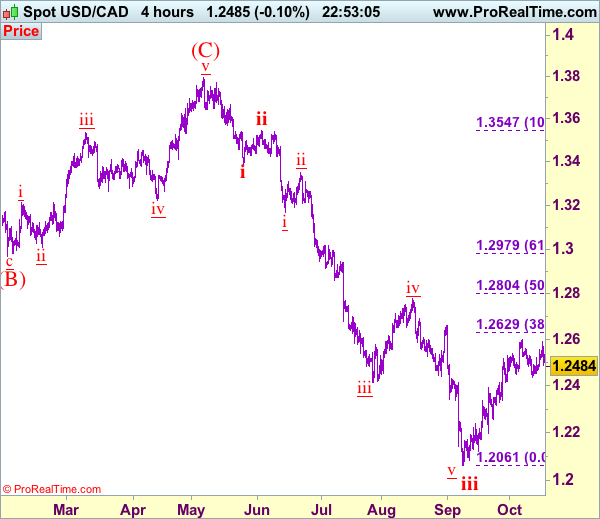
Trade Idea: USD/CAD – Exit long entered at 1.2515
USD/CAD - 1.2490
Trend: Down
Original strategy :
Bought at 1.2515, Target: 1.2675, Stop: 1.2465
Position: - Long at 1.2515
Target: - 1.2675
Stop: - 1.2465
New strategy :
Exit long entered at 1.2515
Position: - Long at 1.2515
Target: -
Stop:-
Despite rising to 1.2591, as the greenback has retreated after faltering below indicated previous resistance at 1.2599, dampening our bullishness and further consolidation below said resistance would be seen, hence downside risk remains for weakness to 1.2452 but break of support at 1.2433 is needed to signal top has been formed at 1.2599, bring further fall to 1.2400 and later towards 1.2350-55 but indicated previous support at 1.2313 would hold from here.
In view of this, would be prudent to exit long entered at 1.2515 and stand aside for now. Above 1.2530-35 would bring another bounce towards 1.2591-99 but only break there would revive bullishness and signal the rise from 1.2061 low (wave iii trough) has resumed for further gain towards previous resistance at 1.2663, however, upside should be limited to 1.2700 and price should falter well below another previous resistance at 1.2778. We are keeping our count that wave v as well as wave (C) ended at 1.3794 and impulsive wave (i ii, i ii) is now unfolding with minor wave iii ended at 1.2414, followed by wave iv correction ended at 1.2778, wave v has reached our indicated downside target at 1.2100 and may extend to 1.2000.
To recap, wave B from 1.3066 is unfolding as an a-b-c and is sub-divided as a: 1.2192, b: 1.2716 and wave c is a 5-waver with i: 1.1983, ii: 1.2506, extended wave iii with minor iii at 1.0206, wave iv ended at 1.0781 and wave v as well as wave iii has ended at 0.9931, hence the subsequent choppy trading is the wave iv which is unfolding as (a)-(b)-(c) with (a) leg of iv ended at 1.0854, followed by (b) leg at 1.0108 and (c) leg as well as the wave iv ended at 1.0674. The wave v is sub-divided by minor wave (i): 0.9980, (ii): 1.0374, (iii): 0.9446, (iv): 0.9913 and (v) as well as v has possibly ended at 0.9407, therefore, consolidation with upside bias is seen for major correction, indicated target at 1.3700 and 1.4000 had been met and further gain to 1.4700 would be seen later.
USD/JPY Takes the Lead in USD Rebound
- European equities gain around 0.5% today with Spain underperforming as tomorrow's Puigdemont deadline looms. US stock markets opened with modest gains.
- British pay growth has lagged behind inflation again, official data showed on Wednesday, adding to questions about how quickly the Bank of England will raise interest rates after an initial hike expected on Nov. 2. Britain's jobless rate between June and August held at a 42-year low of 4.3%.
- A larger-than-forecast decline in US new home construction (-4.7% M/M) reflected the weakest pace of building in the South since October 2015, showing the fallout from hurricanes Harvey and Irma, according to government figures Wednesday. Building permits disappointed as well, declining by 4.5% M/M in September.
- Easy monetary policy gives euro zone governments a window of opportunity to enact the reforms needed to boost growth once interest rates have to rise, ECB President Draghi said.
- France's central bank governor Villeroy called for a reduction in the ECB's bond purchases towards "their possible end" in light of stronger inflation, while saying monetary policy should stay easy. ECB board member Lautenschlaeger called for a complete QE rollback in 2018.
- Steven Mnuchin said that there is "no question that the rally in the stock market has baked into it reasonably high expectations of us getting tax cuts and tax reform done". He added that the spectre of regulatory relief has also been priced into stocks.
- Germany's top court threw out a cease-and-desist request that could have halted the ECB's giant bond-buying program, offering some comfort to ECB policy makers as they prepare to extend the purchases into 2018.
- Spanish Deputy Prime Minister Soraya Saenz de Santamaria says the Spanish government will take control of Catalonia unless the regional leader withdraws his claim to independence by 10 am tomorrow.
Rates
Risk-on correction lower in core bond markets
Global core bonds lost ground today in a risk-on environment. USD/JPY eked out nice gains and European equity markets added 0.5%. The move mainly occurred in the European session with once again an outperformance of German Bunds vs US Treasuries (dovish ECB expectations & European political risk). The eco calendar only contained weaker-than-expected US housing data, but markets ignored them because of the big influence from hurricanes Harvey and Irma. ECB Lautenschlaeger and Villeroy both suggested ending QE next year. This is perfectly possible in the currently rumoured extension (to September 2018) and recalibration (from €60 bn/month to €30 bn/month). NY Fed President Dudley sounded confident in the US economy and holds on to a 3-rate hikes scenario this year.
At the time of writing, the US yield curve bear steepens with yields 1.7 bps (2-yr) to 4.2 bps (30-yr) higher. Changes on the German yield curve range between +0.6 bps (2-yr) and +2.5 bps (10-yr). On intra-EMU bond markets, 10-yr yield spread changes versus Germany are nearly unchanged with Spain (+3 bps) underperforming ahead of tomorrow's supply and with Catalan President Puigdement's deadline looming. Spain's deputy PM repeated Madrid's warning today they would implement article 155, stripping Catalonia from its autonomy, if he declares independence.
The German Finanzagentur continued this week's scheduled EMU bond supply with a rather weak 30-yr Bund auction (€1B 1.25% Aug2048). Total bids amounted only €1.34B, way below the €1.98B average at the previous 4 30-yr Bund auctions. The Bundesbank retained €0.19B for secondary market operations, resulting in an official bid cover of 1.7 (real bid cover 1.3).
Currencies
USD/JPY takes the lead in USD rebound
In technical trading, the dollar remained rather well bid, but the relative performance of individual USD cross rates was a bit different from earlier this week. The dollar gained hardly any ground against the euro, despite the Catalan uncertainty. Some 'hawkish' ECB comments probably blocked the euro decline. The pair trades in the 1.1765 area. USD/JPY outperformed, supported by a rise in core US & EMU yields and by a strong risk sentiment. USD/JPY trades in the high 112 area.
Overnight, the focus in Asia was on the opening speech of Chinese President Xi Jinping at the Communist Party congress, but there was little direct impact on global markets. Asian equity indices traded mixed. China outperformed. USD/JPY held a very tight range in the 112.20/25 area. EUR/USD hovered around 1.1765.
The dollar extended its gradual uptrend from earlier this week, but the 'structure' was slightly different. Until now, the dollar gained slightly more against the euro than against the yen. Today, it was the other way around. EUR/USD hovered in the mid 1.17 area, but USD/JPY made a nice intraday up-leg. We didn't see a specific reason for this change. The ongoing equity rally maybe supports USD/JPY, but this argument was also in play earlier this week. There was market talk of Asian USD/JPY shorts being squeezed out of their positions. Whatever the reason, USD/JPY left its recent sluggish performance and jumped to the high 112 area.
Early in the afternoon, some perceived hawkish comments from ECB's Villeroy hit the screens. The euro rebounded further off the intraday lows. US housing data (starts and permits) were again weaker than expected. However, they were disrupted by the impact of the hurricanes and didn't hurt the dollar. In the end, EUR/USD trades little changed from the start of in Europe (1.1765 area). USD/JPY still shows a good gain, trading in the 112.85 area. This evening, the Fed will publish the Beige book preparing the November 01 meeting.
Sterling struggles as data suggest limited tightening
BoE gouvernor Carney kept a balanced approach yesterday on the trade-off between containing inflation and supporting growth. Markets assume that any BoE tightening will be limited as long as Brexit uncertainty continues to cloud the UK economic outlook. This assessment weighed on sterling yesterday and markets maintained their assessment after today's labour market report. The report was mixed. Job growth was less than expected, but the unemployment rate remained at the historically low level of 4.3%. Wage growth was marginally stronger than expected at 2.2% Y/Y, but real wages remain negative (-0.4%). The small beat in wage growth didn't change market expectations that any BoE tightening will be very limited (probably only one hike). EUR/GBP temporary dropped a few ticks, but the move was soon reversed. EUR/GBP trades currently in the 0.8940 area, further supported by the comeback of the euro this afternoon. Cable was mainly driven by the overall swings in the dollar. The pair trades in the 1.3165 area.
US: Hurricanes Limit Homebuilding in September, But Fundamentals Display Strength
Homebuilding took a nosedive in September on account of hurricane-induced disruptions. Housing starts fell (-56k) to 1127k, disappointing markets that had expected a decline to 1175k. Building permits also surprised to the downside, falling (-57k) to 1215k.
Single-family starts accounted for the bulk of the decline, falling by 40k from an upwardly revised (+18k) August reading to register 829k on the month. Multi-family building also suffered a loss, retrenching (-16k) to 298k from a downwardly revised (-15k) August reading.
Building permits weakened on account of business closures related to the hurricanes. However, single-family permits rose 19k to 819k, while the volatile multi-family segment saw permits tumble by 76k to 396k, from a downwardly revised (-28k) August reading.
As expected, activity in the South weighed (-54k), extending the previous month's losses related to Hurricane Harvey. The Midwest also saw activity subside (-39k), with the Northeast subtracting another 10k units from the headline number, leaving the West as the sole region to see homebuilding gain momentum (+47k).
Key Implications
Today's headline largely reflects delayed homebuilding in Texas and Florida as a result of Hurricanes Harvey and Irma. Despite the drop in single-family starts, permits advanced strongly, indicating that the weakness in building is likely transitory. Rebuilding in the coming months will continue to be supported by a tightening labor market that has bolstered household incomes and the pace of household formation. Additionally, lending conditions remain supportive, with mortgage rates having slid year-to-date.
Builders regained confidence in October as hurricane-related uncertainty faded, as evidenced by a rebound in the NAHB's index. However, builders will likely face more substantial labor shortages in the months ahead, with construction activity from the hurricanes requiring even more workers amid a dwindling pool of labor. Additionally, increased demand for building materials will further magnify robust price growth, which may prove to be an obstruction to construction.
Despite these impediments, this report confirms that fundamentals remain strong. As a result, we expect the single-family segment of the market to account for the bulk of the gains going forward, with an anticipated acceleration over the remainder of the year as the estimated minimum 20k houses that were destroyed by the tropical storms are replaced. This will solidify residential investment as a substantial positive contributor to growth into 2018.