
Sample Category Title
USD/CAD Candlesticks and Ichimoku Analysis
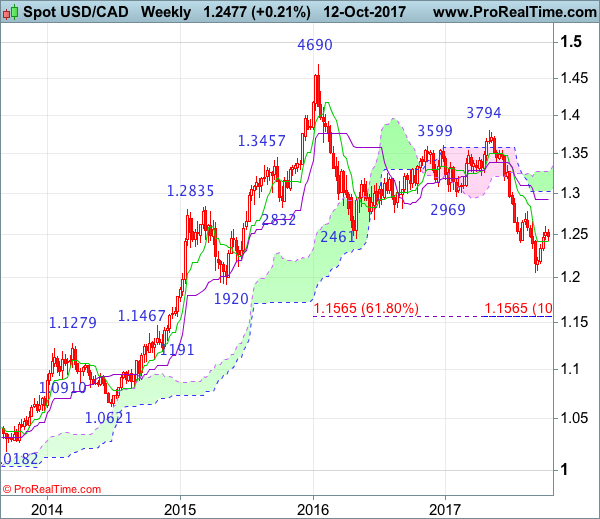
Weekly
• Last Candlesticks pattern: Shooting doji
• Time of formation: 01 May 2017
• Trend bias: Sideways
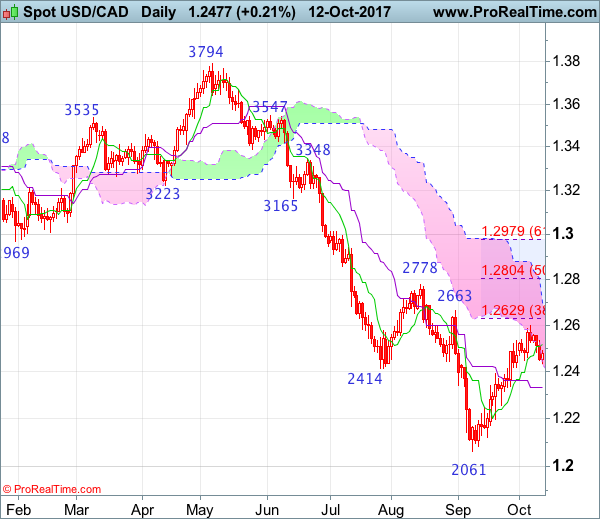
Daily
• Last Candlesticks pattern: Bearish engulfing
• Time of formation: 5 May 2017
• Trend bias: Down
USD/CAD – 1.2477
Although the greenback extended near term rise from 1.2061 low to 1.2599 last week, the subsequent retreat suggests consolidation below this level would be seen and pullback to 1.2400-10 is likely, however, reckon 1.2335-40 would contain downside and bring another rise later, above said resistance at 1.2599 would extend the aforesaid rise for retracement of early decline to 1.2620-25, then towards resistance at 1.2663, having said that, the upper Kumo (now at 1.2701) should limit upside an price should falter well below resistance at 1.2778, bring another decline later.
On the downside, whilst initial pullback to 1.2400 and then 1.2340-50 cannot be ruled out, reckon the Kijun-Sen (now at 1.2330) would limit downside and bring another rise later. Only a daily close below support at 1.2254 would abort and signal the rebound from 1.2061 has ended instead, bring weakness to 1.2198, break there would add credence to this view and extend weakness to 1.2121. Having said that, break there is needed to retain bearishness and bring further fall towards said recent low at 1.2061. Looking ahead, below 1.2061would extend downtrend to psychological level at 1.2000, having said that, loss of momentum should prevent sharp fall below 1.1920-25 (61.8% projection) and 1.1900 should hold.
Recommendation: Turn long at 1.2325 for 1.2525 with stop below 1.2225
On the weekly chart, although the greenback edged higher to 1.2599 last week, lack of follow through buying and the subsequent retreat look set to form a black candlestick this week, suggesting consolidation below said resistance would be seen and below the Tenkan-Sen (now at 1.2420) would bring weakness towards 1.2310-15, however, downside should be limited to 1.2230-40 and bring another rise later. Above said resistance at 1.2599 would signal the rebound from 1.2061 low is still in progress for retracement of recent decline to previous resistance at 1.2663, then 1.2700-10, having said that, price should falter below previous resistance at 1.2778, bring another decline later in Q4.
On the downside, expect pullback to be limited to 1.2310-15 and 1.2280-85 should hold, bring another rise later to aforesaid retracement targets. Below 1.2121 support would abort and signal the rebound from last month’s low at 1.2061 has ended, bring retest o this level later. A drop below 1.2061 would confirm decline from 1.3794 top has resumed and extend weakness towards psychological support at 1.2000, however, reckon downside would be limited to 1.1920-25 (61.8% projection of 1.3794-1.2414 measuring from 1.2778) and reckon 1.1840-50 would hold from here, price should stay above 1.1750-60, bring rebound later.
US Dollar Back In Bearish Zone Vs Japanese Yen
Key Highlights
- The US Dollar after struggling to move above 113.40 against the Japanese Yen started a downside move.
- There was a break below a major bullish trend line at 112.50 on the 4-hours chart of USD/JPY.
- The US Initial Jobless Claims for the week ending Oct 7, 2017 posted a decline from 258K (revised) to 243K.
- Today in the US, the CPI figure for Sep 2017 will be published, which is forecasted to increase 2.3% (YoY).
USDJPY Technical Analysis
The US Dollar failed to move past 113.40 against the Japanese Yen and later started a downside move. The USD/JPY pair is now in the bearish zone and looks set to extend declines.
During the downside move, the pair broke the 23.6% Fib retracement level of the last wave from the 109.54 low to 113.41 high. Moreover, there was a break below a major bullish trend line at 112.50 on the 4-hours chart.
A close below 112.80 has opened the doors for more declines in the near term. The next major support is at 111.50 and the 50% Fib retracement level of the last wave from the 109.54 low to 113.41 high.
On the upside, buyers need to push the pair back above 112.80 and 113.00 to avoid any further declines.
US Initial Jobless Claims
Recently, the US saw the release of the Initial Jobless Claims for the week ending Oct 7, 2017 by the US Department of Labor. The forecast was slated for a decline from 260K to 251K.
The actual result was better the forecast, as there a decline to 243K and the last reading was revised down to 285K. Looking at the 4-week moving average, there was a decline of 9,500 from the previous week’s revised average of 267,000 257,500.
The report added that:
The advance number for seasonally adjusted insured unemployment during the week ending September 30 was 1,889,000, a decrease of 32,000 from the previous week’s revised level.
The outcome was positive, but the current USD/JPY trend seems to be bearish below 113.00 in the short term.
Other Economic Releases to Watch Today
German Consumer Price Index for Sep 2017 (YoY) – Forecast +1.8%, versus +1.8% previous.
German Consumer Price Index for Sep 2017 (MoM) – Forecast +0.1%, versus +0.1% previous.
US Retail Sales Sep 2017 (MoM) – Forecast +1.7%, versus -0.2% previous.
US Consumer Price Index Sep 2017 (MoM) – Forecast +0.6%, versus +0.4% previous.
US Consumer Price Index Sep 2017 (YoY) – Forecast +2.3%, versus +1.9% previous.
US Consumer Price Index Ex Food & Energy Sep 2017 (YoY) – Forecast +1.8%, versus +1.7% previous.
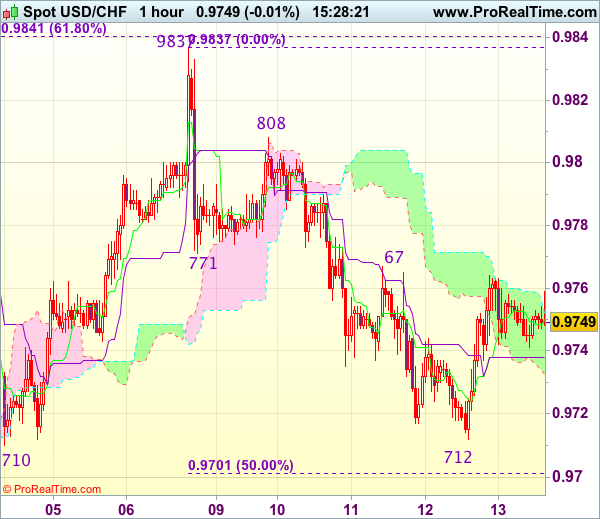
Trade Idea : USD/CHF – Hold short entered at 0.9755
USD/CHF - 0.9756
Most recent candlesticks pattern : N/A
Trend : Near term down
Tenkan-Sen level : 0.9750
Kijun-Sen level : 0.9738
Ichimoku cloud top : 0.9752
Ichimoku cloud bottom : 0.9733
Original strategy :
Sold at 0.9755, Target: 0.9655, Stop: 0.9790
Position : - Short at 0.9755
Target : - 0.9655
Stop : - 0.9790
New strategy :
Hold short entered at 0.9755, Target: 0.9655, Stop: 0.9790
Position : - Short at 0.9755
Target : - 0.9655
Stop : - 0.9790
Although the greenback rebounded after holding above previous support at 0.9710 and consolidation with initial upside bias is seen, reckon resistance at 0.9767-71 would limit upside and bearishness remains for the decline from 0.9837 top to resume after consolidation, below said support at 0.9710-12 would confirm and extend weakness to 0.9669-70 (61.8% Fibonacci retracement of 0.9565-0.9837 and previous support) but previous support at 0.9642 should remain intact due to oversold condition.
In view of this, we are holding on to our short position entered at 0.9755. Only break of resistance at 0.9808 would signal an intra-day low is formed and indicate the pullback from 0.9837 has ended, bring retest of this level later.
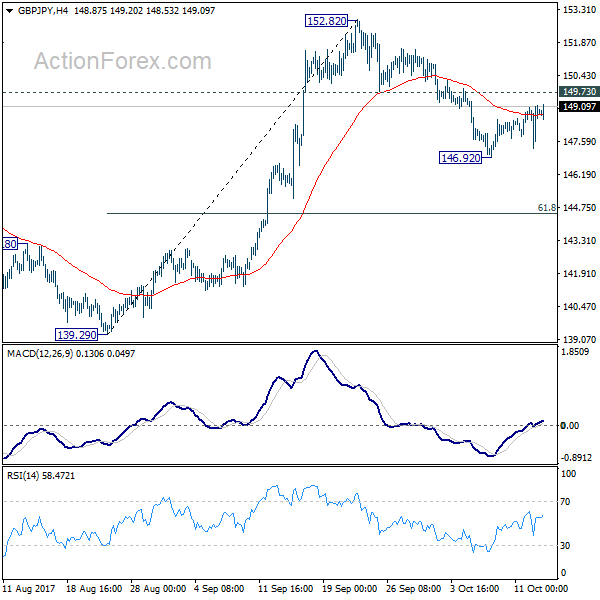
GBP/JPY Daily Outlook
Daily Pivots: (S1) 147.77; (P) 148.46; (R1) 149.63; More
At this point, GBP/JPY is staying in consolidation above 146.92 temporary low and intraday bias remains neutral. Another decline is expected with 149.73 resistance intact. Below 146.92 will target 61.8% retracement of 139.29 to 152.82 at 144.45. Such decline is seen as a correction and we'd look for strong support from 144.45 to bring rebound. On the upside, break of 149.73 support turned resistance will argue that the pull back is completed and turn bias back to the upside for retesting 152.82 high. However, sustained break of 144.45 will put 139.29 key support in focus.
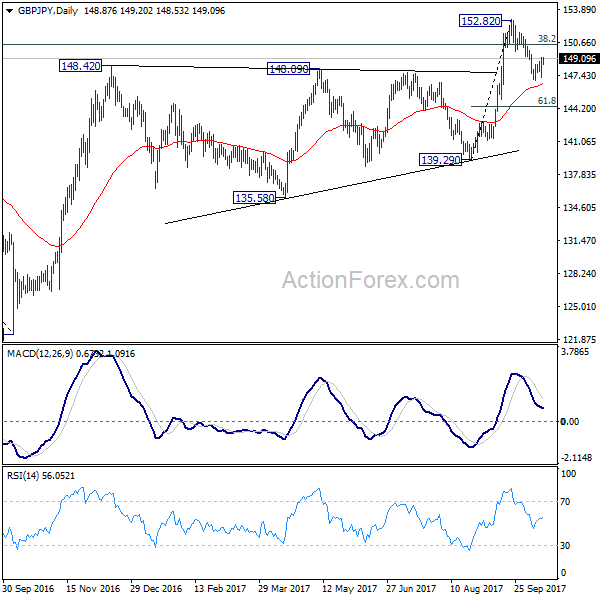
In the bigger picture, medium term rebound from 122.36 is still expected to resume after corrective pull back from 152.82 completes. Firm break of 38.2% retracement of 196.85 to 122.36 at 150.43 will carry long term bullish implications. In that case, GBP/JPY could target 61.8% retracement at 167.78. However, break of 139.29 will indicate rejection from 150.43 key fibonacci level. And the three wave corrective structure of rebound from 122.36 will argue that larger down trend is resuming for a new low below 122.26.
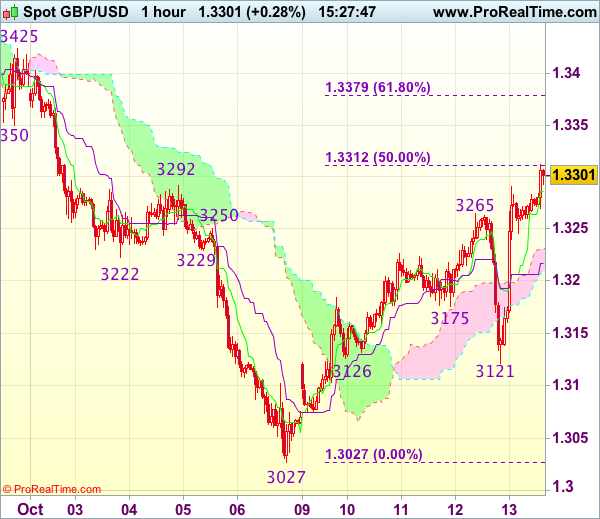
Trade Idea : GBP/USD – Buy at 1.3250
GBP/USD - 1.3316
Most recent candlesticks pattern : N/A
Trend : Near term up
Tenkan-Sen level : 1.3292
Kijun-Sen level : 1.3223
Ichimoku cloud top : 1.3230
Ichimoku cloud bottom : 1.3209
New strategy :
Buy at 1.3250, Target: 1.3350, Stop: 1.3215
Position : -
Target : -
Stop : -
As the British pound found renewed buying interest at 1.3121 yesterday and has rallied, suggesting the rise from 1.3027 low is still in progress, hence consolidation with upside bias is seen for this move to bring a stronger retracement of recent decline, hence gain to 1.3345-50 would be seen, however, near term overbought condition should limit upside to 1.3375-80 (61.8% Fibonacci retracement of 1.3596-1.3027) and 1.3400 should hold from here.
In view of this, would not chase this rise here and would be prudent to buy cable on pullback as 1.3245-50 should limit downside. Below the Kijun-Sen (now at 1.3223) would defer and suggest an intra-day top is formed, bring weakness to 1.3200, then towards 1.3175 but said support at 1.3121 should remain intact.
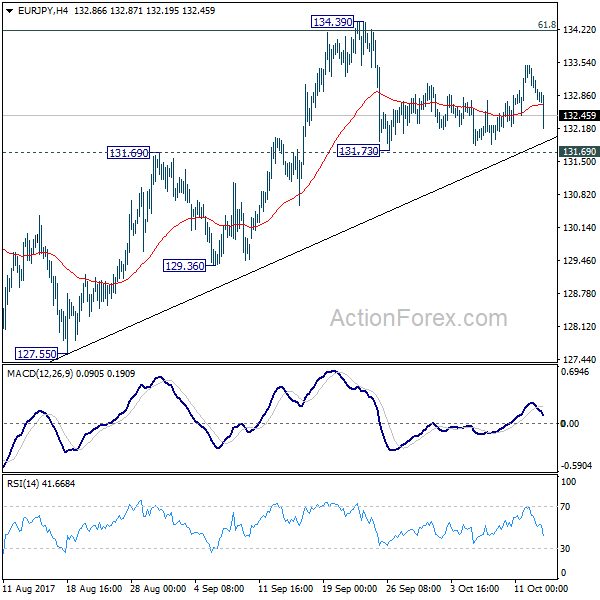
EUR/JPY Daily Outlook
Daily Pivots: (S1) 132.59; (P) 133.04; (R1) 133.28; More...
No change in EUR/JPY's outlook as it's still bounded in range of 131.73/134.39. Intraday bias remains neutral at this point. Near term outlook remains bullish as long as 131.69 holds. Sustained break of 134.20 fibonacci level will extend larger up trend to 141.04 resistance next. However, break of 131.69 will be an early sign of medium term reversal and will target 127.55 key support level instead.
In the bigger picture, medium term rise from 109.03 (2016 low) is seen as at the same degree as the down trend from 149.76 (2014 high) to 109.03 (2016 low). 61.8% retracement of 149.76 to 109.03 at 134.20 is already met. Sustained break there will pave the way to key long term resistance zone at 141.04/149.76. However, break of 127.55 support will argue that the medium term trend has reversal and will turn outlook bearish for deeper fall.

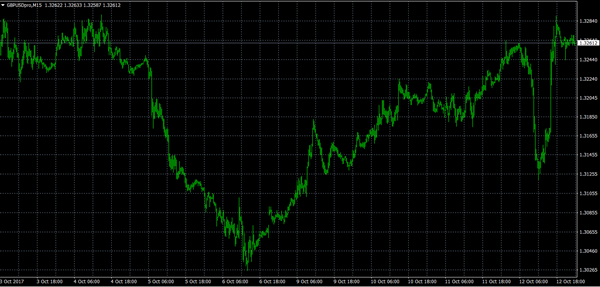
Pound Surges On Brexit Headline
The British pound has recovered all of yesterday afternoons trading losses against the U.S dollar hitting 1.3290, after headlines broke that EU chief negotiator, Michel Barnier is ready to offer a two-year transition period after Brexit, if the UK can meet the EU's financial terms.
Intraday trading sentiment surrounding the GBPUSD pair is now bullish, as any progress in Brexit negotiations between the UK and the EU is perceived to be hawkish for the British pound.

Yesterday's the GBPUSD pair managed to close price above the key 1.3220 level, with a bullish close of 1.3264. Buyers are also pushes prices to higher daily high's, signaling further possible gains ahead.
Today's daily and weekly price close will be crucial for determining the sincerity of yesterday's rebound, as traders await a raft of high-impact U.S data later today.

Key intraday technical resistance for the GBPUSD pair is found at 1.3290, 1.3323 and the key 1.3360 level. Above the 1.3360 level, further resistance is found at 1.3395 and 1.3450.
To the downside, key intraday technical support is found at 1.3264 and the former swing-low at 1.3244. Once below 1.3244, further support is found at the daily pivot point, at 1.3225 and the key 1.3200 level.
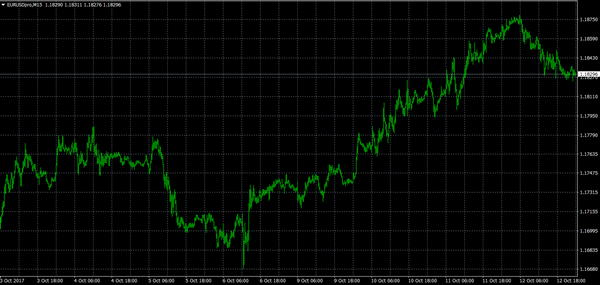
Bullish EURUSD Chart Pattern Remains Valid
The EURUSD pair continues to consolidate at the top-end of its weekly range, as traders await Retail Sales and CPI inflation data from the U.S later today. Yesterday the pair slipped back towards the 1.1825 level, as the United States economy released better than expected PPI figures for September.
Intraday trading sentiment surrounding the EURSD pair this Friday remains bullish, as risk-assets continue to rally and the euro still trades comfortably above the key 1.1800 support level.
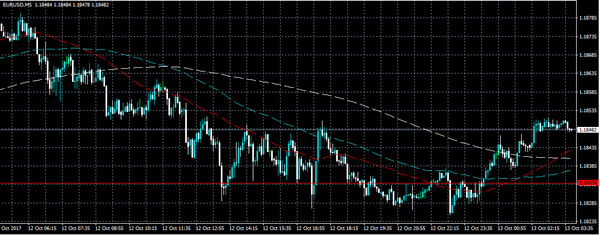
Technically, the EURUSD pair is trading in a bullish inverse head and shoulder pattern, with a price projection towards 1.1990. The neckline of the pattern is located around the 1.1825 to 1.1833 region.
The validity of the pattern is likely to be tested later today, as the U.S economy releases high-impact economic data, and a host of FED and ECB officials are also due to speak during the upcoming U.S session.
Key intraday support for the EURUSD pair is found at the daily pivot point, at 1.1846 and the current daily low, at 1.1825. Further support is found at the 1.1800 and 1.1770 levels.
To the upside, key intraday resistance is found at 1.1855 and the weekly price high, at 1.1879. Further resistance is found at the 1.1910 level, and the September 25th swing-price high, at 1.1936.
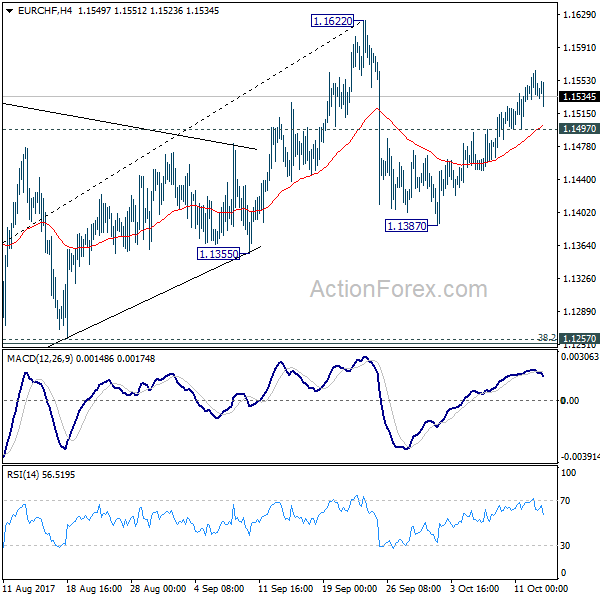
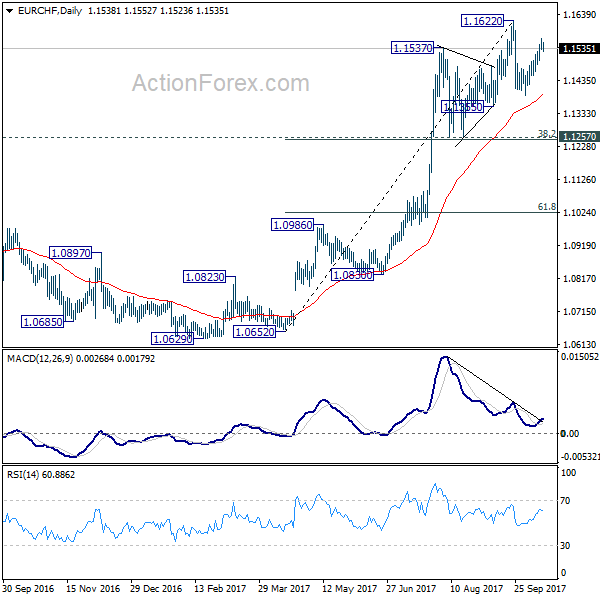
EUR/CHF Daily Outlook
Daily Pivots: (S1) 1.1524; (P) 1.1545; (R1) 1.1557; More....
With 1.1497 minor support intact, further rise is mildly in favor in EUR/CHF for 1.1622 resistance. But still, firm break there is needed to confirm up trend resumption. Otherwise, the consolidation from should continue with risk of at least another fall. Below 1.1450 will turn bias to the downside for 1.1387 and below. Strong support in expect at 1.1257 cluster support (38.2% retracement of 1.0652 to 1.1622 at 1.1251) to contain downside and bring rebound.
In the bigger picture, long term rise from SNB spike low back in 2015 is still in progress. EUR/CHF should now be heading back to prior SNB imposed floor at 1.2000. For now, this will be the favored case as long as 1.1198 resistance turned support holds.
US Consumer Data Takes Centre Stage Friday
US economic data will make headlines on Friday, giving investors plenty of clues about the health of the world’s largest economy.
The Labor Department will release the Consumer Price Index (CPI) at 12:30 GMT. The report is expected to show a sharp pickup in inflation thanks to rebounding oil prices. Annual CPI is expected to come in at 2.3% in September, up from 1.9% the month before. The core CPI rate, which excludes food and energy, is expected to rise 1.8% year-over-year.
A report on retail sales from the Commerce Department will be released alongside the CPI data. Receipts at retail stores are forecast to rise 1.7% in September, following a 0.2% decline the previous month. Excluding automobiles, sales are expected to climb 0.3%.
The Commerce Department will release its monthly business inventories report at 14:00 GMT. Inventories are expected to rise 0.7% in August after climbing 0.2% the month before.
The University of Michigan will release the preliminary consumer sentiment index at 14:00 GMT. Consumer confidence is forecast to go largely unchanged for the month.
Later in the day, Baker Hughes Inc. will report on the weekly rig count, which has been known to generate volatility in crude prices.
On the central bank circuit, Federal Open Market Committee (FOMC) members Robert Kaplan and Jerome Powell are scheduled to deliver speeches in the afternoon. Federal Reserve Bank of Chicago President Charles Evans will also deliver a speech.
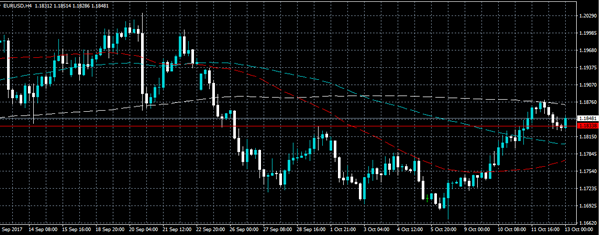
EUR/USD
The euro’s gains moderated on Thursday, as the EUR/USD eased off daily highs of 1.1878. The pair traded within a narrow range during Friday’s Asian session. Initial resistance is being met at the 1.1830-1.1840 level, which corresponds to the 20-day and 55-day moving averages. A close above this level on Friday could generate support back toward the 1.1900 level. On the opposite side of the ledger, immediate support is located at the August low of 1.1662.
GBP/USD
The British pound experienced a series of volatile moves on Thursday. Cable bottomed at 1.3118, the lowest since Monday, before completely reversing losses later in the day. The GBP/USD is currently trading around 1.3260, where it faces immediate support at 1.3200. A break below that level could expose the 1.3120 support area, followed by the 9 October low of 1.3075. On the flipside, resistance is likely to be met north of 1.3300.
US OIL
Oil prices snapped a three-day winning streak on Thursday, as the market consolidated following a series of sharp rallies. US crude prices traded below $51.00 a barrel through the Asian session. The contract remains in a solid buy opportunity over the medium term, but is less attractive on the 15-minute charts. Baker Hughes data on Friday could provide the necessary spark in either direction.
