
Sample Category Title
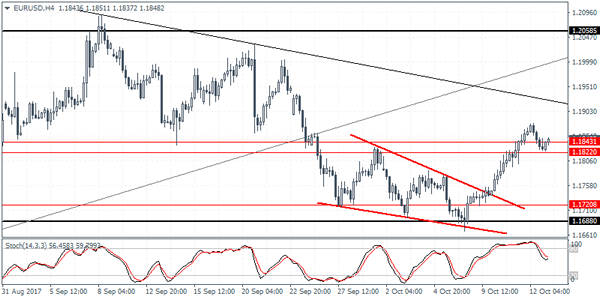
Trade Idea : EUR/USD – Buy at 1.1800
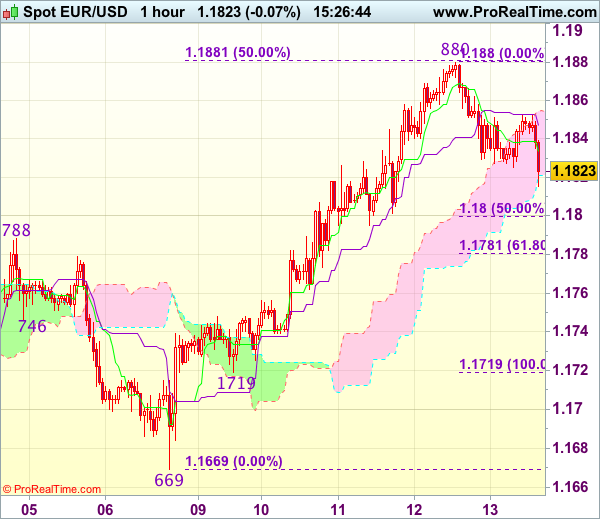
EUR/USD - 1.1826
Most recent candlesticks pattern : N/A
Trend : Near term up
Tenkan-Sen level : 1.1834
Kijun-Sen level : 1.1847
Ichimoku cloud top : 1.1854
Ichimoku cloud bottom : 1.1821
Original strategy :
Buy at 1.1805, Target: 1.1905, Stop: 1.1770
Position : -
Target : -
Stop : -
New strategy :
Buy at 1.1800, Target: 1.1900, Stop: 1.1765
Position : -
Target : -
Stop : -
Although euro’s retreat from 1.1880 (this week’s high) has retained our view that minor consolidation below this level would be seen and pullback to 1.1800-01 (50% Fibonacci retracement of 1.1719-1.1880 and previous support) cannot be ruled out, reckon downside would be limited and bring another rise later, above 1.1855-60 would signal pullback from said resistance at 1.1880 has ended, bring retest of this level, break there would signal the rise from 1.1669 low has resumed for headway to 1.1895-00 (61.8% Fibonacci retracement of 1.2035-1.1669).
In view of this, would not chase this rise here and we are still looking to buy euro on subsequent pullback as 1.1800-05 should limit downside and bring another rebound. Below minor support at 1.1795 would defer and risk correction to 1.1770 but downside should be limited to 1.1745-50 and price should stay above indicated support at 1.1719, bring another rise later.
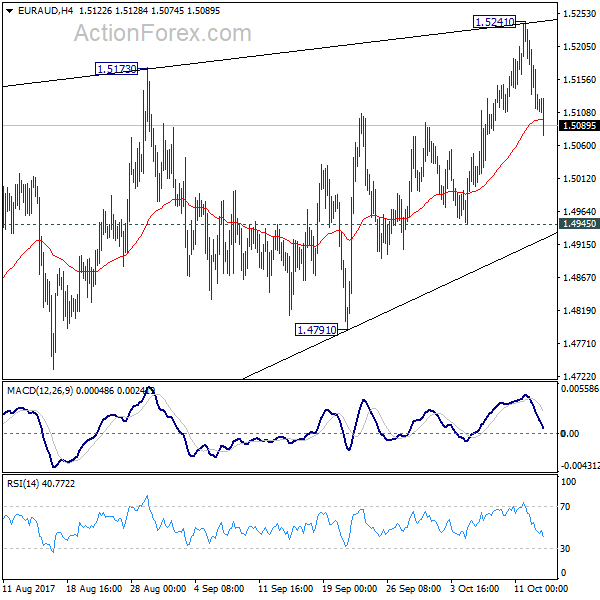
EUR/AUD Daily Outlook
Daily Pivots: (S1) 1.5081; (P) 1.5156; (R1) 1.5197; More....
The sharp fall and break of 1.5108 minor support indicates that EUR/AUD has failed to sustain above 1.5226 resistance. And intraday bias is turned back to the downside for 1.4945 support first. Break there will target 1.4791 support and below. Overall, EUR/AUD could be in a consolidation pattern from 1.5226. Rise from 1.3624 is still expected to resume later.
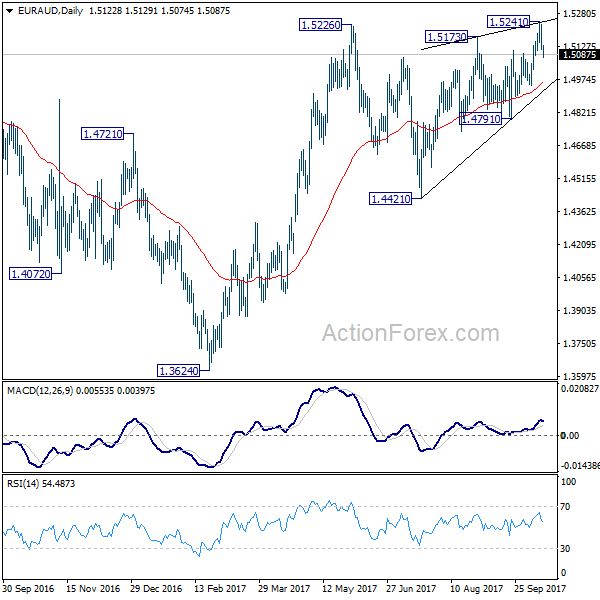
In the bigger picture, we're holding on to the view that corrective decline from 1.6587 medium term top has completed at 1.3624. Rise from 1.3624 is expected to extend to retest 1.6587. The corrective structure of the price actions from 1.5226 is affirming this view. Above 1.5226 will target a test on 1.6587 key resistance. However, break of 1.4421 support will dampen our view and would drag EUR/AUD lower to retest key support zone around 1.3624.
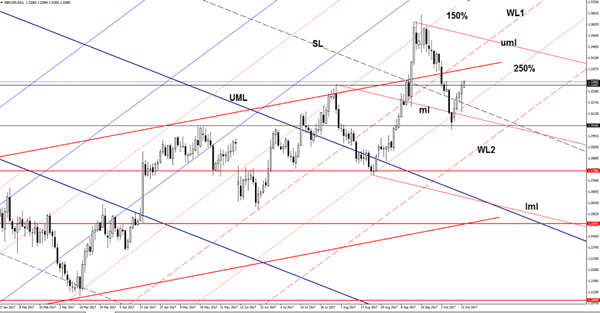
GBP/USD At New Highs
The GBP/USD increased and climbed above the 1.3289 yesterday’s high and is expected to reach the up sloping red line very soon. Technically is still expected to climb much higher as long is trading within the ascending channel between the 150% and the 250% Fibonacci lines. Only a valid breakdown below the 250% Fibonacci line will announce a broader drop.
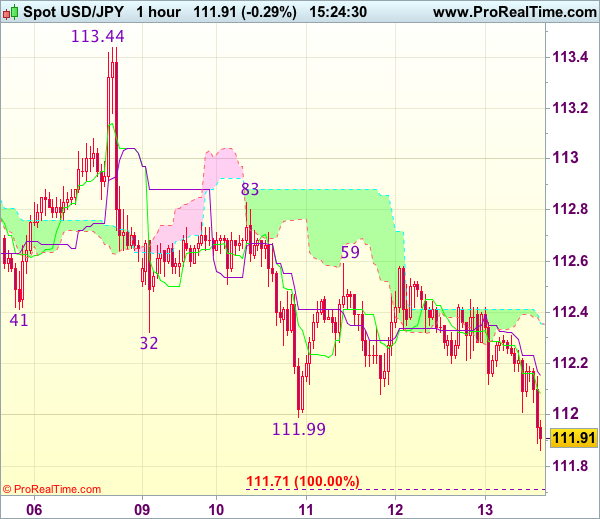
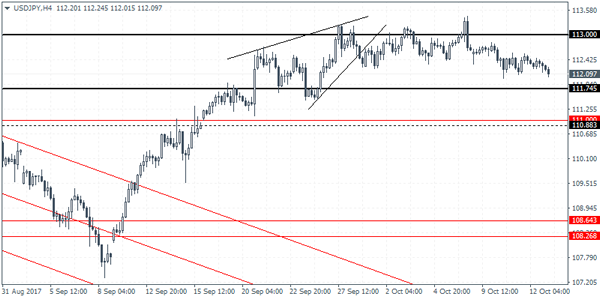
Trade Idea : USD/JPY – Sell at 112.25
USD/JPY - 111.92
Most recent candlesticks pattern : N/A
Trend : Near term down
Tenkan-Sen level : 112.09
Kijun-Sen level : 112.16
Ichimoku cloud top : 112.36
Ichimoku cloud bottom : 112.36
Original strategy :
Sell at 112.80, Target: 111.80, Stop: 113.15
Position : -
Target : -
Stop : -
New strategy :
Sell at 112.25, Target: 111.25, Stop: 112.60
Position : -
Target : -
Stop : -
As dollar has remained under pressure after breaking below this week’s low at 111.99, adding credence to our bearishness and signaling the fall from 113.44 top is still in progress, hence downside bias remains for this move to extend weakness to 111.70-75 (100% projection of 113.44-112.32 measuring from 112.83), below there would bring subsequent decline to 111.47 support but oversold condition would limit downside and reckon 111.11 support would remain intact.
In view of this, we are looking to sell dollar on recovery as 112.25-30 should limit upside and bring another decline. Above resistance at 112.59 would abort and signal low is formed instead, risk a stronger rebound to indicated resistance level at 112.83.
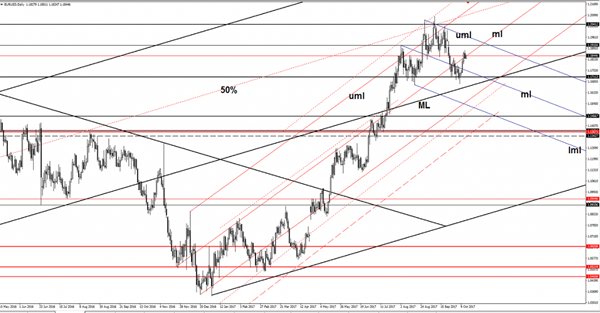
EUR/GBP Is This A False Breakout?
Price increased a little today and tries to recover after the yesterday’s minor drop. EUR/USD is retesting the median line (ml) of the ascending pitchfork, a false breakout above this obstacle will send the rate down again. Technically, the pair was somehow expected to climb to retest the 1.1910 resistance and the upper median line (uml) of the minor descending pitchfork. Could still develop a Head and Shoulders pattern if will stay below the mentioned resistance levels.
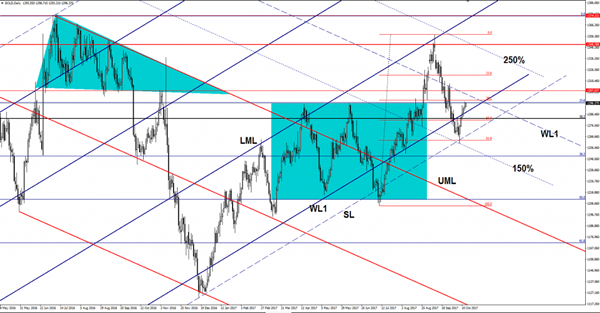
Gold Struggling To Stay Higher
The yellow metal increased in the morning and tries to stay in the green territory. Price is pressuring an important horizontal resistance and seems determined to reach the 1297 yesterday’s high. Price increase as the USDX is still under selling pressure on the short term. The Gold has taken advantage of the weak dollar and has managed to recover after the last corrective phase.
Gold should reach the $1300 per ounce if the United States data will disappoint in the afternoon. You should be careful because we may have some volatility in the US session as the United States is to release the CPI, Core CPI, Core Retail Sales and the Retail Sales data.
The greenback needs a bullish spark from the US economy to be able to increase again, the yellow metal will slip lower if the USDX will start a bullish momentum.
Gold has managed to climb much above the warning line (WL1) of the ascending pitchfork and now if challenging the 23.6% retracement level. A larger rebound will be confirmed only after a valid breakout above the warning line (WL1) of the major descending pitchfork, while a rejection from here and a failure to reach the mentioned dynamic resistance will send the rate tumbling.
The current rebound is natural after the false breakdown below the 61.8% retracement level and below the sliding parallel line (SL).
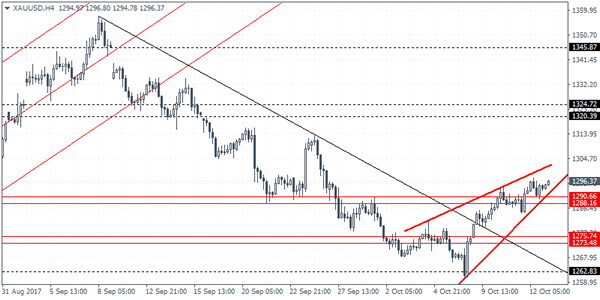
XAUUSD Intraday Analysis
XAUUSD (1296.37): Gold prices are seen attempting to rally after clearing the resistance level of 1290 - 1288. Further upside in the price action could keep gold prices on track to test the next major resistance level that comes in at 1324 - 1320 region. However, the recent gains in gold prices off the lower support at 12262 signals a possible ascending wedge pattern. A potential breakout from this level, below 1288 - 1290 could signal a downside breakdown in prices. This will bring gold prices back to the 1275 - 1273 support and eventually towards 1262 support to complete the downside correction.
USDJPY Intraday Analysis
USDJPY (112.09): The USDJPY has been trending lower following the brief consolidation seen near the falling trend line. Price action has been edging lower after trading flat within the resistance level of 113.00 and support level of 111.74. We expect this range to be maintained in the near term with USDJPY likely to see a modest bounce off the support. However, in the event of a break down below 111.74, we can expect further declines to push USDJPY lower towards the support level of 111.00 - 110.88 region where the next main support level resides.
EURUSD Intraday Analysis
EURUSD (1.1848): The EURUSD was bearish yesterday but with price action rallying above the support area of 1.1843 - 1.1822 the declines are likely to be limited. In the overnight session, the EURUSD was seen falling back into the support level and currently attempting to push higher. A convincing close above this support area is required to build confidence to the upside. Price action could be targeting the unfilled gap at 1.19448 as a result. However, in the event of price failing to hold the gains, we could expect the downside risks building up. Lower support at 1.1720 comes back into focus with a potential for EURUSD to post further declines on a break down below 1.1688
US Inflation Expected To Rise In September
The US dollar was trading rather mixed, coming out strongly against the euro was seen trading rather flat against the yen and the British pound. Economic data released yesterday showed that the weekly unemployment claims fell sharply, rising just 243k against estimates of 251k while producer price index data rose 0.4% on the month as expected. The PPI data raised expectations that consumer prices could also rise in the near term.
FOMC members Powell and Brainard along with ECB President Mario Draghi gave their views on monetary policy. The ECB President sounded cautious as he said that the central bank would remain accommodative.
Looking ahead, the main focus for today will be the US consumer prices index data for the month of September. According to the economists polled, headline CPI is expected to rise 0.6% on the month and rise above 2% on a year over year basis. Core CPI is expected to rise 0.2% on the month, maintaining a steady pace of gains. US retail sales numbers are also expected with forecasts showing a bullish print.