Sample Category Title
USD/CHF Breakout Still Possible
The USD/CAD increased today and still tries to breakout through the confluence area formed at the intersection between the 0.9787 resistance with the outside sliding line (SL). A valid breakout will accelerate the upside movement. Technically, it could move sideways to recapture more directional energy before will resume the upside movement.
USD/CAD Breakout Validated
The currency pair increased today and tries to climb much higher after the breakout above an important dynamic resistance. Price tries to recover after the Friday's drop, we'll see what will happen because the USDX could slip lower in the upcoming days.
The dollar index failed to stay above the 93.81 static resistance and shows some exhaustion signs. A USDX's drop will force the USD to lose ground versus all its rivals on the short term. Right now is premature to talk about a correction on the USDX because is still located above some important support levels.
The price was driven by the technical factors today, we had a poor economic calendar, the Canadian banks are closed in observance of Thanksgiving Day, while the US Banks are closed in observance of Columbus Day.
USD/CAD has come down to retest the broken upper median line (uml) of the minor descending pitchfork. Technically, it should increase further after the breakout from the descending pitchfork. The next upside target will be at the 1.2678 static obstacle and at the median line (ML) of the major descending pitchfork.
However, price could come down to retest the 1.2460 and also the median line (ml) of the blue ascending pitchfork before will jump much higher. Another leg lower if off the table right now, only a breakdown below the median line (ml) of the blue ascending pitchfork will announce a drop towards the lower median line (LML) of the red descending pitchfork.
NZD/USD Falling Wedge Invalidated
The price increased in the first part of the day and tried to close the morning gap down, but failed to stay near 0.7084 today's high and now could reach the 0.7053 static support. I've drawn a potential Falling Wedge pattern, but the rate has broken below the downside line of this pattern.
A valid breakdown below the horizontal obstacle will confirm a further drop in the upcoming period, the next downside target will be at the WL2.
EUR/CHF To Reach Strong Obstacles
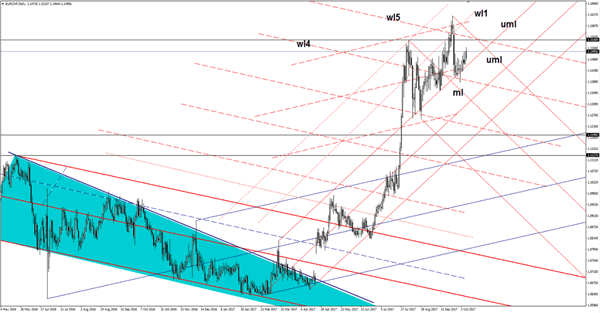
Price moves higher on the daily chart after the retest of the upper median line (uml) of the minor ascending pitchfork. Is attracted by the fifth warning line (wl5) and by the upper median line (uml) of the descending pitchfork, actually could be attracted by the confluence area formed between these two lines.
Holidays in American and Japan Led to Lower Market Activity
The EUR/USD gained some positions despite tensions in Spain that threaten stability in the European Union. The bulls pushed the price higher on the background of positive macro data. German industrial production increased in August by 2.6% versus the 0.9% forecasted and the Sentix investor confidence index in the Eurozone has grown to 29.7 in October compared to 28.6 expected. The greenback is getting support from positive news on the decline in unemployment to 4.2% in the US. At the same time, economic activity is likely to increase due to rebuilding in the regions that were affected by hurricanes Harvey and Irma.
The British pound demonstrated a confident increase on the back of the news regarding the Minister of Foreign Affairs, Boris Johnson, leaving his office. Prime Minister Theresa May is showing unity within the government and that is vital in the ongoing negotiations on the Brexit terms with Europe. The growth potential is likely to be limited, but tomorrow's publication on industrial production and trade balance in the UK may significantly impact trader sentiment.
The volatility of the USD/JPY decreased because of holidays in Japan and the US. At the same time investors are waiting for the outcome of the Catalan crisis in Europe and in case of easing tensions, the demand for the Japanese yen as a safe haven asset is likely to fall. Some impact on the price may come from the news on the current account balance in Japan that will be released at 23:50 GMT tonight.
EUR/USD
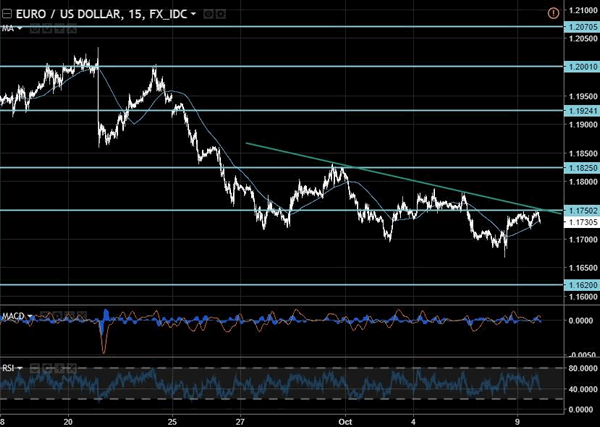
The common currency is testing resistance at 1.1750 and in case of its overcoming we may see the trend reverse to positive with the closest targets at 1.1825 and 1.1925. On the other hand, the next goal within the current downtrend is located at 1.1620 and after breaking through it the quotes may reach into the 1.1500-1.1550 range.
GBP/USD
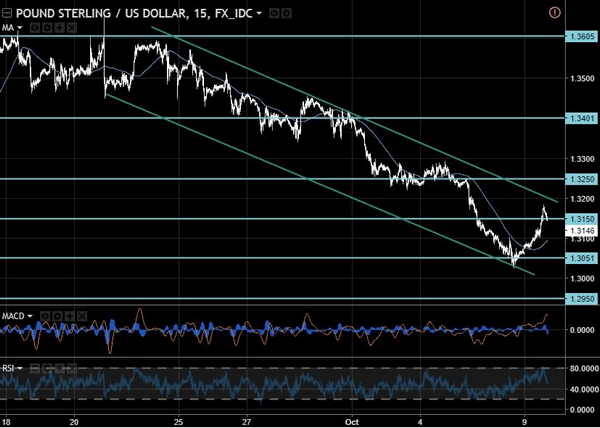
The GBP/USD price was not able to fix under the support line at 1.3050 and rebounded within the channel. In case of breaking through the upper limit of the descending corridor quotes may rise up to 1.3200 and higher. On the other side, the fall resumption inside the channel is likely to lead to the price declining to psychologically important level of 1.3000.
USD/JPY
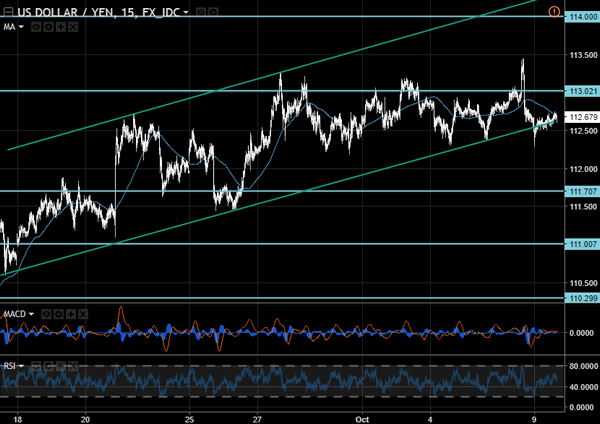
The USD/JPY is moving along the lower boundary of the ascending band. In order to continue the upward movement, quotations need to gain a foothold above the resistance at 113.00. After a long consolidation below 113.00 we may see a sharp movement in either direction. For the trend change to negative with potential targets at 111.00 and 110.30 the price needs to fix beyond the limits of the channel.
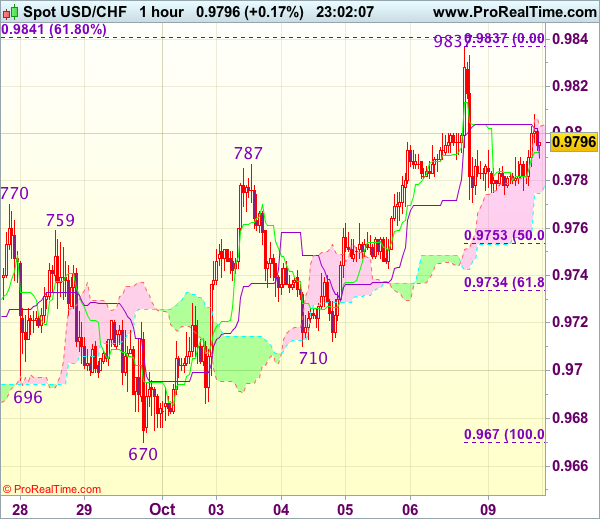
Trade Idea Wrap-up: USD/CHF – Stand aside
USD/CHF - 0.9794
Most recent candlesticks pattern : N/A
Trend : Near term up
Tenkan-Sen level : 0.9792
Kijun-Sen level : 0.9790
Ichimoku cloud top : 0.9803
Ichimoku cloud bottom : 0.9775
New strategy :
Stand aside
Position : -
Target : -
Stop : -
Despite surging to 0.9837 on Friday, the subsequent retreat in NY suggests top has possibly been formed there and consolidation with mild downside bias is seen for weakness to 0.9750-55 (50% Fibonacci retracement of 0.9670-0.9837), however, break of 0.9730-35 (61.8% Fibonacci retracement) is needed to add credence to this view, bring further fall towards support at 0.9710 which is likely to hold on first testing.
On the upside, whilst recovery to 0.9805-10 cannot be ruled out, reckon said resistance at 0.9837 would hold and bring another retreat later. Above said resistance at 0.9837 would shift risk back to upside and signal the rise from 0.9421 low is still in progress, then gain to 0.9875-80 would follow but reckon 0.9900 would hold from here. As near term outlook is mixed, would be prudent to stand aside for now.
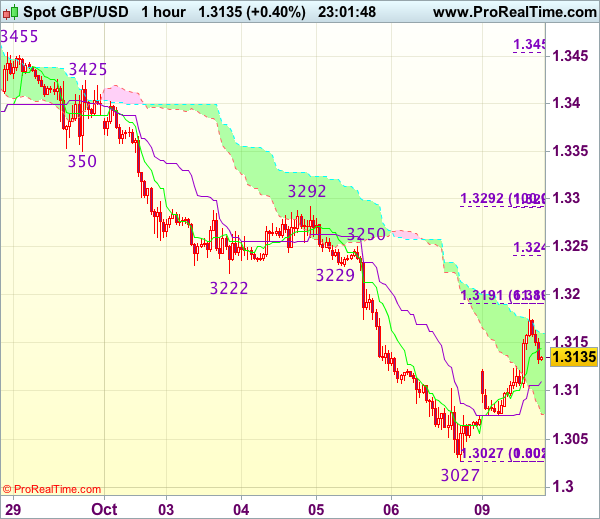
Trade Idea Wrap-up: GBP/USD – Hold short entered at 1.3170
GBP/USD - 1.3127
Most recent candlesticks pattern : N/A
Trend : Down
Tenkan-Sen level : 1.3144
Kijun-Sen level : 1.3110
Ichimoku cloud top : 1.3160
Ichimoku cloud bottom : 1.3076
Original strategy :
Sold at 1.3170, Target: 1.3070, Stop: 1.3195
Position : - Short at 1.3170
Target : - 1.3070
Stop : - 1.3195
New strategy :
Hold short entered at 1.3170, Target: 1.3070, Stop: 1.3185
Position : - Short at 1.3170
Target : - 1.3070
Stop : - 1.3185
Although cable surged again earlier today in European session, reckon 1.3190-95 (61.8% Fibonacci retracement of 1.3292-1.3027 as well as 38.2% Fibonacci retracement of 1.3455-1.3027) would cap upside and bring retreat later, below 1.3100 would suggest an intra-day top is formed, bring test of 1.3065-75, break there would suggest the rebound from 1.3027 has ended, bring retest of this level, break there would extend recent decline to psychological support at 1.3000 next.
In view of this, we are holding on to our short position entered at 1.3170. Above 1.3190-95 would risk test of previous support at 1.3222-29 (now resistance), break there would abort and signal low has been formed at 1.3027 instead, bring further gain to 1.3250 but price should falter below resistance at 1.3292.
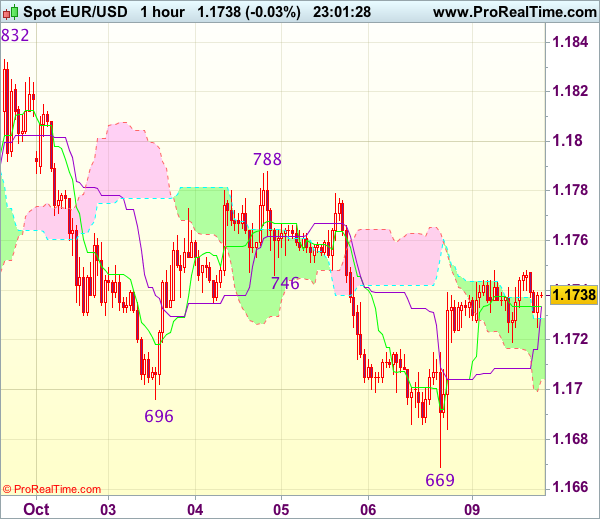
Trade Idea Wrap-up: EUR/USD – Buy at 1.1690
EUR/USD - 1.1738
Most recent candlesticks pattern : N/A
Trend : Down
Tenkan-Sen level : 1.1734
Kijun-Sen level : 1.1734
Ichimoku cloud top : 1.1729
Ichimoku cloud bottom : 1.1704
Original strategy :
Buy at 1.1690, Target: 1.1790, Stop: 1.1655
Position : -
Target : -
Stop : -
New strategy :
Buy at 1.1690, Target: 1.1790, Stop: 1.1655
Position : -
Target : -
Stop : -
Although the single currency extended recent fall to 1.1669, the subsequent rebound late Friday suggests a temporary low has possibly been formed there, hence consolidation with upside bias is seen for gain to 1.1750 and then towards resistance at 1.1788, however, break there is needed to add credence to this view, bring retracement of recent decline to 1.1800 and later towards resistance at 1.1832 which is likely to hold from here.
In view of this, we are looking to turn long on dips as 1.1690-00 should limit downside and bring another rebound. Only break of strong support at 1.1662-69 would signal recent decline is still in progress and may extend weakness towards 1.1625-30 but reckon 1.1600 would hold.
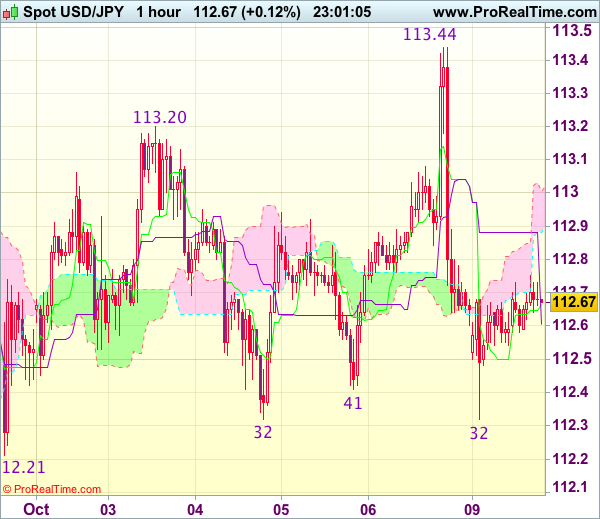
Trade Idea Wrap-up: USD/JPY – Sell at 113.10
USD/JPY - 112.68
Most recent candlesticks pattern : N/A
Trend : Up
Tenkan-Sen level : 112.67
Kijun-Sen level : 112.61
Ichimoku cloud top : 113.01
Ichimoku cloud bottom : 112.88
Original strategy :
Sell at 113.10, Target: 112.10, Stop: 113.45
Position : -
Target : -
Stop : -
New strategy :
Sell at 113.10, Target: 112.10, Stop: 113.45
Position : -
Target : -
Stop : -
Although the greenback jumped to 113.44 on Friday, the subsequent reversal from there to 112.32 suggests top has possibly been formed there and consolidation with downside bias is seen for test of support at 112.21, however, break there is needed to add credence to this view, bring retracement of early upmove to 112.00, then 111.75-80 but previous support at 111.47 should remain intact.
In view of this, we are looking to sell dollar on recovery as resistance area at 113.20-26 should cap upside and bring another decline to aforesaid downside targets. Only break of said resistance at 113.44 would abort and signal recent upmove is still in progress for further gain to 113.75-80 and possibly towards 114.00-10 which is likely to hold from here, bring correction later.
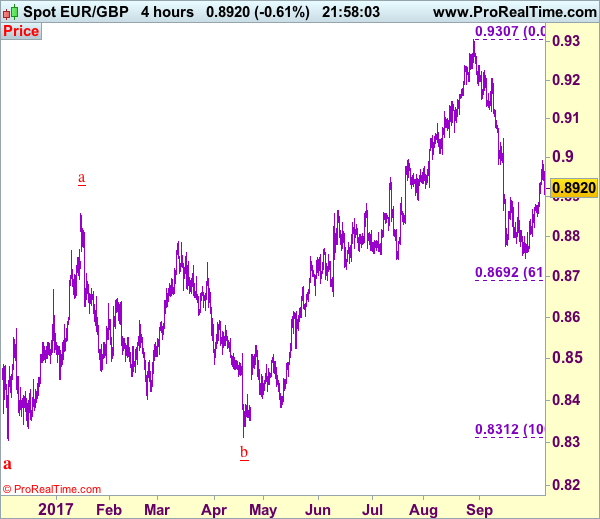
Trade Idea: EUR/GBP – Hold short entered at 0.8930
EUR/GBP - 0.8931
Original strategy :
Sold at 0.8930, Target: 0.8750, Stop: 0.8970
Position : - Short at 0.8930
Target : - 0.8750
Stop : - 0.8970
New strategy :
Hold short at 0.8930, Target: 0.8750, Stop: 0.8970
Position : - Short at 0.8930
Target : - 0.8750
Stop : - 0.8970
As the single currency faltered below indicated resistance at 0.8970 and has retreated, retaining our bearish view and as long as this level holds, prospect of another retreat remains, below support at 0.8850 would signal top is formed, bring further fall to 0.8820-25 but break of 0.8800-05 is needed to signal the rebound from last month’s low at 0.8746 has ended, then subsequent decline to 0.8770 would follow.
In view of this, we are holding on to our short position entered at 0.8930. Above said resistance at 0.8970 would signal the rise from 0.8746 low is still in progress for retracement of early decline to psychological resistance at 0.9000 but reckon previous resistance at 0.9048 would remain intact.
Our preferred count is that, after forming a major top at 0.9805 (wave V), (A)-(B)-(C) correction is unfolding with (A) leg ended at 0.8400 (A: 0.8637, B: 0.9491 and 5-waver C ended at 0.8400. Wave (B) has ended at 0.9413 and impulsive wave (C) has either ended at 0.8067 or may extend one more fall to 0.8000 before prospect of another rally. Current breach of indicated resistance at 0.9043 confirms our view that the (C) leg has ended and bring stronger rebound towards 0.9150/54, then towards 0.9240/50.