
Sample Category Title
USD/JPY Daily Outlook
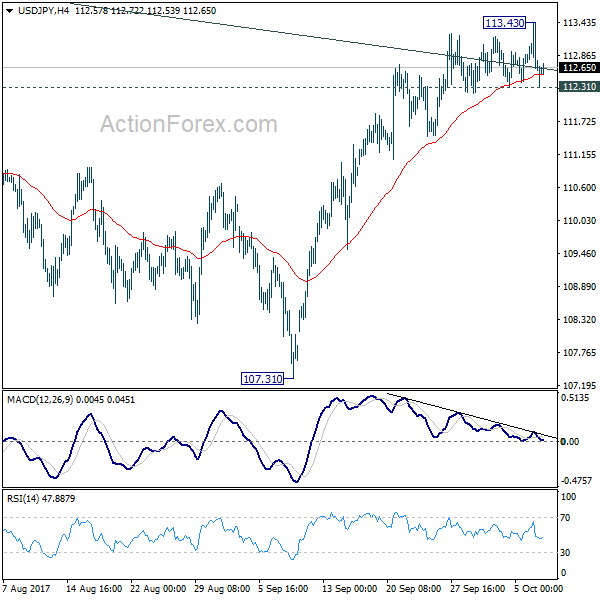
Daily Pivots: (S1) 112.34; (P) 112.88; (R1) 113.17; More....
Intraday bias in USD/JPY remains neutral at this point. On the upside, break of 113.43 and sustained trading above the channel resistance will argue that correction from 118.65 is already completed with three waves down to 107.31. Break of 114.49 will confirm this bullish case and target a test on 118.65 next. On the downside, considering bearish divergence condition in 4 hour MACD, break of 112.31 will suggest rejection from the channel resistance and turn bias back to the downside.
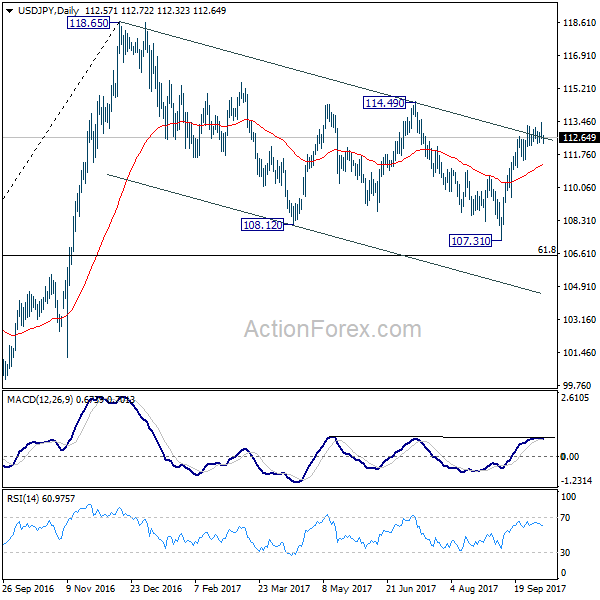
In the bigger picture, rise from 98.97 (2016 low) is seen as the second leg of the corrective pattern from 125.85 (2015 high). It's unclear whether this this second leg has completed at 118.65 or not. But medium term outlook will be mildly bearish as long as 114.49 resistance holds. And, there is prospect of breaking 98.97 ahead. Meanwhile, break of 114.49 will bring retest of 125.85 high. But even in that case, we don't expect a break there on first attempt.
AUD/USD Daily Outlook
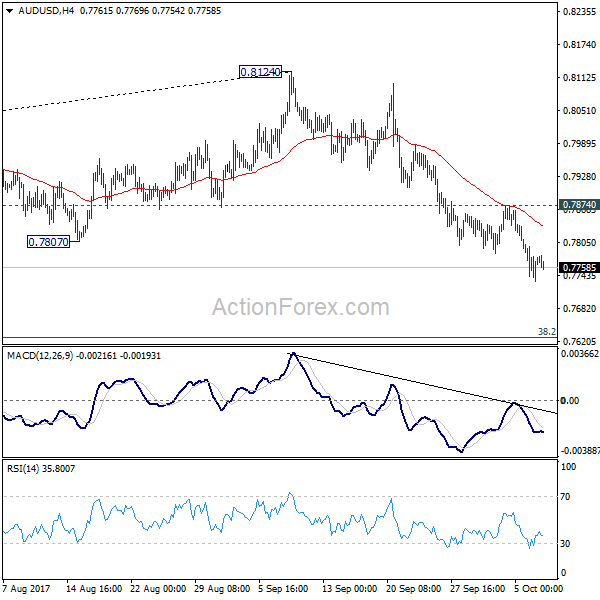
Daily Pivots: (S1) 0.7739; (P) 0.7768; (R1) 0.7804; More...
Intraday bias in AUD/USD remains on the downside as fall from 0.8124 is still in progress. As noted before, rise from 0.7382 is possibly completed at 0.8124 already. Deeper decline would be seen to medium term fibonacci level at 0.7628 first. Decisive break there will target 0.7328 key cluster support. On the upside, break of 0.7874 minor resistance is need to indicate completion of the decline. Otherwise, outlook will now be cautiously bearish.
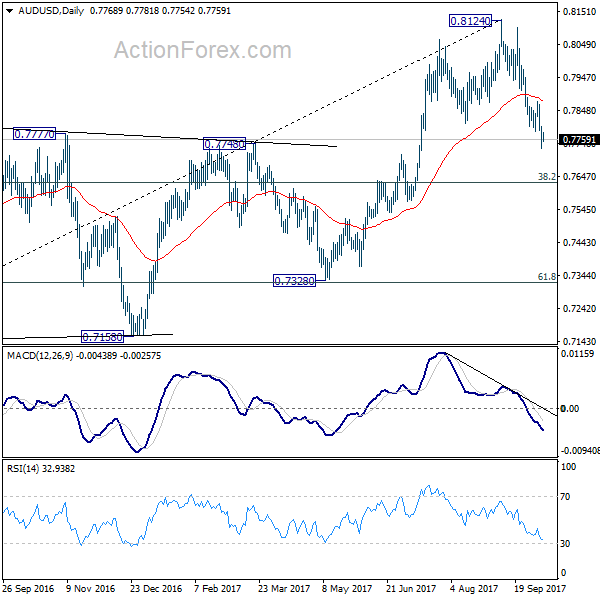
In the bigger picture, rise from 0.6826 medium term bottom is seen as corrective pattern. Current development suggests that it might be completed with three waves up to 0.8124 already. Break of 38.2% retracement of 0.6826 to 0.8124 at 0.7628 will firm this bearish case. And, decisive break of 0.7328 key cluster support (61.8% retracement at 0.7322) will confirm and bring retest of 0.6826 low. In case rise from 0.6826 resumes and extends, strong resistance should be seen at 38.2% retracement of 1.1079 to 0.6826 at 0.8451 to limit upside.
EURUSD Analysis: Breaks Upwards
In result of a decrease of the American unemployment rate, traders tried to push the pair through the bottom trend-line of a large falling wedge pattern. However, it made a rebound and in the early Monday morning left the formation in the northern direction. The surge was not sharp, as the pair still needs to cross a combination of the upper edge of a junior descending channel and the 200-hour SMA. In addition to that, it stuck near the updated weekly PP at 1.1740 that is backed up by the 100-hour SMA. These obstacles as well as the Friday’s jump by 34 basis points just in hour suggest that the rate is likely to retreat for some time. An aggregate of technical indicators support this scenario. In addition to that, market sentiment remains 57% bearish.
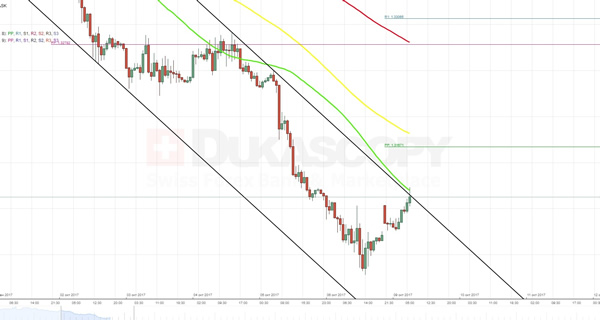
GBPUSD Analysis: Tries To Cross 55-Hour SMA
Despite the release of better that expected American income data, the Greenback failed to exploit this fundamental background and eventually depreciated against the Pound. At the moment, the pair is going to start testing a combined resistance set up by the upper trend-line of a recently formed descending channel and the 55-hour SMA. As majority of traders remain bullish, the rate might briefly sneak to the top, trying to reach the 38.2% Fibonacci retracement level at 1.3145. However, an aggregate of technical indicators points out on the further downfall of the rate via sending strong sell signal. This direction seems evident also from larger perspective, as a couple of weeks ago the pair made a rebound from the upper boundary of a long-term descending channel.
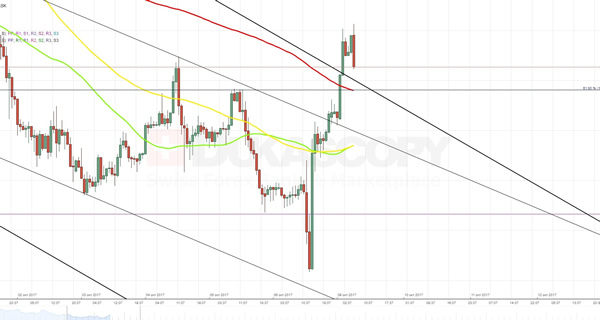
USDJPY Analysis: Down 0.6% Amid Growing Trump & Kim Rhetoric
In line with expectations, the currency rate continued to climb to the top, trying to reach the upper line of an ascending triangle pattern, another escalation of the North Korean crisis led to fall of the rate by 68 basis points just in two hours. Accordingly, in the beginning of this trading session the currency rate found itself not only below the updated weekly PP at 112.81 but also the 55-, 100- and 200-hour SMAs. This combined resistance suggests that the pair will be forced to continue to fall. The fact that the closest southern barrier is located only at the 112.20 mark supports the above assumption. On the other hand, as soon as markets will come down, the Dollar is going to start to gradually recover against the Yen.
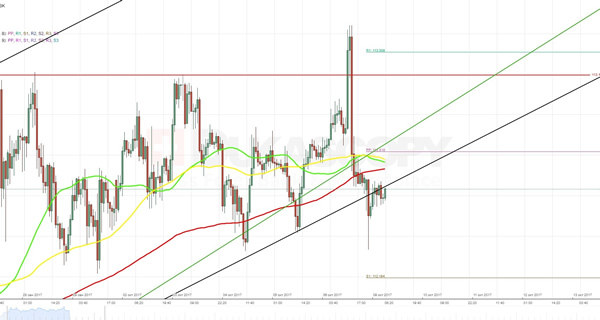
XAUUSD Analysis: Surges By 1.8%
Due to another round of heated rhetoric between Trump and Kim, the gold appreciated against the buck by 0.93% just in one hour and then continued the surge. As a result, the pair started new trading session above the 200-hour and the 61.8% Fibonacci retracement level, which previously formed strong resistance. On the one hand, the rate could continue the soar and try to reach the 1,290.00 mark, using a barrier-free area in its favour. This assumption is additionally supported by the fact that fears over war on the Korean peninsula haven’t gone anywhere yet. On the other hand, after such sudden and massive loss, the buck traders inevitably are going to try to restore lost positions. There is a need to remember that the pair is still expected to reach the bottom edge of dominant channel up.
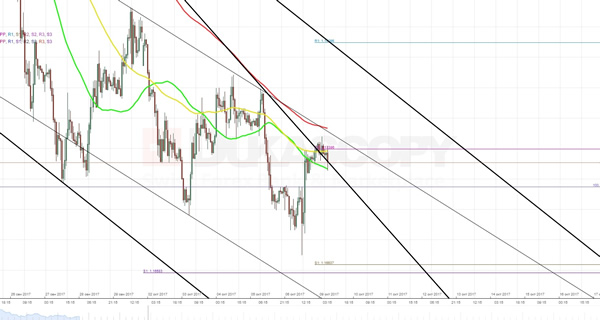
EUR/USD Could Drop Again From The Confluence Zone
The U.S. Economy lost approximately 33k jobs in September according to latest NFP report. The unemployment rate dropped 0.2% to 4.2%, while wages jumped 0.5%. Worse than expected NFP result was primarily due to hurricanes on the U.S. coast and in my opinion, it doesn't reflect the USD weakness at all as the prior jobs and wages were both revised higher.
The EUR/USD is undergoing a retracement from the drop that tested W L4 -1.1674 -1.1654 zone. POC 1.1745-65 (order block, 88.6, D H3, atr pivot, PPR channel top, historical sellers) could reject the price and as long as the pair is below 1.1780 we might see another retest of 1.1674-54 zone. Strong marubozu candle or 4h close below 1.1711 - red trend line, might bring a continuation move towards the 1.1674 and 1.1654 zone.
W H3 - Weekly Camarilla Pivot (Weekly Interim Resistance)
W H4 - Weekly Camarilla Pivot (Strong Weekly Resistance)
D H4 - Daily Camarilla Pivot (Very Strong Daily Resistance)
D L3 – Daily Camarilla Pivot (Daily Support)
D L4 – Daily H4 Camarilla (Very Strong Daily Support)
PPR - Progressive Polynomial Channel
POC - Point Of Confluence (The zone where we expect price to react aka entry zone)
Technical Outlook: GBPUSD – Limited Recovery Action Keeps Overall Bearish Bias Intact
Cable is standing at the front foot in early Monday's trading and probes above broken Fibo 61.8% support at 1.3110 on extension of recovery from Friday's low at 1.3026. Gap-higher opening on Monday and probe above 1.3110 handle is bullish signal, but near-term action was so far capped by 55SMA/base of falling hourly cloud at 1.3129. Limited recovery is expected while 55SMA caps, with fresh attempts towards targets at 1.3016/00 (100SMA/psychological support) seen likely after bearish signal was generated on Friday's close below 1.3110 (Fibo 61.8% of 1.2773/1.3655 rally). Fresh downside action could be also attracted by thin daily cloud which twisted on Friday, with break below 1.3000 to look for final push towards key short-term support at 1.2773 (24 Aug low/200SMA). Conversely, sustained break above 55SMA would spark extension of corrective action from 1.3026 towards hourly cloud top at 1.3175 and falling daily Tenkan-sen at 1.3243, in extension.
Res: 1.3129, 1.3175, 1.3200, 1.3243
Sup: 1.3074, 1.3026, 1.3016, 1.3000
USD/CAD Daily Outlook
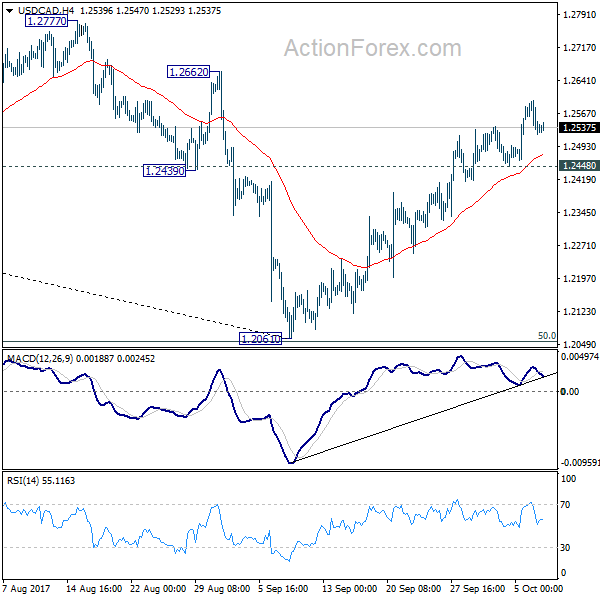
Daily Pivots: (S1) 1.2489; (P) 1.2537; (R1) 1.2612; More....
Further rise is expected in USD/CAD with 1.2448 minor support intact even though upside momentum isn't convincing. Rally from 1.2061 would target 1.2777 resistance first. Decisive break there will target key medium term fibonacci level at target 38.2% retracement of 1.4689 to 1.2061 at 1.3065. On the downside, break of 1.2448 will indicate short term topping and turn bias back to the downside.
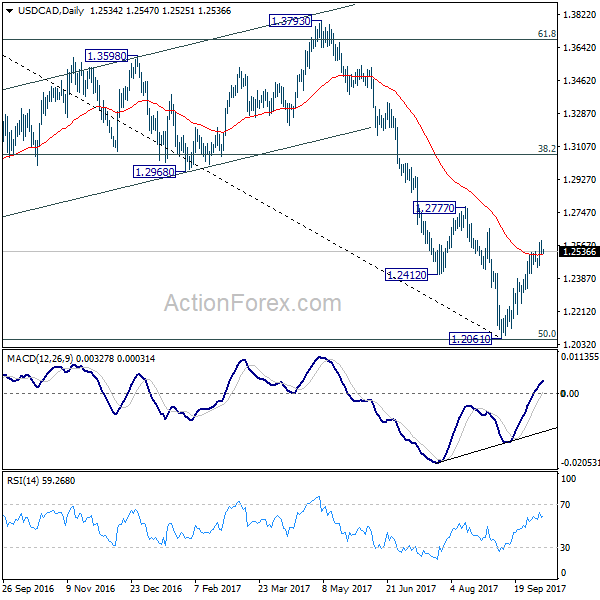
In the bigger picture, USD/CAD should have defended 50% retracement of 0.9406 (2011 low) to 1.4869 (2016 high) at 1.2048. And with 1.2048 intact, we'd favor the case that fall from 1.4689 is a correction. Break of 1.2777 will further affirm this bullish case. That is, larger up trend from 0.9406 is not completed. And in that case, USD/CAD should target 1.3793 resistance next. However, on the other hand, firm break of 1.2048 will indicate that fall from 1.4689 is at least a medium term down trend and should target 61.8% retracement at 1.1424 and below.
Dollar Regains Some Ground in Quiet Trading, FOMC Minutes and US CPI to Watch ahead
Dollar regains some ground as another week starts, rather quietly. Trading could be subdued with US and Canada on Columbus Day holiday today. The greenback weaken before the weekly close last Friday on news that North Korea is preparing to strike another missile that could reach as far as the West Coast of the US. President Donald Trump tweeted again during the weekend, saying that with "agreements violated before the ink was dry, makings fools of U.S. negotiators. Sorry, but only one thing will work!" But Trump didn't go on to explain what is that "only one thing". Last Thursday, Trump also told reporters that a gathering of top military officials represented the "calm before the storm" And he refused to elaborate after be asked to. But judging from the reactions from the markets today, no one will care what those words means unless the intentions are spelt out clearly.
Merkel made a step towards coalition
In Germany, Chancellor Angela Merkel made a step forward on forming a coalition during the weekend. Her party Christian Democrats reached an agreement with sister party Christian Social Union regarding migrants and refugees. While CSU has been calling for a cap on migrants, Merkel has been rejecting that clearly. but after seven hours of talks on Sunday, it's agreed that a maximum of 200,000 people will still be taken to the country on humanitarian reasons. Those eligible include "refugees and asylum seekers, those entitled to subsidiary protection, family members, relocation and resettlement minus deportations and voluntary departures of future refugees". There was no detail regarding Europe and pensions but the conclusions would likely be revealed at a press conference today. Merkel would now be ready to move on the more difficult task of negotiation with pro-business Free Democrats and the Greens. Huge differences are present between these parties from taxes to energy.
Thousands protested for unity in Catalonia
Thousands of people protested in Catalonia on Sunday, calling for unity and expressed their opposition to independence. Barcelona police estimated that there were 350,000 people attended. The organizer estimated there were 930,000. Catalan President Carles Puigdemont will address the regional parliament on Tuesday evening. It's unsure whether he will declare independence as planned. But the scale of the pro-unity protest could give him some pressure to drop that declaration. However, the Spanish government is not doing much to ease the tension and resolve the standoff. Instead, Spanish Prime Minister Mariano Rajoy warned that he could trigger article 155 of the constitution and dismiss the Catalonia government, and call fresh local elections.
May hinted at cabinet reshuffle
In UK, troubled Prime Minister Theresa May hinted that she could reshuffle the cabinet to demote Foreign Minister Boris Johnson. May said that in a newspaper interview that "I'm the PM and part of my job is to make sure I always have the best people in my cabinet, to make the most of the wealth of talent available in the party." That is seen as directed to Johnson who is constantly undermining May's authority. May could hit the button as soon as the EU summit on October 19/20 completes. Meanwhile, May will be meeting with business leaders to hear what they want regarding relationship with EU after Brexit. Justice Minister Dominic Raab said that UK should "prepare for all eventualities" about Brexit negotiation and "no deal" preparations are in place.
China services PMI dropped
As the Chinese market reopens after a week-long National Day's holiday, we have got the latest report of the Caixin/Markit services PMI which fell to 50.6 in September, from 52.7 a month ago. This marks the lowest reading since December 2015. The composite output Index, encompassing both manufacturing and services activities) dropped -1 point to 51.4 last month, the weakest since June. As the agency noted, "the Chinese economy generally held up well in the third quarter. However, the expansion in both manufacturing and services cooled in September, suggesting downward pressure on economic growth may re-emerge in the fourth quarter".
Looking ahead...
Developments in Catalonia, UK and the verbal exchanges between Trump and North Korean Leader Kim will be watched for sure. A number of central bank officials are also scheduled to speak this week. In addition, Fed will release the minutes for its September meeting on Wednesday. The September CPI report would be due Friday. UK productions will also be watched. Here are some highlights:
- Tuesday: Australia NAB business confidence; Swiss unemployment rate; German trade balance; UK industrial and manufacturing production, trade balance; Canada housing starts and building permits;
- Wednesday: Australia consumer sentiment; Japan machine orders; FOMC minutes
- Thursday: Australia home loans; Japan PPI, tertiary industry index; Eurozone industrial production; US PPI, jobless claims
- Friday: New Zealand business NZ manufacturing; China trade balance; German CPI final; Swiss PPI; US CPI, retail sales, U of Michigan sentiment
USD/CAD Daily Outlook
Daily Pivots: (S1) 1.2489; (P) 1.2537; (R1) 1.2612; More....
Further rise is expected in USD/CAD with 1.2448 minor support intact even though upside momentum isn't convincing. Rally from 1.2061 would target 1.2777 resistance first. Decisive break there will target key medium term fibonacci level at target 38.2% retracement of 1.4689 to 1.2061 at 1.3065. On the downside, break of 1.2448 will indicate short term topping and turn bias back to the downside.
In the bigger picture, USD/CAD should have defended 50% retracement of 0.9406 (2011 low) to 1.4869 (2016 high) at 1.2048. And with 1.2048 intact, we'd favor the case that fall from 1.4689 is a correction. Break of 1.2777 will further affirm this bullish case. That is, larger up trend from 0.9406 is not completed. And in that case, USD/CAD should target 1.3793 resistance next. However, on the other hand, firm break of 1.2048 will indicate that fall from 1.4689 is at least a medium term down trend and should target 61.8% retracement at 1.1424 and below.
Economic Indicators Update
| GMT | Ccy | Events | Actual | Forecast | Previous | Revised |
|---|---|---|---|---|---|---|
| 1:45 | CNY | Caixin PMI Services Sep | 50.6 | 53.1 | 52.7 | |
| 6:00 | EUR | German Industrial Production M/M Aug | 2.60% | 0.90% | 0.00% | -0.10% |
| 8:30 | EUR | Eurozone Sentix Investor Confidence Oct | 29.7 | 28.5 | 28.2 |