
Sample Category Title
GBPUSD Intraday Analysis
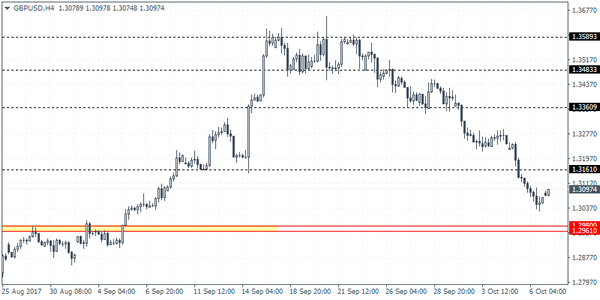
GBPUSD (1.3097): GBPUSD was seen extending the declines as price action fell to the initial support level of 1.3033. However, the interaction with this support level was brief as price pulled away from the support. On the 4-hour chart we can expect the declines to continue towards the support level at 1.2900. In the near term there is potential for GBPUSD to test the resistance level at 1.3161. A reversal at this level could see renewed declines in the cable. However, if GBPUSD manages to close above 1.3161, then price action could be seen rising to the next resistance level of 1.3360.
EURUSD Intraday Analysis
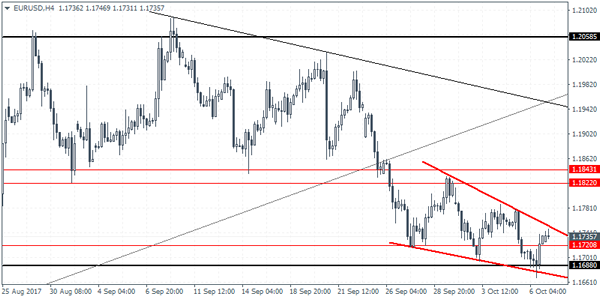
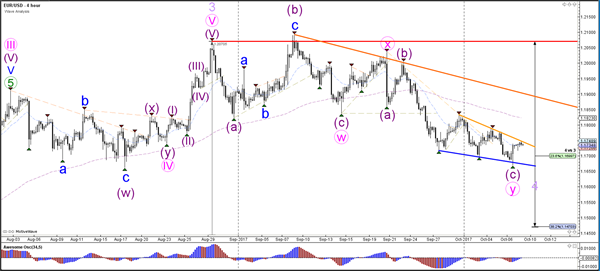
EURUSD (1.1735): The EURUSD closed bullish on Friday with price action bouncing off the support level at 1.1688. The consolidation continues within the descending wedge pattern which comes after a brief spell of declines. A breakout from this descending wedge pattern will signal an upside correction in EURUSD. Support is now seen at 1.1720 and resistance is seen at 1.1822. The bias will shift to the upside in the event that EURUSD manages to close above the resistance zone of 1.1843 - 1.1822. In this case, EURUSD could set up for further gains to the upside towards 1.20085 where the next resistance level exists. However, for the moment, we expect EURUSD to remain within the mentioned support and resistance levels in a sideways range.
Dollar Gives Up Gains Late Friday. NZ Election Results Inconclusive
The U.S. dollar was seen giving up its gains late Friday after the payrolls report showed that the US economy lost 33k jobs in September. The data remains distorted on account of the hurricanes, which also led to the unemployment rate falling to new lows alongside an increase in wages.
Over the weekend, the New Zealand election results were released. However the results were inconclusive which leaves the top two parties; Labor and Greens scrambling to build a coalition government. The NZ First, a populist party has emerged as the king-maker as a result.
Looking ahead, the US, Canadian and Tokyo markets are closed. Economic data today will be focusing on the industrial production data from Germany.
Forex: US Unemployment At Lowest Level Since 2001
On Friday, the US Department of Labour released Nonfarm Payrolls for September. The meagre forecast of 88K was beaten with an even worse release of -33K, showing the US lost 33K jobs from the previous release. This is the first negative NFP since September 2010, as the recent Hurricanes impacted jobs in the leisure and hospitality sector. With the rebuilding effort fully underway, the markets expect NFP to increase in the coming months as workers are hired with businesses reopening and tourism improving. The markets had expected the Hurricanes to impact NFP, but not to such an extent. A more positive one followed, the release of US Unemployment which, at 4.2%, is the lowest rate since February 2001.
More positive data from the US was released showing US average hourly earnings rose to an annual pace of 2.9% in September, an improvement on the August release of 2.7%. It has been well documented that the Fed has been eager to see higher levels of earnings growth, which had been missing as employment grew. With such an improvement in average hourly earnings, that should help push inflation higher, this will provide additional impetus for the Fed to hike rates, for the third time this year, in December.
The markets are concerned about news from Russia’s RIA News Agency that North Korea is preparing to test a long-range missile which it believes can reach the west coast of the US. With renewed tensions between North Korea and the US, the markets have moved into safe havens – buying JPY and Gold in early Monday trading.
EURUSD is little changed since Friday’s close, currently trading around 1.1730.
USDJPY is currently trading around 112.62.
GBPUSD has recovered from Friday’s lows to currently trade around 1.3105.
Gold has moved 0.5% higher from Friday to currently trade around $1,282.25.
WTI is 0.4% higher in early Monday trading. Currently, WTI is trading around $49.70.
Today, several markets have National Holidays: Columbus Day in the US, Health Sports Day in Japan and Canadian Thanksgiving, therefore there are no noticeable, high impact, economic data releases for Monday.
Currencies: Dollar Fails To Extend Gains Post Payrolls
Sunrise Market Commentary
- Rates: Core bonds prone for some consolidation/correction?
The absence of US investors and second tier eco calendar suggests a slow start to the trading week. A failed test of key yield resistance levels and the geopolitical context suggests that core bonds are prone for some consolidation/correction higher despite a rather heavy EMU/US supply calendar this week. - Currencies: Dollar fails to extend gains post payrolls
On Friday, the dollar temporary profited from a decline in the unemployment rate and higher wages, but the gains evaporated soon. Key technical USD resistance stayed out of reach. Today, the calendar is uneventful. USD trading will probably be order-driven. Geo-political risk remains a wildcard.
The Sunrise Headlines
- US stock markets recorded minor losses on Friday after a record-smashing week. Most Asian stock markets are positively oriented overnight with China outperforming (catch-up move after last week's holidays) and Japan closed.
- German Chancellor Merkel's Christian Democrats (CDU) reached a deal on migrant policy with her conservative Bavarian allies (CSU), removing a major obstacle to pursuing talks on a coalition with other parties.
- The US and Turkey each suspended visa services for citizens looking to visit the other country, a sharp escalation of a diplomatic spat that sent the lira down. EUR/TRY currently trades around 4.35, the highest level on record.
- Wolfgang Schäuble has warned that spiralling levels of global debt and liquidity present a major risk to the world economy, in his parting shot as Germany's finance minister.
- The kiwi dollar (NZD/USD < 0.71) slumped to a four-month low after final election results showed the two main political parties are each in a position to form a viable coalition government.
- OPEC and other oil producers may need to take "some extraordinary measures" next year to rebalance the oil market, the OPEC secretary-general said. OPEC meets next on November 30 in Vienna.
- Today's eco calendar is empty apart from German production data. US markets are closed for Columbus day. September Chinese Caixin PMI's declined this morning (services from 52.4 to 51.4 and composite from 52.7 to 50.6).
Currencies: Dollar Fails To Extend Gains Post Payrolls
Dollar doesn't profit from distorted US payrolls
September US payrolls were distorted by the hurricanes, resulting in a decline in September job growth. However, the lower unemployment rate (4.2%) and a rise in average hourly earnings suggested a further improvement in labour market conditions. US yields and the dollar rose temporary on Friday, but gains evaporated on rumours that North Korea was considering military action. Cautiousness prevailed ahead of the long weekend in the US. The dollar reversed the initial gains. EUR/USD closed the session at 1.1730. USD/JPY finished the week at 112.65. The dollar rally again failed to make any sustained progress.
Several Asian markets are closed this morning including Japan, Taiwan and Korea. Chinese markets show solid gains between 1% and 2% after reopening from the Golden week holidays. Political tensions remain in the headlines. Turkey and the US suspended visa services for visitors who intend to visit the other country. The incident hammered the Turkish lira, but the impact on global markets is limited. The same is true regarding ongoing tensions on North Korea. USD/JPY trades in the 112.60 area and EUR/USD around 1.1735, little changed from Friday's close. Political uncertainty in New-Zealand persists and continues to pressure the kiwi dollar. NZD/USD trades in the 0.7075 area.
US markets are closed for Columbus day. In the EMU only the French business sentiment survey (BdF) and the Sentix investor sentiment survey are released, which are no market movers. Later this week, the EMU calendar remains unattractive. In the US the focus is on Friday when the September CPI (inflation), retail sales and October Michigan consumer confidence will be released. Inflation likely increased. We are especially looking to the core inflation, which showed signs of bottoming out in August. Retail sales are expected strong and we see few reasons why consumer sentiment should have declined from cycle highs.
This combination, if confirmed, could galvanise expectations that the Fed will increase rates in December and during 2018. Central bank speakers are again plentiful. The crucial ECB meeting is coming closer and the debate inside the ECB on the APP may gradually come to conclusions. So, it is possible that more details will be revealed (eg last week's Minutes. Today, USD trading will probably be order driven and technical in nature. (Geo)political risk is a wildcard (North Korea, Turkey, Catalonia). Recently, the euro showed quite some resilience against this kind of event risk.
From a technical point of view, EUR/USD dropped below the 1.1823/ 1.2070 consolidation pattern. The USD rebound develops very slowly, but the pair holds below the 1.1823 previous range bottom. Higher US yields are needed to support additional USD gains. Next support in EUR/USD comes in at 1.1662, while 1.1423 marks the 38% retracement from the 2017 rally. EUR/USD is captured in a cautious sell-on-upticks pattern. The USD/JPY momentum was constructive of late, but for an important part due to yen weakness. USD sentiment recently improved though. USD/JPY regained 110.67/95 (previous resistance), a short-term positive. The 114.49 correction top is the next important resistance. The rally lost momentum last week. So a break beyond 114.49 probably is not evident.
EUR/USD no real test of the 1.1662 support after Friday's US payrolls
EUR/GBP
Sterling sell-off to slow temporary?
Sterling remained in the defensive on Friday even as there was no high profile negative news. Lingering uncertainty on the political fate of PM May and the lasting stalemate in the Brexit negotiations continued to haunt the UK currency. Sterling especially remained under pressure against the euro. EUR/GBP closed the session at 0.8981 (from 0.8927). Cable regained slightly ground as the dollar couldn't maintain the post-payroll uptick. The pair closed the session at 1.3066 (from 1.3119).
Sterling trades slightly higher in thin Asian trading this morning. BRC indicated that consumer spending probably declined again in September. BRC also warned on further price rises. On the UK political scene, it looks that UK PM May can stay in place at least for now. In a statement, she tried to put the ball in the camp of the EU. The declining risk of May resigning might be a temporary positive for sterling, or at least slow the recent decline. However, much more is needed for a sustained sterling comeback.
EUR/GBP staged a strong uptrend since April to set a top at 0.9307 late August. UK price data amended the dynamics and hawkish BoE comments reinforced a sterling rebound. Medium term, we maintain a EUR/GBP buy-on-dips approach as we expect the mix of euro strength and sterling softness to persist. The prospect of (limited) withdrawal of BOE stimulus triggered a good sterling countermove. However, this rebound has apparently run its course. EUR/GBP supports at 0.8743 and 0.8652 are probably difficult to break. We look to buy EUR/GBP on dips. Last week's rebound above the 0.89 area improved the ST technical picture of EUR/GBP. EUR/GBP 0.9026 is the 50% retracement of the recent countermove.
EUR/GBP extends rally north of 0.89
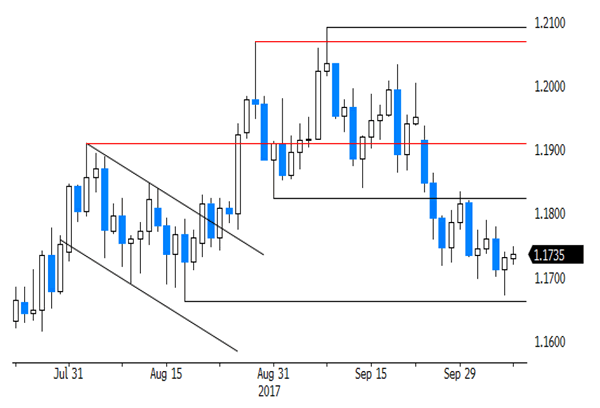
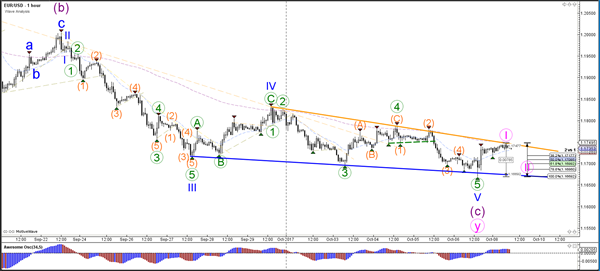
Daily Wave Analysis: EUR/USD Falling Wedge At 23.6% Fib Indicates Potential Bullish Reversal
Currency pair EUR/USD
The EUR/USD is building a falling wedge chart pattern (blue/orange lines), which could indicate a bullish reversal. A bearish breakout below support (blue) and the 23.6% Fibonacci level of wave 4 (blue) could see price fall towards the 38.2% Fibonacci level near 1.15 whereas a bullish breakout could see price test the next resistance (orange line).
The EUR/USD direction depends on the breakout of the pattern which is indicated by the trend lines. A potential wave 1-2 (pink) might occur if price stays above the bottom (100% level)
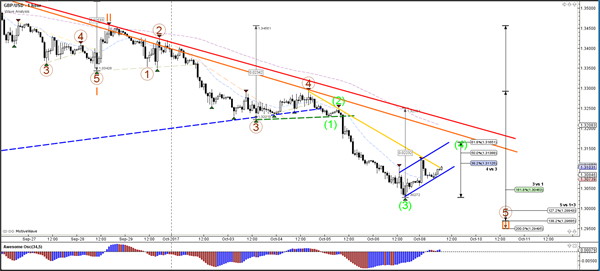
Currency pair GBP/USD
The GBP/USD is in a downtrend channel (red line) and could be building a larger wave C or 3 (green).
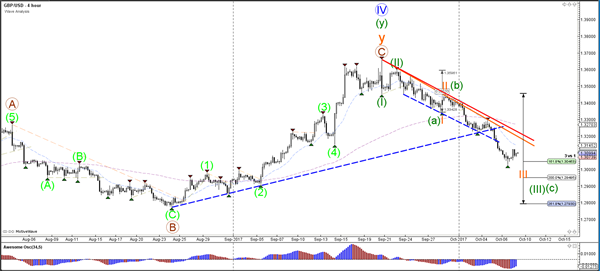
The GBP/USD could be building a wave 4 (light green) correction within wave 3 (orange). A break above the 61.8% Fibonacci level of wave 4 vs 3 makes the wave 4 less likely.
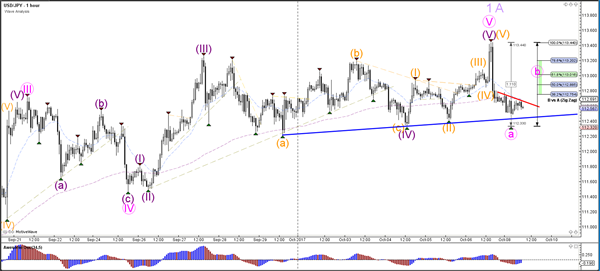
Currency pair USD/JPY
The USD/JPY is in a sideways range, which is indicated by the support (blue) and resistance (red) trend lines. A bearish breakout could indicate a retracement towards the Fibonacci levels of wave 2 or B (purple).
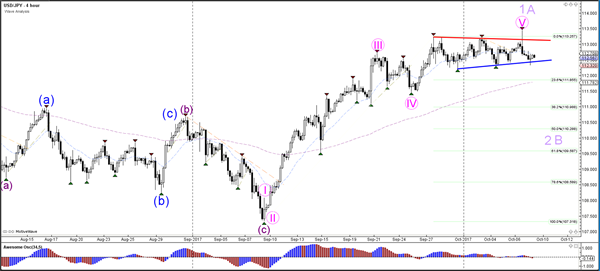
The USD/JPY could be building a potential ABC (pink) correction.
Market Update – Asian Session: China Services PMI Hits 21-Month Low
Asia Summary
After being closed for holiday last week, the Shanghai Composite resumed trading higher by over 1.5%, amid strength seen in the property and banking sectors. Australia's ASX 200 index has gained over 0.5%. Equity markets in Japan, South Korea and Taiwan are closed in observance of holidays. South Korean markets are due to resume trading on Tuesday. There was no reported military activity out of North Korea over the weekend.
In Australian M&A, hotel services company Mantra Group received a A$1.2B bid from France's Accor. Engineering services firm Worleyparsons agreed to a total consideration of £228M to acquire a majority stake in AFW UK Oil & Gas, which is the oil and gas unit of Amec Foster Wheeler. Meanwhile, almond producer, Select Harvest, rejected a A$430.6M bid from Mubadala.
On the macro front, China's Sept Caixin Services PMI hit a 21-month low, and the initial impact on markets has been muted. Government think tank, China Academy of Social Services (CASS) reiterated that it saw Q4 GDP growth around 6.7%. It also sees 2017 GDP growth at ~6.7%, after suggesting 6.8% in late July. China's official 2017 GDP growth forecast is around 6.5%.
The PBoC skipped today's open market operation. There has also been speculation that the PBoC is gauging bank demand for a medium-term lending facility (MLF), as CNY404B related to prior central bank operations is expected to mature this week.
With the US equity markets closed for holiday on Monday, various energy companies, including Shell and Phillips 66, announced plans to start resuming their operations, as Nate was downgraded to a tropical depression earlier on Sunday. According to the US Bureau of Safety and Environment (BSEE) there have been no reports of damage to offshore oil facilities as of Sunday afternoon. Also, the US Coast Guard said it reopened the Port of New Orleans. US government bond markets are open for trading.
The Turkish Lira (TRY) has declined by over 4%, as Turkey's government suspended non-immigrant visa services for US citizens. The move followed, the US government suspending non-immigrant visa services in Turkey, after the arrest of a US consulate employee in Istanbul, in relation to Muslim leader Fethullah Gulen.
On Sunday in Spain, an estimated 350K people were said to have gathered in Catalonia capital, Barcelona, for protests related to opposition for declaring independence from Spain. Spanish companies Abertis and Colonial are reported to be planning to hold board meetings on Monday to discuss whether to move their headquarters from Catalonia.
Key economic data
(CN) CHINA SEPT CAIXIN SERVICES PMI: 50.6 V 52.7 PRIOR (21-month low); COMPOSITE: 51.4 V 52.4 PRIOR
Speakers and Press
China
(CN) Shanghai Composite +1.6% at 3,403 after being closed last week for holiday
(CN) China PBOC said to poll banks demand for medium-term lending facility (MLF) loans, expected to issue these loans on Friday – financial press
(HK) Macau Oct 8 China Visitor Arrivals +32% y/y; Oct 1-8 China Visitor Arrivals +11% y/y
(CN) China National Day Holiday Tourism Income CNY583.6B, +13.9% y/y; Number of tourists 705M, +11.9% y/y
(CN) China CFLP Sept Logistics Business Volume Index: 54.3 v 53.5 prior
(CN) China said to seek to have 600K new energy vehicles by 2020 – Chinese Press
Other
(AU) Senator Xenophon (independent) says he is still opposed to the bank tax proposed by South Australia – Australia Press
(ES) On Sunday, hundreds of thousands of people were reported to have gathered in Catalonia capital Barcelona for protests related to opposition for declaring independence from Spain – financial press
(TW) Taiwan may extend same-day trading tax cut for 2-years – Taiwanese Press
(US) House Speaker Ryan: Tax reform is on track for implementation by Jan 1st, 2018
(US) In list of new immigration principles, the White House calls on Congress to ensure funding for US/Mexico border wall – US financial press
(US) Fed's Rosengren (moderate, non-voter): Fed has to respond to very tight labor markets or may damage the economy - comments from Montreal
Asian Equity Indices/Futures (00:30ET)
Nikkei closed, Hang Seng -0.3%, Shanghai Composite +1.2%, ASX200 +0.6%, Kospi closed
Equity Futures: S&P500 +0.1% ; Nasdaq +0.2% , Dax +0.1% , FTSE100 -0.1%
FX ranges/Commodities/Fixed Income (00:30ET)
EUR 1.1730-1.1747; JPY 112.33-112.68; AUD 0.7765-0.7782; NZD 0.7059-0.7080
Aug Gold +0.8% at 1,285/oz; Aug Crude Oil +0.4% at $49.48/brl; Sept Copper flat at $3.024/lb
GLD SPDR Gold Trust ETF daily holdings +0.4% to 854 metric tons
(CN) CHINA PBOC SET YUAN REFERENCE RATE AT 6.6493 V 6.6369** PRIOR
(CN) PBOC OMO: TO SKIP OMO; net drain CNY180B
US markets on close: Dow flat, S&P500 -0.1%, Nasdaq +0.1%, Russell -0.3%
Best Sector in S&P500: Technology +0.2%
Worst Sector in S&P500: Consumer Staples -1%
At the close: VIX 9.65 (+0.46 pts); Treasuries: 2-yr 1.508% (+1.5bps), 10-yr 2.361% (+1bp), 30-yr 2.896% (flat)
US Market Summary
Equity markets ran up yet again last week to fresh highs before Friday's September employment report induced some minimal profit taking. Outside of Friday's jobs numbers the economic data remained unambiguously strong; headlined by the highest ISM non-manufacturing composite since 2005. The September jobs report did suggest wage inflation may be taking hold as unemployment rates continue to dwindle. The figures came on the heels of a plethora of Fed speak which seemed to indicate Fed officials were gaining confidence in their ability pull the trigger and raise rates in December. Rates moved up and Treasury curves steepened while the US Dollar regained some upside momentum. The Pound came under pressure as Brexit concerns, and in particular, the fate of PM May weighed on traders psyche. Spanish stocks weighed on Europe as uncertainty surrounding Catalonia resulted IBEX weakness and a modest widening of peripheral yield spreads. WTI crude futures stumbled, dipping back below $50 and under the 50-day moving average even as another tropical storm, Nate, approached the Gulf of Mexico. Copper prices broke back above the 50-day moving average to the highest levels in more than a month, helped by a dearth of headlines out of China as markets were closed for Golden Week. In Washington DC, Republicans continued to press the case for tax cuts while speculation swirled surrounding the fate of Sec of State Tillerson. Democrats called for renewed gun regulation in the wake of Las Vegas suffering the worst mass shooting in US history. The VIX drifted lower yet again nearing the 9.00 mark midweek and overall stock volumes remained notably soft. For the week the DJIA gained 1.6%, the S&P500 was up 1.2%, and the Nasdaq added 1.5%.
A Long List Of Fed And ECB Speakers Is Also Coming Up
Market movers today
We have only tier-2 data due today with German industrial production and Euro sentix released this morning. After strong German factory orders on Friday, we are likely to be in for a robust print on German industrial production as well. The euro Sentix index is at a high level but we look for a further rise in September, partly reflecting strong equity markets.
During the week, there will be FOMC minutes (Wednesday) and US CPI and retail sales (both Friday). A long list of Fed and ECB speakers is also coming up.
In Scandinavia, it is CPI week with inflation releases in Norway and Denmark on Tuesday and in Sweden on Thursday. Most interesting is Sweden where we estimate an increase to 2.5% in CPIF from 2.3% in August.
Selected market news
Friday's US jobs report showed a spike in average hourly wages which increased 0.5% m/m and 2.9% y/y in September up from 2.7% y/y in August . The unemployment dropped from 4.4% to 4.2% despite a decline in non-farm payrolls of 33,000. While data is probably highly distorted by the recent hurricanes, the strong earnings figure strengthened the case for a December hike in the US, as it supports the Fed's Phillips curve view that it is due to the tight labour market and hence it is appropriate to tighten monetary policy by hiking. The market is now pricing in a December hike with a probability of 76%.
Spain continues to set the tone in the European financial market , and the developments in Catalonia will be in the spot light in the first half of the week. On Saturday, PM Mariano Rajoy said that he would not rule out removing Cat alonia's government and suspending the region's autonomous status (i.e. act ivate art icle 155). Madrid is expected to call for a new local election in that scenario. On Sunday, thousands protested across Spain against Catalan independence with media reports suggesting that more than 350,000 were on the streets in Barcelona representing the ‘Silent Majorit y'. Today, the local government will meet in Catalonia, but focus is on Tuesday where the Catalan leader Puigdemont could declare unilateral independence according to different news sources. According to Diario, Carles Puigdemont 's call for independence could be more modest and conditional on the out come of the next local election.
An escalation of a diplomatic situation between the US and Turkey initially weakened the Turkish lira 6% versus the dollar on Friday, with USD/TRY spiking to the highest level seen since January after the US suspended the processing of new visas in Turkey as a response to the arrest of an US embassy employee by the Turkish government
Aussie Dollar Trading Higher In The Morning Session
For the 24 hours to 23:00 GMT, the AUD declined 0.28% against the USD and closed at 0.7769 on Friday.
LME Copper prices rose 2.0% or $128.0/MT to $6639.0/MT. Aluminium prices declined 0.1% or $2.5/MT to $2121.5/MT.
In the Asian session, at GMT0300, the pair is trading at 0.7777, with the AUD trading 0.1% higher against the USD from Friday's close.
Early morning data indicated that in China, Australia's largest trading partner, the Caixin services PMI index eased to a level of 50.6 in September, hitting its lowest level in nearly two-years, compared to a level of 52.7 in the previous month.
The pair is expected to find support at 0.7744, and a fall through could take it to the next support level of 0.7711. The pair is expected to find its first resistance at 0.7799, and a rise through could take it to the next resistance level of 0.7821.
Looking ahead, Australia's NAB business confidence index for September, slated to release overnight, will be on investors' radar.
The currency pair is showing convergence with its 20 Hr moving average and trading below its 50 Hr moving average.

German Factory Orders Zoomed To An 8-Month High In August
For the 24 hours to 23:00 GMT, the EUR rose 0.19% against the USD and closed at 1.1733 on Friday, after data showed that Germany’s seasonally adjusted factory orders rebounded 3.6% on a monthly basis in August, beating market expectations for a rise of 0.7% and rising by the most in eight months, thus pointing to a solid growth in the nation’s manufacturing sector. In the previous month, factory orders had dropped by a revised 0.4%.
The greenback lost ground against a basket of major currencies on Friday, on the back of worse-than-expected US non-farm payrolls report.
The US non-farm payrolls unexpectedly fell by 33.0K in September, dropping for the first time in seven-years, as the pace of job creation was held down by the severe disruptions caused by a pair of hurricanes. In the prior month, non-farm payrolls had registered a revised gain of 169.0K, while markets had anticipated for a rise of 80.0K.
On the contrary, the nation’s average hourly earnings of all employees rose more-than-anticipated by 0.5% on a monthly basis in September, suggesting that a slack in the nation’s wage growth may be disappearing and boosting the odds of a Federal Reserve interest rate hike by the year-end. Average hourly earnings of all employees posted a revised gain of 0.2% in the prior month, while markets were anticipating for a rise of 0.3%. Moreover, the nation’s unemployment rate unexpectedly declined to 4.2% in September, dipping to a sixteen-year low level, while investors had envisaged the nation’s unemployment rate to remain unchanged at 4.4%.
In other economic news, the US final wholesale inventories rose less than initially estimated by 0.9% on a monthly basis in August, while the preliminary figures had recorded an advance of 1.0% and following a rise of 0.6% in the previous month. Also, the nation’s consumer credit recorded a rise of $13.07 billion in August, falling short of market consensus for an increase of $15.54 billion. Consumer credit had registered a revised rise of $17.72 billion in the previous month.
Losses in the US Dollar were extended after a report that North Korea is preparing to test a long-range missile that could reach the US west coast.
In the Asian session, at GMT0300, the pair is trading at 1.1741, with the EUR trading 0.07% higher against the USD from Friday’s close.
The pair is expected to find support at 1.1691, and a fall through could take it to the next support level of 1.1642. The pair is expected to find its first resistance at 1.1769, and a rise through could take it to the next resistance level of 1.1798.
Going ahead, investors will focus on the Euro-zone’s Sentix investor confidence index for October and Germany’s industrial production data for August, slated to release in a few hours.
The currency pair is trading above its 20 Hr and 50 Hr moving averages.
