Sample Category Title
EUR/USD Candlesticks and Ichimoku Analysis
Weekly
• Last Candlesticks pattern: Shooting star
• Time of formation: 31 Jul 2017
• Trend bias: Near term up
Daily
• Last Candlesticks pattern: Shooting star
• Time of formation: 2 Aug 2017
• Trend bias: Up
EUR/USD – 1.1735
Although the single currency recovered after Friday’s brief fall to 1.1669 and consolidation above this level would be seen and test of the Tenkan-Sen (now at 1.1766) cannot be ruled out, however, a daily close above resistance at 1.1788 is needed to signal low is formed at 1.1669, bring test of 1.1833 resistance, a sustained breach above there would provide confirmation, then a stronger rebound to the Kijun-Sen (now at 1.1881) would follow but reckon upside would be limited to 1.1935-40 and price should falter below resistance at 1.2005, bring another retreat later.
On the downside, below said support at 1.1662-69 would signal the corrective decline from 1.2093 top is still in progress for retracement of recent upmove, hence weakness to the lower Kumo (now at 1.1599) would follow but a sustained breach below there is needed to retain bearishness, bring further fall to 1.1550, then towards 1.1500, having said that, previous support at 1.1479 should limit downside and 1.1466 (50% Fibonacci retracement of 1.0839-1.2093) should hold on first testing.
Recommendation: Buy at 1.1620 for 1.1820 with stop below 1.1520.
On the weekly chart, as euro has recovered after falling to 1.1669 late last week, suggesting consolidation would be seen and recovery to 1.1800 cannot be ruled out, however, reckon upside would be limited to the Tenkan-Sen (now at 1.1878) and resistance at 1.1937 should hold, bring another retreat later, below said support at 1.1669 would signal the retreat from 1.2093 top is still in progress for retracement of recent rise to 1.1610-15 (38.2% Fibonacci retracement of 1.0839-1.2093) where renewed buying interest should emerge and 1.1550 should hold, bring another upmove later. Below 1.1510-20 would defer and risk correction to 1.1460-70 (50% Fibonacci retracement), however, downside should be limited to 1.1400 and the Kijun-Sen (now at 1.1332) should hold.
On the upside, a weekly close above the Tenkan-Sen (now at 1.1878) would risk test of 1.1937 but still reckon resistance area at 1.2005-35 would remain intact, bring another retreat later. Above said resistance area would signal the pullback from 1.2093 has ended, bring retest of 1.2093, break there would extend recent rise from 1.0340 low to 1.2160-70 (50% Fibonacci retracement of 1.3993-1.0340) but loss of upward momentum should limit upside to 1.2220-30 and reckon 1.2300-10 would hold from here, price should falter well below 1.2390-00, bring another retreat later.
USD/JPY Candlesticks and Ichimoku Analysis
Weekly
• Last Candlesticks pattern: Dark cloud cover
• Time of formation: 10 Jul 2017
• Trend bias: Down
Daily
• Last Candlesticks pattern: Evening doji
• Time of formation: 7 Aug 2017
• Trend bias: Down
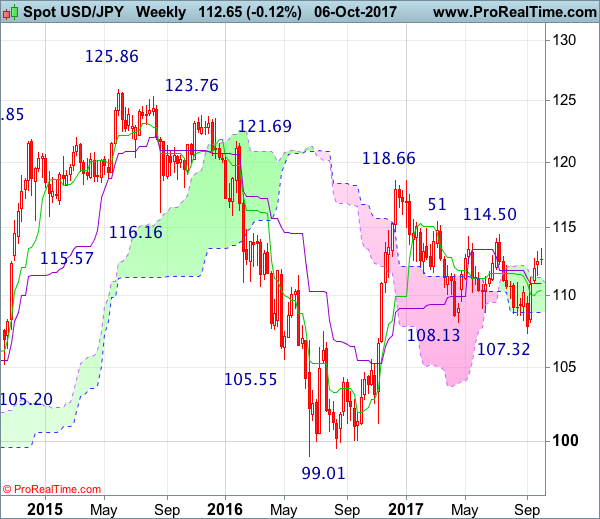
USD/JPY – 112.65
Although the greenback edged higher to 113.44 late last week, the subsequent retreat on Friday suggests consolidation below this level would be seen and test of support at 112.32 cannot be ruled out, however, break of 112.21 is needed to signal a temporary top has been formed, bring retracement of recent rise to another previous support at 111.47 and later towards 111.10-15, having said that, reckon downside would be limited and the Kijun-Sen (now at 110.38) should hold and bring rebound later.
On the upside, expect recovery to be limited to 113.10-15 and bring another retreat, above said resistance at 113.44 (last week’s high) would signal the rise from 107.32 low is still in progress for retracement of recent entire decline from 118.66, then gain to 114.00 and possibly towards 114.30-35 (61.8% Fibonacci retracement of 118.66-107.32) would follow, however, loss of upward momentum should prevent sharp move beyond resistance at 114.50 and price should falter well below 115.00.
Recommendation : Sell at 113.10 for 111.10 with stop above 114.10
On the weekly chart, the greenback moved higher again to 113.44 last week, however, the retreat on Friday formed a doji star with a relatively long upper shadow, suggesting consolidation below this level would be seen and if this week ends with a long black candlestick, this would signal a potential reversal pattern is formed, then weakness to support at 111.47 cannot be ruled out, however, only a weekly close below the Kijun-Sen (now at 110.91) would add credence to this view, bring retracement of recent rise from 107.32 to the Tenkan-Sen (now at 110.38) and then 109.90-95 which is likely to hold from here.
On the upside, whilst recovery to 113.10-15 cannot be ruled out, last week’s high at 113.44 should hold, bring another retreat later. Above said resistance at 113.44 would extend the aforesaid rise from 107.32 to 114.00, then 114.30-35 (61.8% Fibonacci retracement) but resistance at 114.50 should limit upside and psychological level at 115.00 should hold from here, bring retreat later.
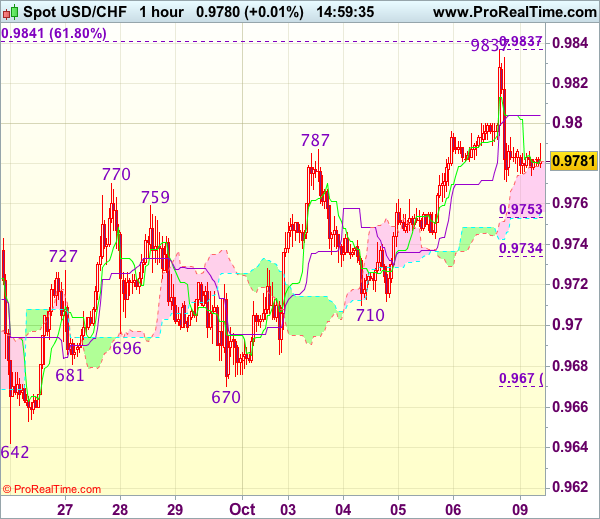
Trade Idea : USD/CHF – Stand aside
USD/CHF - 0.9782
Most recent candlesticks pattern : N/A
Trend : Near term up
Tenkan-Sen level : 0.9782
Kijun-Sen level : 0.9804
Ichimoku cloud top : 0.9781
Ichimoku cloud bottom : 0.9756
Original strategy :
Sold at 0.9705, stopped at 0.9740
Position : - Short at 0.9705
Target : -
Stop : - 0.9740
New strategy :
Stand aside
Position : -
Target : -
Stop : -
Despite surging to 0.9837 on Friday, the subsequent retreat in NY suggests top has possibly been formed there and consolidation with mild downside bias is seen for weakness to 0.9750-55 (50% Fibonacci retracement of 0.9670-0.9837), however, break of 0.9730-35 (61.8% Fibonacci retracement) is needed to add credence to this view, bring further fall towards support at 0.9710 which is likely to hold on first testing.
On the upside, whilst recovery to 0.9805-10 cannot be ruled out, reckon said resistance at 0.9837 would hold and bring another retreat later. Above said resistance at 0.9837 would shift risk back to upside and signal the rise from 0.9421 low is still in progress, then gain to 0.9875-80 would follow but reckon 0.9900 would hold from here. As near term outlook is mixed, would be prudent to stand aside for now.
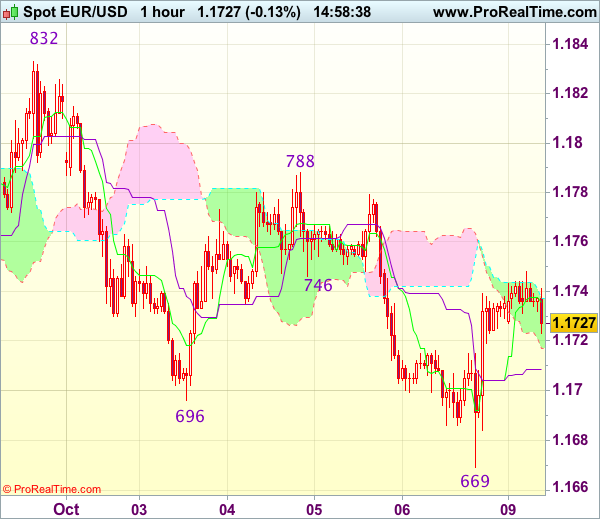
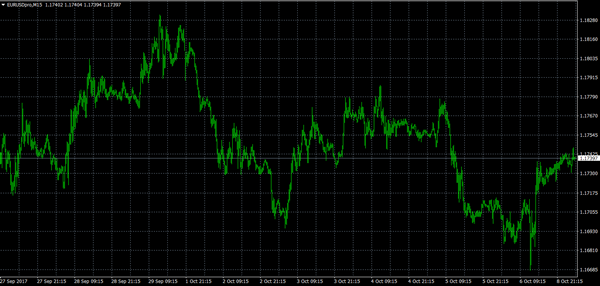
Euro Bears Struggle Below 1.1710
During the Asian trading session, the EURUSD pair has recovered towards the 1.1748 level, after euro sellers failed to close the former weekly price-candle below the key 1.1710 level.
Intraday trading sentiment surrounding the EURUSD pair remains bearish, as political wrangling in Catalonia continues, and U.S fundamentals point to one-more rate hike from the Federal Reserve this year.
On Friday, the EURUSD pair bounced strongly from its 100-day moving average, at 1.1670, and continued to find strong buying interest above its 200-week moving average, now found at 1.1695.
Technically, the EURUSD pair remains intraday bearish while trading below its calculated daily pivot point, located at the 1.1765 level.
Key intraday EURUSD resistance is found at the pairs weekly pivot point, at 1.1740 and the 1.1765 level. Further resistance is found at the former swing-high, at 1.1787 and the key 1.1832 level.
To the downside, key EURUSD support is found at the 2015 price-high, at 1.1710 and the pairs key 100-week moving average, currently located at 1.1695. Below the 1.1695 level, further support is found at 1.1670 and 1.1662.
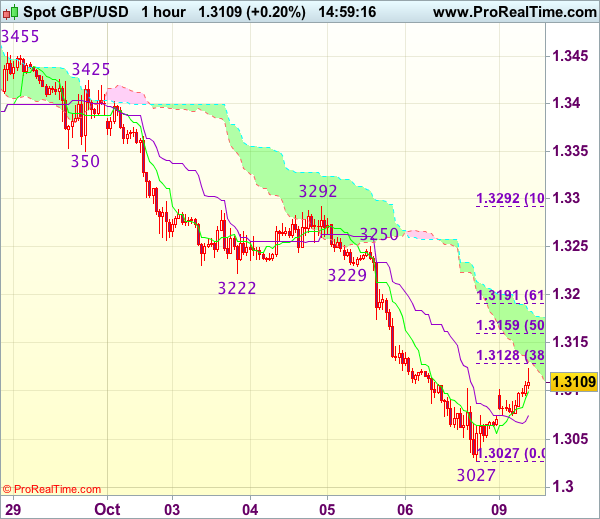
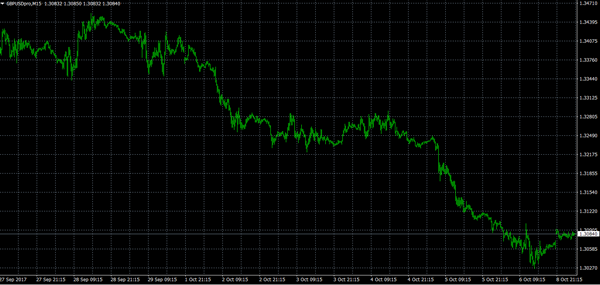
Sterling Tests 1.3100 Level
Sterling has recovered towards the 1.3100 handle, after the UK Office for National Statistics have admitted to miscalculating UK employment costs. Revisions from the ONS out today, are expected to show higher UK employment costs, further pressuring the Bank of England to raise interest rates this year.
Trading sentiment surrounding the GBPUSD pair remains mixed, despite the Asian session bounce towards 1.3100. Uncertainty still remains around Brexit negotiations, with British Prime Minister Theresa May due to give a key-speech in UK parliament later today.
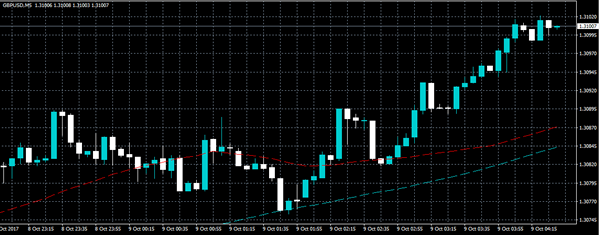
The GBPUSD pair is currently trading below its 50-day moving average, at 1.3150 and above its key 100-day moving average, at 1.3053.
A recovery above the 1.3150 level is needed for the GBPUSD pair to find renewed buying interest this week. A daily close below the 1.3053 level should encourage further selling in the British pound.
Key intraday technical support is seen at 1.3080 and 1.3053. Once below the 1.3053 level, further support is located at the former weekly price-low at 1.3027 and the key 1.2990 level.
To the upside, key resistance above the 1.3100 level is found at 1.3121 and the key 1.3150 level. Further resistance above 1.3150 is found at the pairs weekly pivot point, at 1.3166, and the 100-hour moving average, at 1.3180.
Trade Idea : GBP/USD – Sell at 1.3170
GBP/USD - 1.3123
Most recent candlesticks pattern : N/A
Trend : Down
Tenkan-Sen level : 1.3100
Kijun-Sen level : 1.3076
Ichimoku cloud top : 1.3183
Ichimoku cloud bottom : 1.3130
Original strategy :
Bought at 1.3375, stopped at 1.3340
Position : - Long at 1.3375
Target : -
Stop : - 1.3340
New strategy :
Sell at 1.3170, Target: 1.3070, Stop: 1.3205
Position : -
Target : -
Stop : -
Cable met heavy selling pressure last week and dropped sharply to as low as 1.3027 before recovering and although current bounce suggests initial corrective raise to 1.3155-60 (50% Fibonacci retracement of 1.3292-1.3027) is likely, reckon upside would be limited to 1.3175-80 and bring another decline later, below 1.3065-75 would suggest the rebound from 1.3027 has ended, bring retest of this level, break there would extend recent decline to psychological support at 1.3000 next.
In view of this, we are looking to sell cable on recovery as 1.3170-80 should limit upside. Above 1.3200 would risk test of previous support at 1.3222-29 (now resistance) would abort and signal low has been formed instead, bring further gain to 1.3250 but price should falter below resistance at 1.3292.
Trade Idea : EUR/USD – Buy at 1.1690
EUR/USD - 1.1723
Most recent candlesticks pattern : N/A
Trend : Down
Tenkan-Sen level : 1.1735
Kijun-Sen level : 1.1709
Ichimoku cloud top : 1.1737
Ichimoku cloud bottom : 1.1717
Original strategy :
Sell at 1.1855, Target: 1.1735, Stop: 1.1890
Position : -
Target : -
Stop : -
New strategy :
Buy at 1.1690, Target: 1.1790, Stop: 1.1655
Position : -
Target : -
Stop : -
Although the single currency extended recent fall to 1.1669, the subsequent rebound late Friday suggests a temporary low has possibly been formed there, hence consolidation with upside bias is seen for gain to 1.1750 and then towards resistance at 1.1788, however, break there is needed to add credence to this view, bring retracement of recent decline to 1.1800 and later towards resistance at 1.1832 which is likely to hold from here.
In view of this, we are looking to turn long on dips as 1.1690-00 should limit downside and bring another rebound. Only break of strong support at 1.1662-69 would signal recent decline is still in progress and may extend weakness towards 1.1625-30 but reckon 1.1600 would hold.
Slow Start Monday Could Leave Investors On The Sidelines
Monday is expected to be a slow session in the financial markets, with only a few data prints expected. Eager investors can expect a highly active week on the economic calendar beginning Tuesday.
Action on Monday begins at 06:00 GMT with the release of German industrial production. Output in Europe's largest economy is projected to rise 0.7% in August, following a flat reading the month before.
At 08:30 GMT, Sentix will issue its closely-watched investor confidence index. The monthly reading is expected to come in at 28.5, which is slightly higher than the 28.2 in September.
Earlier in the day, Caixin China reported a drop in Chinese services PMI for the month of September. The headline PMI reading came in at 50.6 on a scale of 1-500 where 50 separates expansion from contraction. That's down from 52.7 in August. The Composite Output Index was 51.4 in September, the weakest since June.
'The Chinese economy generally held up well in the third quarter,' said Zhengsheng Zhong, director of Macroeconomic Analysis at the CEBM Group. 'However, the expansion in both manufacturing and services cooled in September, suggesting downward pressure on economic growth may re-emerge in the fourth quarter.'
In the currency markets, the US dollar index traded slightly lower on Monday. The greenback surged to multi-month highs last week before losing steam on Friday, the day the Labor Department revealed the first monthly drop in nonfarm payrolls in seven years.
EUR/USD
The EUR/USD opened higher on Monday, but continued to trade in a firm downward cycle. The pair was last up 0.1% at 1.1741. However, the gains do little to alleviate concerns over the euro's projected path. The common currency has declined in each of the last four weeks, as a combination of political jitters and a resurgent US dollar pressured the bulls. Immediate support is located at 1.1695. On the opposite side of the ledger the first resistance level is seen at 1.1780.
GBP/USD
The British pound rose in Monday's Asian session, although prices remained capped below 1.31 US. Like the euro, sterling has been in a broad downward consolidation against the dollar for the past three weeks. Cable faces immediate support at the May high of 1.3049. Below that level, investors can expect heavier losses.
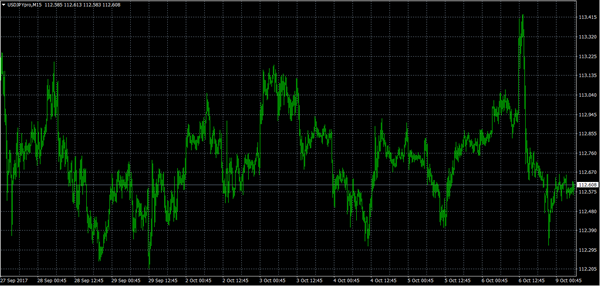
USD/JPY
The USD/JPY was little changed at the start of the week, a sign that investors were awaiting fresh trading catalysts in the form of economic data. The pair remains firmly pinned to the 112.00-113.00 region. This is not likely to change in the immediate term. Immediate support is located at 112.30. On the other side, the first resistance level is likely to be found at 112.85.
Trade Idea : USD/JPY – Sell at 113.10
USD/JPY - 112.59
Most recent candlesticks pattern : N/A
Trend : Up
Tenkan-Sen level : 112.58
Kijun-Sen level : 112.88
Ichimoku cloud top : 112.81
Ichimoku cloud bottom : 112.68
New strategy :
Sell at 113.10, Target: 112.10, Stop: 113.45
Position : -
Target : -
Stop : -
Although the greenback jumped to 113.44 on Friday, the subsequent reversal from there to 112.32 suggests top has possibly been formed there and consolidation with downside bias is seen for test of support at 112.21, however, break there is needed to add credence to this view, bring retracement of early upmove to 112.00, then 111.75-80 but previous support at 111.47 should remain intact.
In view of this, we are looking to sell dollar on recovery as resistance area at 113.20-26 should cap upside and bring another decline to aforesaid downside targets. Only break of said resistance at 113.44 would abort and signal recent upmove is still in progress for further gain to 113.75-80 and possibly towards 114.00-10 which is likely to hold from here, bring correction later.
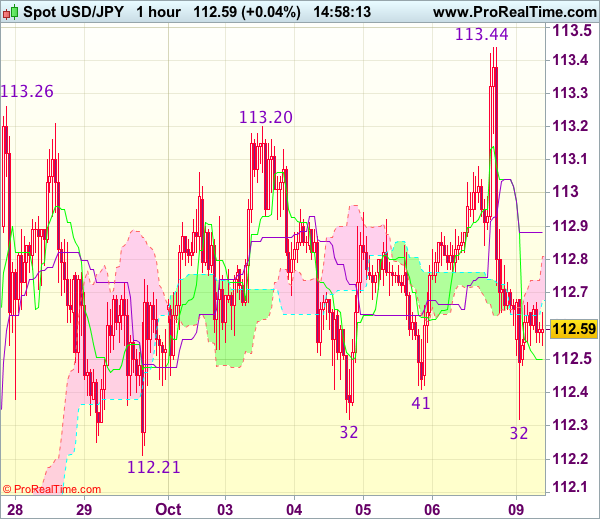
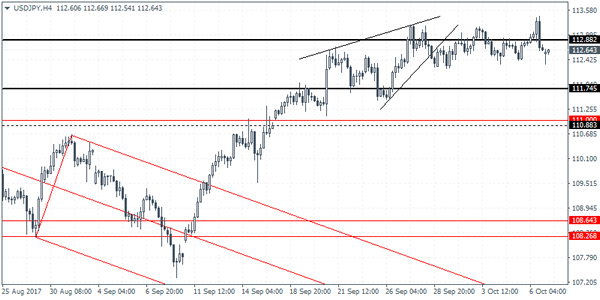
USDJPY Intraday Analysis
USDJPY (112.64): The USDJPY has been seen maintaining the gains near the falling trend line as well as the horizontal resistance level of 112.88. Failure to post a convincing close above this level is expected to keep the bias to the downside. Support is found at 111.74 which could be tested in the near term, followed a decline to 111.00 - 110.88 level of support. In the short term, USDJPY could be seen maintaining the sideways range within these levels. A breakout below 111.00 support area could, however, signal further declines in price.