
Sample Category Title
Britain’s Halifax House Prices Surprisingly Advanced In September
For the 24 hours to 23:00 GMT, the GBP declined 0.37% against the USD and closed at 1.3068 on Friday, amid a fresh bout of political uncertainty in the UK.
On the macro front, UK's Halifax house price index unexpectedly advanced 0.8% on a monthly basis in September, following a revised advance of 1.5% in the prior month and defying markets consensus for a flat reading.
In the Asian session, at GMT0300, the pair is trading at 1.3086, with the GBP trading 0.14% higher against the USD from Friday's close.
The pair is expected to find support at 1.3040, and a fall through could take it to the next support level of 1.2993. The pair is expected to find its first resistance at 1.3120, and a rise through could take it to the next resistance level of 1.3153.
Going ahead, traders will look forward to Britain's BRC retail sales data for September, slated to release overnight.
The currency pair is showing convergence with its 20 Hr moving average and trading below its 50 Hr moving average.

Japanese Yen Trading Slightly Higher This Morning
For the 24 hours to 23:00 GMT, the USD declined 0.15% against the JPY and closed at 112.65 on Friday.
On the economic front, Japan's flash leading economic index climbed less-than-expected to a level of 106.8 in August, compared to a reading of 105.2 in the prior month. Market participants had anticipated for a rise to a level of 107.1. Meanwhile, the nation's preliminary coincident index rose to a level of 117.6 in
August, beating market expectations of an advance to a level of 117.5. The index had registered a level of 115.7 in the previous month.
In the Asian session, at GMT0300, the pair is trading at 112.60, with the USD trading marginally lower against the JPY from Friday's close.
The pair is expected to find support at 112.14, and a fall through could take it to the next support level of 111.68. The pair is expected to find its first resistance at 113.25, and a rise through could take it to the next resistance level of 113.90.
Moving ahead, traders will closely monitor the release of Japan's trade balance (BOP basis) for August, slated overnight and the Eco-Watchers survey data for September, slated to release tomorrow.
The currency pair is trading below its 20 Hr and 50 Hr moving averages.

Swiss Franc Trading A Tad Higher In The Asian Session
.
For the 24 hours to 23:00 GMT, the USD slightly declined against the CHF and closed at 0.9780 on Friday.
In the Asian session, at GMT0300, the pair is trading at 0.9778, with the USD trading marginally lower against the CHF from Friday’s close.
The pair is expected to find support at 0.9754, and a fall through could take it to the next support level of 0.9730. The pair is expected to find its first resistance at 0.9819, and a rise through could take it to the next resistance level of 0.9860.
The currency pair is trading below its 20 Hr moving average and showing convergence with its 50 Hr moving average.

Canada’s Unemployment Rate Remained Steady At A 9-Year Low In September
For the 24 hours to 23:00 GMT, the USD declined 0.24% against the CAD and closed at 1.2539 on Friday.
Macroeconomic data revealed that Canada's unemployment rate remained steady at a nine-year low of 6.2% in September, meeting market expectations. Further, the nation's seasonally adjusted Ivey PMI surprisingly climbed to a level of 59.6 in September, confounding market expectations for a drop to a level of 56.0. The PMI had registered a reading of 56.3 in the previous month.
In the Asian session, at GMT0300, the pair is trading at 1.2533, with the USD trading a tad lower against the CAD from Friday's close.
The pair is expected to find support at 1.2507, and a fall through could take it to the next support level of 1.2480. The pair is expected to find its first resistance at 1.2579, and a rise through could take it to the next resistance level of 1.2624.
Amid a holiday observed in Canada today, investors will focus on global macroeconomic events for further direction.
The currency pair is trading below its 20 Hr and 50 Hr moving averages.

Gold Follows The Silver Bullet Higher
Gold shrugs of a stronger dollar to post an impressive recovery, but it is silver's rally that will have grabbed technical analysts attention.
Gold
Down, but not out, best describes gold's price action on Friday. Having sold off to a low at 1260.00, gold staged a remarkable 18 dollar comeback to close at 1278.00 as news emerged that North Korea may be about to test a new missile capable of reaching the United States. The rally has continued this morning with gold moving to 1284.50 as China returns from holiday. Iranian sabre rattling, Trump remarks on North Korea and further details of the proposed missile test have injected a geopolitical risk premium back into the yellow metal.
Admittedly gold was approaching a technically oversold condition in the short term anyway. The key now will be if the rally can maintain its longevity once the dust settles and in the face of higher U.S. yields and a stronger U.S. dollar.
From present levels, gold has resistance at 1291.00 and 1296.00. On the downside, the 100-day moving average at 1273.501 should provide initial; support ahead of Friday's lows at 1260.00. We expect that gold will trade with a bid tone in Asia today but will be vulnerable to headline created movements ahead of this weeks data highlight, the U.S. FOMC minutes.
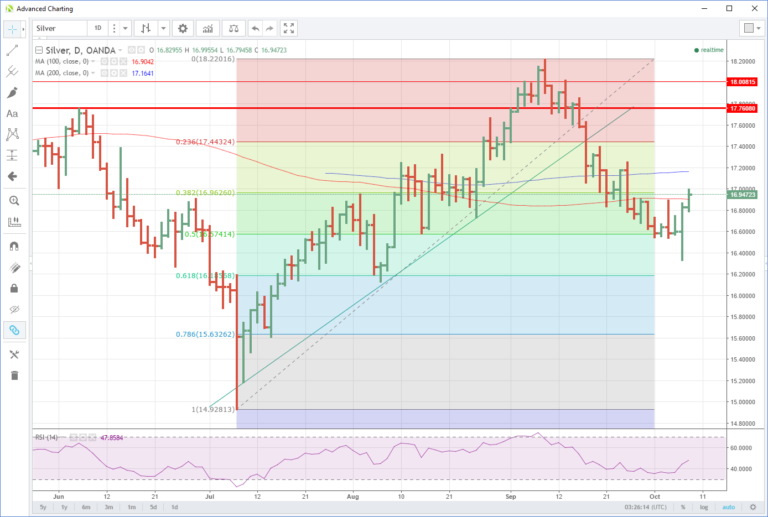
Silver
Silver's technical picture is altogether more favorable to gold. Silver held around its Fibonacci 50% retracement level at 16.5750 for the past week; silver collapsed to 16.3350. It was the price action from there that was particularly interesting though. Racing higher to 18.6600 and in the process creating a bullish outside reversal day.
Silver has followed gold higher this morning and is now trading at 16.9540, just above its 100-day moving average at 16.9043 which capped its gains all of the last week. A close at these levels implies that silver has made a serious attempt to base in its longer-term 38.2/50.0% Fibonacci retracement box.
The next resistance is at the 17.0000 regions which silver almost reached this morning, followed by the 200-day moving average at 17.1650. Support rests at 16.7900 and the now distant Friday low at 16.3350.

Silver's price action is particularly constructive given the general strength of the U.S. dollar and its lower beta to geopolitical noise then gold. Time will tell as to whether this reflected its more oversold condition, or whether it is a general signal that the worst may be over for the precious metal correction.
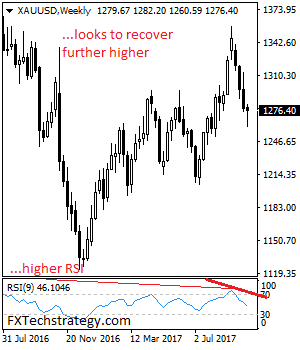
GOLD – Looks To Recover Higher On Price Hesitation
GOLD - The commodity closed marginally lower after rejecting lower level prices the past week. On the downside, support comes in at the 1,270.00 level where a break will turn attention to the 1,260.00 level. Further down, a cut through here will open the door for a move lower towards the 1,250.00 level. Below here if seen could trigger further downside pressure targeting the 1,240.00 level. Conversely, resistance resides at the 1,280.00 level where a break will aim at the 1,290.00 level. A turn above there will expose the 1,300.00 level. Further out, resistance stands at the 1,320.00 level. All in all, GOLD looks to recover further higher.
North Korea Preparing Long-Range Missile Test, Dollar softens
Dollar Fluctuates Amid North Korea Tensions. The greenback jumped on Friday on the payrolls data, that disappointed regarding jobs growth, although wage inflation rose and the jobless rate fell, before falling again on Russian media reports that North Korea is preparing to test a missile capable of reaching the US West Coast.
Kiwi Drops to 5-Month Low as Nats Lose Two Seats. The New Zealand dollar fell to a five-month low after the National Party lost two seats after special votes were counted while market bets on a Federal Reserve rate hike in the US increased. The kiwi fell to 70.53 US cents from 70.92 cents on Friday.
Gold Rebounds on North Korean Concerns. Gold bounced up from a two-month low on Friday, on concerns that North Korea is preparing to test a long-range missile and on support from the U.S. dollar’s shift into negative territory.Gold was up to $1276 per ounce on Monday after hitting its low of $1260.50 on Friday.
Record U.S. Oil Exports Weigh on Oil Prices. Crude oil briefly slumped below US$50 after a brief rally, as EIA data about U.S. crude oil exports showed these had hit a record-high of 1.98 million barrels per day. Refiners are returning to normal operation before the maintenance season shutdowns, with the EIA also saying in its Weekly Petroleum Status Report that crude oil inventories fell by an impressive 6 million barrels in the week to Sept. 29, versus analyst expectations ranging between a draw of 3 million barrels to a build of 2.7 million barrels. WTI traded at $49.48 a barrel on Monday, with Brent crude at $55.71.
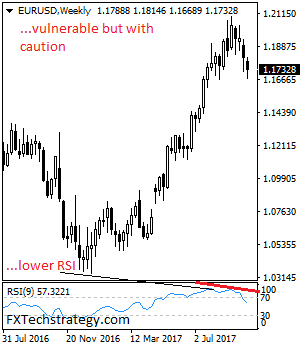
EURUSD – Closes Lower But With Warning Of Correction
EURUSD - With the pair extending its weakness other past week, more decline is envisaged. However, we should see a recovery higher in the new week. Resistance comes in at 1.1800 level with a cut through here opening the door for more upside towards the 1.1850 level. Further up, resistance lies at the 1.1900 level where a break will expose the 1.1950 level. Conversely, support lies at the 1.1700 level where a violation will aim at the 1.1650 level. A break of here will aim at the 1.1600 level. Below here will open the door for more weakness towards the 1.1550. All in all, EURUSD continues to face further bear threats but with caution.
USDCHF – Closes Lower On Bull Price Rejection
USDCHF - With the pair rejecting higher prices to close flat on Friday, more weakness is envisaged in the new week. On the downside, support lies at the 0.9550 level. A turn below here will open the door for more weakness towards the 0.9500 level and then the 0.9450 level. On the upside, resistance resides at the 0.9650 level where a break will clear the way for more strength to occur towards the 0.9700 level. Further out, resistance comes in at the 0.9750 level. Above here if seen will turn attention to 0.9800. All in all, USDCHF faces downside pressure on price rejection.

GBP/JPY Support/Resistance Zone In Play
Well, it's Monday Asian session and we have got some nice price action offering opportunity for savvy traders who were ready for the open!
Do you remember back in August, we were talking about the different ways to draw your GBP/JPY trend lines? Well although the first subjective trend line broke to the downside, price has since been following it back up and respecting the level on both sides.
Just think how often these trend line breakouts fail and price action just follows the line back in the direction of the original trend. Not something that the trading textbooks will tell you, but something worth thinking about when you're trading those sorts of setups.
There is no subjectivity however in horizontal zones like the obvious one we've had marked on the daily chart here:
GBP/JPY Daily:
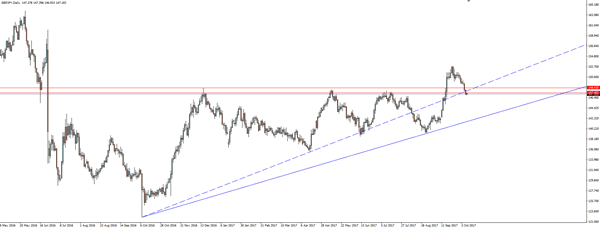
As you can seem price has come back down to test the previous resistance zone as support, but as there was zero intraday bounce, there was no reason for us to be blindly buying it.
However, now that price has gone straight through the zone, it doesn't mean that it's lost its power. It just simply means that we can now possibly look for it to act as resistance with any short term retests on the intraday chart being shorted:
GBP/JPY 15 Minute:
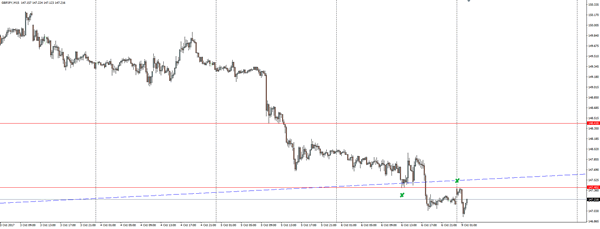
As you can see on the 15 minute chart, price gapped up 25 pips or so, right into the previous short term support level and then was rejected as it was turned to resistance. A beautiful little trade if you were at your charts for the open!