Sample Category Title
Week Ahead – US Retail Sales, Inflation and Fed Minutes in Focus in Quiet Data Week
In a relatively light calendar week, US economic indicators will be at the forefront, along with data out of China, the Eurozone and the United Kingdom. Inflation and retail sales numbers will be the highlights coming out of the United States, while industrial output and trade data will be the focus in non-US markets. The Federal Reserve will also be making headlines as it publishes its September meeting minutes and more Fed officials make public appearances.
China releases trade data
China's economy continues to defy projections of a slowdown in 2017 with the World Bank this week lifting its forecasts for GDP growth for the year from 6.5% to 6.7%. Rising global demand for Chinese exports has been one of the reasons why growth has been outperforming. After a dismal 2016, export growth has averaged 7.7% year-on-year so far this year. This trend looks set to continue in September with exports forecast to rise by an annual rate of 8.8% when the monthly trade figures are published on Friday. Imports are expected to grow by 13.5%. Also due out of China next week is the Caixin services PMI on Monday.
Eurozone industrial output to be eyed
It's going to be a fairly quiet week for Eurozone data with the only notable releases consisting of the Eurozone sentix index (Monday), and industrial output numbers (Thursday). Euro area industrial production is forecast to rise by 0.5% month-on-month in August, with corresponding figures for Germany and France due on Monday and Tuesday respectively. A bigger market mover might be ECB President Mario Draghi's attendance at a panel discussion at the Peterson Institute in Washington on Thursday. With the October 26 policy meeting approaching, investors will be eager to get a better insight as to what decision to expect from the European Central Bank with regards to asset purchases and forward guidance.
UK data will struggle to eclipse Brexit and political concerns
The pound looks set to have its worst weekly performance in a year this week. It's on track for losses of around 2.5% as worries that Theresa May's days as prime minister are numbered add to the uncertain outlook for the UK amid lack of progress in the Brexit negotiations. A possible vote of no confidence by Conservative MPs forcing May to stand down cannot be ruled out in the coming days or weeks.
Data out next week however, may provide some support for the battered pound. Trade, industrial output and manufacturing figures for August are all published on Tuesday. Industrial production is forecast to rise by 0.2% m/m in August, down from 0.2% in July, though the annual rate is expected to accelerate from 0.4% to 0.8%. The manufacturing sub-sector is also forecast for positive growth, expected at 0.3% m/m and 1.9% y/y. UK manufacturers have lagged behind their Eurozone counterparts this year even though the global economic recovery has picked up a gear and sterling remains weak, highlighting the challenge Britain faces in rebalancing its economy.
Hurricanes likely to distort retail sales figures
US data should add some excitement for traders in the coming week as key inflation and retail sales numbers are released. However, the week will likely start on a quiet note as US markets will be partially closed for Columbus Day on Monday. The first major data announcement is due on Wednesday, comprising of the JOLTS job openings for August, and the Fed minutes of the September policy meeting are also published on the same day. With the odds of a December rate hike now having risen to above 90% (according to fed fund futures) following a series of robust indicators and hawkish language by Fed policymakers, the FOMC minutes are unlikely to see much of a reaction in forex markets. However, analysts will still want to scrutinize the minutes for any signs of division over the inflation outlook given that some committee members have been more concerned than others about the absence of inflationary pressures.
On Thursday, producer prices for September will precede the CPI and retail sales reports for the same month on Friday. Both headline and core inflation are forecast to tick higher in September, with annual CPI rising to 2.3% from 1.9%, and core CPI to 1.8% from 1.7%. Consumer prices based on the CPI measure have been growing more strongly than the Fed's targeted inflation gauge, the core PCE price index, which declined to a two-year low of 1.3% in August. Retail sales meanwhile are forecast to receive a major boost from auto sales, which surged in September as Americans replaced their vehicles damaged in the hurricanes. Total retail sales are expected to jump by 1.7% m/m in September after falling by 0.2% in the prior month. Finally on Friday is the University of Michigan's preliminary reading of the consumer sentiment index for October.
Also to watch out of the US next week are Fed speakers, which will include Minneapolis Fed President Neel Kashkari, Dallas Fed President Robert Kaplan, Fed Governors Lael Brainard and Jerome Powell, and Chicago Fed President Charles Evans.
Nonfarm Payrolls Turn Negative But Wages Feed Dollar Bulls; Oil Gives Up Gains on Tropical Storm Nate
According to the widely-expected nonfarm payrolls report, 1.5mn people stayed out of work due to dangerous weather conditions in September, dampening the number of jobs added to the economy. This, however, was not the biggest surprise, as investors had been warned about the negative consequences arising from the devastating hurricanes. What was instead a more unexpected fact, was the upside change in wage growth which consequently pushed the dollar to fresh highs and boosted confidence in the US economy. In the meantime, the Gulf of Mexico is threatened again by another tropical storm, with oil prices giving up their yesterday's gains.
Hurricanes Harvey and Irma indeed dragged US nonfarm payrolls down, though, the impact was more negative than expected as the number of workers employed during the previous month declined by 33,000 instead of increasing by 90,000 as analysts estimated. In comparison, August's mark of 169,000 was upwardly revised from 156,000. In the private sector, 40,000 people were out of work.
On the other hand, weather distortions did not influence the unemployment rate as the rate considered people missing their jobs as employed. The figure fell surprisingly to a sixteen year low of 4.2%, while forecasts were for the figure to remain steady at the previous mark of 4.4%.
Good news also came from average earnings, with workers enjoying an increase of 0.5% m/m in their average hourly payments in September, following a rise of 0.2% in August. On a yearly basis, wages jumped by 0.2 percentage points to grow by 2.9%, approaching the 3.0% needed for inflation to reach the Fed's 2.0% target according to analysts.
The participation rate rose from 62.9% to 63.1%, the highest level seen since September 2013.
In the wake of the labour data, the dollar index surged to a 2 ½ -month high of 94.50 before it slipped back to 94.15, being 0.24% up on the day. Dollar/yen also touched a 2 ½ month high at 113.40, making a daily gain of 0.47%. Dollar/swissie was up 0.40% at a 3 ½-month high of 0.9816.
In Canada, September's labor report revealed that the economy added lower jobs than expected as the increase in full-time positions slightly offset the significant reduction in part-time jobs. Particularly, part-time positions experienced the largest drop ever seen, dropping by 102,000 after rising by 100,400 in August. In contrast, 112,000 people became full-time employers – the highest time since 2006 – following the departure of 88,100 persons in the previous month and adding 10,000 people to the labour force. The Canadian unemployment rate stood flat at a 9-year low of 6.2%.
Dollar/loonie struggled to gain ground, retreating to 1.2556 after it peaked at a 5-week high of 1.2597.
Euro/dollar was trading weak during the session, pulling to a 9-week low of 1.1668 in the wake of the US nonfarm payrolls. Still, it managed to edge up to 1.1692 afterwards.
Meanwhile, the Catalonia's head of foreign affairs, Raul Romeva, speaking on BBC on Friday, said that the region's parliament would decide on breaking away from Spain on Monday despite the Spanish Constitutional Court banning the parliamentary session from going ahead. This could potentially lead to more scenes of violence in the region. The Spanish Prime Minister, Mariano Rajoy, will meet with ministers later today as tensions remain high, with two large banks already planning to reallocate their operations elsewhere in Spain to avoid any negative economic effects due to ongoing tensions.
A better than expected September Halifax house price index reading out of the UK did little to boost sterling as May's leadership was in doubt after a disappointing speech at the Conservatives' annual conference, with former Conservative chairman calling her to step down. However, May's statement of providing "a calm leadership" provided some short-lived gains to the currency before it dived to a one-month low of $1.3024 – the pair was last at $1.3041.
In commodities, oil prices reversed yesterday's gains as energy producers shut down their operations in the Gulf of Mexico ahead of the tropical storm Nate which heads towards the region after causing fatalities to a number of Central American countries. WTI crude lost 2.89% of its value during the day, last trading at a three-week low of $49.42 per barrel, while Brent retreated by 2.26% to $55.73.
Gold approached a two-month low of $1,260.43 per ounce before it bounced back to $1,265.35.
Australia & New Zealand Weekly: Business Investment Lifts, But Recovery Uneven and Upside Constrained
Week beginning 9 October 2017
- Business investment lifts, but recovery uneven and upside constrained.
- Australia: Westpac-MI Consumer Sentiment, NAB business survey, housing finance.
- RBA: Financial Stability Review, Deputy Governor speaking.
- NZ: card spending, house prices and sales.
- China: aggregate financing, Caixin services PMI.
- Euro Area: industrial production.
- US: FOMC meeting minutes, retail sales, CPI.
- Key economic & financial forecasts.
Information contained in this report was current as at 6 October 2017.
Business Investment Lifts, But Recovery Uneven and Upside Constrained
Reserve Bank of Australia Governor Philip Lowe struck a positive tone on business investment in the Statement accompanying the RBA's policy decision on October 3. He stated that: "Over recent months there have been more consistent signs that non-mining business investment is picking up. A consolidation of this trend would be a welcome development." Here we consider the case for increased optimism on business investment and assess the outlook.
Business investment by the non-mining sectors strengthened over the past year. Annual growth lifted to 4.6% in mid-2017, we estimate, a pace approaching the historic average of 4.9%. That is a marked improvement on a 1.0% outcome in mid-2016 and is the best result since 2011 to 2012, when growth averaged 7.5%. That said, the current pace falls well short of the sustained strength evident during the six years 2002 to 2007, when nonmining investment grew by a brisk 12% a year on average.
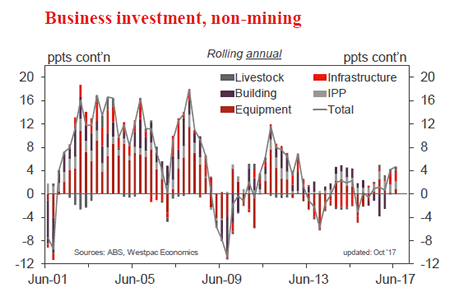
In assessing trends in business investment we will largely focus on spending by asset class. This spans equipment spending (which accounts for 40% of the total); non-residential building (a 25% weight); intellectual property products, including computer software (a 20% weight); infrastructure (a little in excess of 10%) and livestock.
Growth in business investment to date has been uneven. Nonbuilding activity was flat over the past year, while equipment spending grew at a sub-par pace, up 2.0%, relative to a longrun average of 6%. Strength has been concentrated in the smaller asset class of infrastructure activity, accounting for almost 2ppts of the 4.6% rise in total investment. Computer software spending is advancing at a solid clip, albeit below its long run average, accounting for 1.4ppts of the rise in investment. Livestock, which typically has a neutral impact, added 0.6ppts, as some herd rebuilding occurs.
The uneven nature of the uptrend in business investment may prove to be a temporary feature, ahead of an emerging more broadly based upswing. Alternatively, it may be symptomatic of more general uneven economic conditions, a view that we favour, as explored below.
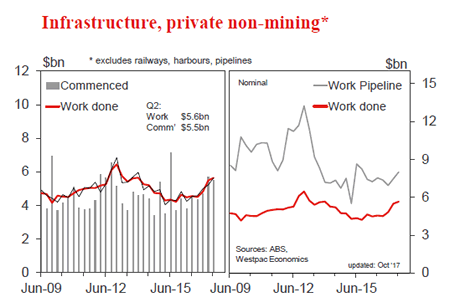
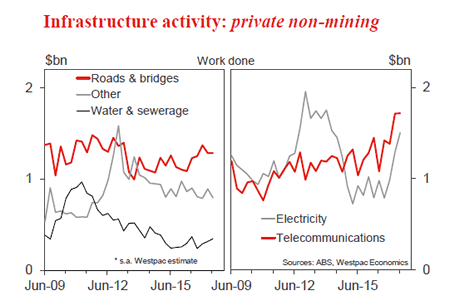
Infrastructure activity has been the stand-out performer recently. Private non-mining infrastructure work rebounded by 19% in the year to June 2017, partially reversing a sharp fall over the two years to mid-2015, which was followed by a flat period to mid-2016. The lift in activity is fully centred on two segments, namely: telecommunications, with some long overdue upgrading of the network; and electricity generation, with the nation facing potential power shortages. Outside of these two areas, activity is broadly flat, including segments such as roads; water & sewerage; and recreation. Near-term, prospects are for some further upside, but for growth to moderate, with the level of work done currently in line with the value of commencements.
Spending on intellectual property products (IPP), which includes R&D as well as computer software, is expanding at a solid clip. The segment notched up 7% growth over the past year, although that is still short of the long-run average of 9.5%. Businesses are focused on enhancing their technology, with a view to innovation and increased productivity. This is a mediumterm theme and the pace of growth in total IPP spending has been steady since 2014, with no sign of acceleration.
Non-residential building is at a turning point, with the prospect of a near-term lift in activity, a point that we have highlighted previously. Private approvals for the 12 months to August are 18% above that for the previous year, although we would discount this somewhat due to some slippage in pass through to commencements. Consistent with the approvals data, the latest update from the ABS capex survey included an upgrading of 2017/18 investment plans of the service sector.
The capex survey, which provides only a partial coverage of total business investment, points to a increase in service sector capex spending in the order of 10%, centred entirely on building & structures, with equipment flat.
In the building sector, more projects have received the go ahead in retail, social building (including education, health and accommodation), and particularly offices, with approvals up 75% for this segment, to be back at historic highs. This is to meet the needs of a growing population, as well as to service rapid growth in both international tourism and foreign student numbers. Having said that, in the post GFC period, there is no sense that the sector is set for a sustained strong upswing, with the absence of a speculative dynamic. Rather, the latest round of projects will satiate current demand, following which activity will likely either consolidate or dip temporarily.
Equipment spending, 40% of non-mining business investment, has been underwhelming. Growth was a sluggish 2% over the past year, coming on the heels of a 1% rise the year prior. There are some bright spots. The manufacturing sector reports that agriculture and some parts of mining have lifted equipment spending of late, on the back of stronger income growth associated with higher commodity prices. However, a key driver of equipment spending is the need for businesses to expand capacity to meet rising demand from the household sector. It is this driver that is underperforming. The RBA Governor made reference to this point in his Statement of October 3, "Against this, slow growth in real wages and high levels of household debt are likely to constrain growth in household spending".

Competing views on the outlook for the household sector are critical to prospects for a broadening and acceleration in the uptrend in non-mining business investment. On this matter, the Westpac Economics' view differs from that of the official family.
We expect consumer spending growth to be stuck at a lacklustre 2.5% annual pace, associated with persistent weakness in wages growth. In addition, we expect home building activity to weaken materially in 2018, led by a correction in the high-rise segment. By way of contrast, the forecasts in the May Federal Budget are more optimistic for 2018/19, expecting: consumer spending growth to lift to 3.0%, associated with a 3.0% increase in wages and a solid 1.5% rise in employment; and home building activity to decline relatively gradually, -4% vs Westpac at -7%. If household demand growth plays out as we expect in 2018 then the risk is that equipment spending remains relatively lacklustre.
In summary, business investment by the non-mining sectors has emerged from the softness apparent for much of the post GFC period. There is a need to add to the capital stock to meet the needs of a relatively fast growing population. Moreover, the negative spill-overs from the mining investment downturn have faded and world growth has improved. On balance, we see non-mining business investment growth continuing at around the current 4½% pace, supported near-term by the emerging lift in non-residential building activity.
However, we also expect the investment recovery to be uneven, reflective of the uneven nature of the broader economic expansion, with the household sector the key source of weakness. Equipment spending, which represents 40% of total investment by the non-mining sectors, will remain relatively subdued in this environment. If so, it is unlikely that the non-mining business investment cycle surprises materially to the upside, diminishing the prospect of the economy accelerating to a sustained above trend growth path. Our point forecast for December 2018, is total non-mining business investment growth of 5.0%yr, with equipment broadly flat.
The Week that Was
This week, we have been firmly focused on Australia and the outlook for the RBA.
The statement released by the RBA following its October meeting carried a number of subtle but interesting changes. Foremost was the shift in language around non-mining investment - see the essay above for further detail. Attention shifted from the outlook (which was characterised as having "improved recently" in September) to current experience, given "consistent signs that non-mining business investment is picking up". Further, the "large pipeline of infrastructure investment" that we have often discussed was also noted. This is best interpreted as the RBA gaining confidence in their expectation of improving business investment into 2018. Still, a constrained household sector continues to bother the RBA, the statement noting that "slow growth in real wages and high levels of household debt are likely to constrain growth in household spending". Though the Australian dollar has fallen from around USD0.80 to USD0.78 since the September meeting, the commentary on the currency ("weighing on the outlook for output and employment") was left unchanged. On the outlook for activity therefore, there is still a high degree of uncertainty, all the more so given this week's data outcomes.
The other key point to note regarding monetary policy is the RBA's clear concern over household debt, particularly that it continues to grow at a multiple of income growth. This has been a key theme in recent speeches by RBA staff, and in the October statement, it received greater prominence, coming ahead of the current conditions discussion in the housing paragraph. As we emphasise, it remains our view that the RBA and APRA will continue to target the household debt issue with macroprudential policies rather than rates. Nonetheless, this remains an important theme to track.
On to this week's Australian data. All three key releases spoke to our concerns regarding the outlook, most notably retail sales.
For the month of August, retail sales fell 0.6% against the market's expectation of a 0.3% rise. See the chart of the week box for further detail. This outcome pairs very well with the 'family finance' and 'time to buy detail' from our Westpac-MI Consumer Sentiment survey (an update will be received next week), with each of these measures consistently printing at below average levels through 2017. Combined with our expectation that wage gains will remain subdued versus history, this is a key reason as to why we believe that the RBA's expectations regarding the consumer will be disappointed in 2018.
Also informing on a component of household demand, the dwelling approvals release for August was broadly in line with expectations, but more importantly continued to suggest that residential investment will be a negative for growth in 2018 (versus the RBA's expectation that it will be broadly neutral). High-rise approvals, having fallen 50% over the past year, are expected to fall further. Low-rise approvals (townhouses up to 4 stories) have pushed higher in recent months, but in August single-home approvals lost some of their recent momentum. Auction markets and house price measures are softening (to varying degrees) across the major cities, hence single-home and low-rise approvals should flatten out in coming months. Given the substantial tightening in restrictions around foreign buyers and developers, the risks to the outlook for residential construction are likely skewed to the downside.
Finally on trade, here we received another surprise in August, this time to the upside as exports increased while imports stalled. On exports, iron ore was the big positive, up on higher prices, against which there were declines in coal, gold and base metals. The bigger point though is that for the September quarter as a whole, the trade data is not as constructive for growth as we had hoped. Hence the positive contribution we have pencilled in from net exports for GDP may not come to pass. Currently the data imply a nil contribution from net exports in Q3.
On the international scene, at the beginning of the week, we received a positive update on China, with both official PMIs rising to multi-year highs. Despite strength in production and new orders, employment remains a concern. Elsewhere in Asia, Japan remained a stand out, while India and Indonesia continued to experience more moderate expansions amid considerable uncertainty. Broadly, these updates continue to suggest that the global uptrend in trade is likely to persist, albeit with growth slowing over the coming year.
Also, for those with an interest in Europe, a quiet week has seen us take stock of the state of the Continent's consumer and the likely outlook for household demand.
Chart of the week: retail sales
For the month of August, retail sales fell 0.6% against the market's expectation of a 0.3% rise. Further, July's flat result was revised lower to a 0.2% fall. The combined July/August result is the weakest two month period since October 2010 (which came near the end of the RBA's 2009-10 tightening cycle) and leaves annual growth at 2.1%yr, its weakest result since June 2013. The detail of the report highlighted that the weakness in sales was broad based across subsectors and states.
While monthly retail sales are a nominal measure, and thus can be weighed down by price discounting, we doubt that underlying retail volume growth will be robust. This in turn points to significant downside risks to the Q3 consumption estimates in the national accounts and wider GDP growth.
New Zealand: Week ahead & Data Wrap
More of the same
The latest Quarterly Survey of Business Opinion indicates that election uncertainty may have weighed on sentiment about the broader environment, but firms remain content about their own prospects. The survey suggests that the New Zealand economy is on track to continue to grow at a modest pace, but that the June quarter is likely to have marked the peak for growth this year.
General business sentiment fell from a net 17% positive to a net 7% in the September survey. The survey was conducted over the September month, so as we've seen with other measures such as our consumer and regional confidence surveys, uncertainty about the outcome of the 23 September general election may have weighed on respondents' minds.
In contrast, firms showed fewer concerns about their own performance. A net 13% of firms reported improved conditions over the last quarter, compared to a net 17% in June. Meanwhile, expectations for the quarter ahead picked up a little compared to the last survey, and have been fairly consistent over the past year.
The detailed survey questions painted a similarly positive picture. Reported hiring over the last quarter rose to an equal-record high, and intentions for the next quarter were also high. Investment intentions were steady for plant and equipment, and up sharply for buildings. Profits were reported as broadly flat over the last quarter, but were expected to pick up.
There was some variation in fortunes across sectors. Retailers and manufacturers were generally more positive over the quarter, while the building and services sectors saw a drop in confidence. Notably, 41% of firms in the building sector reported that labour is their biggest constraint on growth, compared to 32% who cited lack of demand.
In recent times we've discussed the slowdown in construction activity, including the extent to which it has been the result of tighter financing conditions affecting demand, supply-side constraints such as skill shortages, and/or other factors. The results of this survey suggest that - in the commercial property space at least - demand remains strong, and capacity constraints seem to be the greater factor.
The QSBO also provides an array of information about capacity constraints and price pressures. The indicators from the September quarter survey were mixed. On the stronger side, the difficulty of finding workers rose to its highest level since 2007. Capacity utilisation fell slightly for a second quarter, but it remains at one of the highest levels on record.
However, these apparent capacity pressures haven't translated to a similar lift in the rate of inflation. More firms are reporting cost increases, but this share has remained relatively low in the years since the Global Financial Crisis. Despite the capacity constraints that were evident elsewhere in this survey, fewer builders reported a rise in costs and prices this quarter.
Similarly, the share of firms reporting that they had raised their prices or intended to do so was unchanged in the September quarter. At their current levels, these measures are consistent with inflation near the Reserve Bank's target midpoint of 2%, but they don't suggest a risk of inflation breaking to the upside in the near term.
Consumer prices for the September quarter will be published later this month. We're putting the final touches on our forecast, which currently stands at a 0.5% increase for the quarter. This would see the annual inflation rate lift from 1.7% to 1.9%. Our forecast is quite a bit higher than the Reserve Bank's pick of 0.2% for the quarter (1.6% annual). However, most of the difference is in the tradables component - including volatile factors such as food and fuel prices, which the Reserve Bank has more scope to look through.
In general, the high-level indicators of economic activity, such as the QSBO and our quarterly confidence surveys, have been only a touch softer for the September quarter compared to June. That's consistent with our view that the economy will continue to grow at a modest pace over the rest of this year, but that the 0.8% rise in June quarter GDP is likely to mark the high point for growth this year. The June quarter benefited from a range of temporary factors that won't be repeated in the September quarter figures: a boost to tourism spending from two major sporting events, and a rebound from earlier disruptions in dairy production and rail transport.
In fact, dairy output is shaping up to be a drag on near-term GDP growth again. Wet weather has hampered pasture growth in the early part of this season, and milk collections to date are down on the previous season (which were already subdued, given the pressures generated by low milk prices at the time). Fonterra's forecast of a 3% rise in milk collections for the season now looks like more of a stretch than it did at the start of the season.
All else equal, lower than expected volumes from New Zealand are often offset by higher world prices for dairy products - an idea that seemed to pervade the market ahead of this week's GlobalDairyTrade auction. The surprise 2.4% fall in auction prices served as a reminder that supply is only one half of the story, and that the strength of world demand shouldn't be taken for granted.
We have maintained our forecast of the farmgate milk price for this season at $6.50/kg, compared to Fonterra's forecast of $6.75/ kg (with other forecasters sitting somewhere around that level). That said, the level of production and hence prices remains very sensitive to the weather over the next few months, as dairying enters its peak period.
For the week ahead, the economic highlights will include updates on the housing market and consumer spending during September - and most importantly, a potential resolution about the shape of the next Government. On Saturday the special vote count will be completed, and the final seat allocations announced. After that, the negotiations among the major political parties will be full speed ahead - NZ First leader Winston Peters has given a selfimposed deadline of 12 October for making a decision about who to align with.
Data Previews
Aus Oct Westpac-MI Consumer Sentiment
Oct 11 Last: 97.9
- The Westpac-Melbourne Institute Consumer Sentiment Index rose 2.5% to 97.9 in September from 95.5 in August. Despite the lift, pessimists continue to outnumber optimists with pressures on family finances, concerns around interest rates, deteriorating housing affordability, rising energy prices and weak wages growth offsetting any boost from improved jobs growth.
- This month's survey is in the field over the week ended Oct 8. Factors that may influence confidence include: the RBA's decision to again leave rates on hold at its Oct meeting; more signs of cooling across Australia's major housing markets; and a disappointing retail update showing a surprise fall in sales. Both the AUD and ASX are down over the last month. Against this, jobs data has continued to perform strongly.
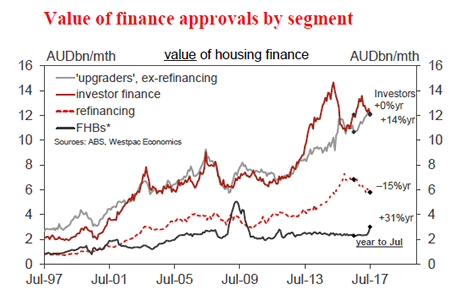
Aus Aug housing finance (no.)
Oct 12, Last: 2.9%, WBC f/c: flat
Mkt f/c: 0.5%, Range: -1.6% to 1.5%
- The number of housing finance approvals to owner occupiers posted another surprisingly strong gain in July up 2.9% and 4.5% ex refinancing. Note that the macro prudential tightening measures introduced in late March and associated increases in rates for investor and 'interest only' loans in March and June have likely given indirect support to owner occupier loan activity. Indeed, the value of investor loans fell 3.9% in July.
- The full impact of these shifts is still coming through. Industry data suggests owner occupier loans were again firm in August but with some signs that the recent lift is levelling out. We expect owner occupier approvals to be flat in the month. The focus will again be on investor loans and to a lesser extent construction-related finance which has shown a notable lift in recent months.
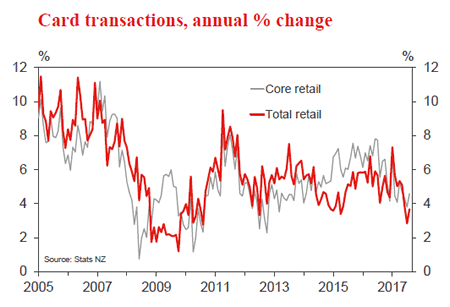
NZ Sep retail card spending
Oct 10, Last: -0.2%, Westpac f/c: 0.5%, Mkt: 0.5%
- Retail spending was softer than expected in August, with spending levels down 0.2%. That followed a fall of 0.6% in July.
- Spending levels have been broadly flat for several months now. In part, this is because of the softness in prices, particularly for imported consumer goods. However, it's likely that the softening in the housing market is also dampening household spending, particularly for items such as household furnishings.
- Increases in fuel prices should push retail spending higher in September. However, with lingering softness in the housing market, and an easing in tourist arrivals following their surge earlier in the year, the underlying pace of spending looks set to remain modest.
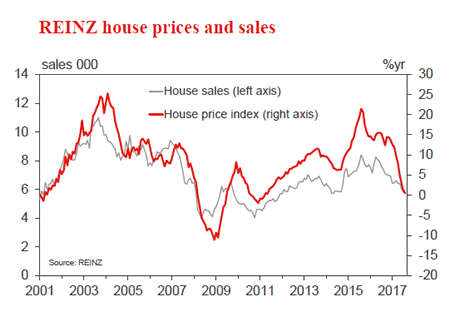
NZ Sep house prices and sales
Oct 9-13 (tbc), Sales last: +0.6%, Prices last: 0.5%yr
- New Zealand's housing market has slowed substantially over the last year. House sales are down by a quarter, and sale prices have flattened out. Prices have fallen slightly in Auckland and Christchurch, while the rate of increase in the rest of the country has slowed.
- There was a tentative stabilisation in August, with sales and prices ticking up slightly. A sharp slowdown in the rate of new listings - property owners don't sell into a weak market if they don't have to - has helped to rebalance the market.
- Nevertheless, we think this improvement could be shortlived, as higher mortgage rates and lending restrictions remain the dominant factors. And to the extent that election uncertainty has been a factor recently, it will surely have weighed on the market again in September.
US Sep CPI
Oct 13, last: 0.4%, WBC: 0.5%
- Inflation has been an ongoing disappointment in the US in 2017, with core and headline CPI inflation having fallen back below the 2.0%yr medium-term target as the PCE measure remained there.
- However in August, headline prices rose 0.4% as gasoline prices jumped over 6% and rents also experienced a strong month. Annual headline inflation lifted from 1.7%yr to 1.9%yr.
- Come September, hurricane season will see gasoline run higher again and headline prices increase 0.5% overall. Annual inflation is therefore set to bounce back above 2.0%.
- These inflationary influences will prove transitory, so it is best to focus on core inflaton. This measure is expected to print a more modest 0.2%, 1.7%yr. Further out, expect to see headline and core inflation settle a little below the 2.0%yr medium-term target of the FOMC.
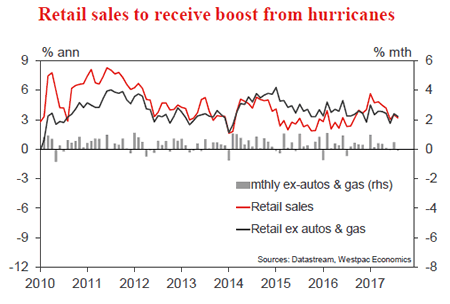
US Sep retail sales
Oct 13, last: -0.2%, WBC: 1.2%
- Aug was a soft month for US retail, in part because the arrival of hurricanes Irma and Harvey weighed heavily on car sales in affected regions. Nationwide sales were down 1.6% as a result. That said, given both headline and core retail sales fell 0.2% in the month, households also clearly stocked up ahead of the storm, offsetting some of the weakness.
- Come Sep, not only will there be a sharp reversal in car sales (Reuters has reported sales of new cars in the Houston area were up 109% in the three weeks after the storm versus the three weeks prior), but significant household spending will also need to take place to replenish household stocks and make necessary initial repairs to buildings. As a consequence, retail sales will jump in Sep.
- It is worth highlighting however the 0.2% fall in core sales in Aug and the downward revisions to Jul. These results imply that, sans weather, the US consumer remains reluctant to spend. This is a key reason why GDP growth is likely anchored to 2.0% despite job growth and sentiment.
Weekly Focus: The World Economy in a Sweet Spot
Market Movers ahead
- In the US, the most important data release next week will be CPI and CPI core figures for September, which we estimate will have increased.
- The coming week brings several speeches by FOMC members and the minutes from the September FOMC meeting.
- In the euro area, we look for another rise in Sentix investor confidence in October.
- China may release the Total Social Finance credit data over the next week, which will give insights into whether the crackdown on shadow finance is continuing.
- In the Scandinavian countries, inflation numbers for September are due out.
Global macro and market themes
- The world economy is growing solidly thanks to rising business and consumer confidence.
- Economic momentum should continue in 2018, although policy tightening is likely to moderate growth in some countries.
- Inflation pressures are set to remain relatively muted, allowing a gradual central bank policy normalisation.
- The scenario is bullish for global equities and moderately bearish for bonds.
- A Chinese debt meltdown or a North Korean war remain the low probability-high impact events of 2018.
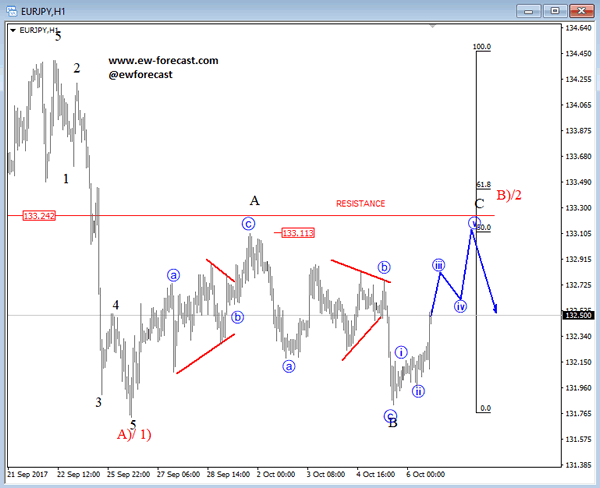
Elliott Wave Analysis: EURJPY Intra-day View
Good day traders! Today's focus is on EURJPY.
EURJPY found a support slightly above Sep 26 low, so we see pair still making a corrective move; possibly a flat with wave C up in play that can retest 133.30 next week then drop, while market stays below 134.45.
EURJPY, 1H
USD Gains Modestly on Distorted Payrolls
- European equities record losses of around 0.5%. US equities opened around 0.2% lower after mixed payrolls which raised the odds of another rate hike this year.
- US payrolls were mixed. The number of people employed declined by 33 000 in September (vs + 80 000 consensus) and the previous 2 months' figures faced a combined 38 000 downward revision. Weather conditions played a significant role. The unemployment rate unexpectedly dropped to 4.2% though, the lowest level since early 2001. On top, average hourly earnings rose by 0.5% M/M and 2.9% Y/Y, matching the fastest pace since 2009 and beating consensus by a wide margin.
- Canada's labor market showed more signs of tightening in September, with the 10th straight month of employment gains and the strongest wage increases in more than a year. Net change in employment increased by 10k, close to consensus (12k), but details showed a huge switch from part time jobs to full time jobs.
- Spain apologised for a violent police crackdown on Catalonia's independence referendum, in a conciliatory gesture as both sides looked for a way out of the nation's worst political crisis since it became a democracy four decades ago.
- British PM May said she would stay on as leader to provide stability after a former chairman of her Conservative Party said he had garnered the support of 30 lawmakers who wanted her to quit.
Rates
US 10-yr yield tests key resistance at 2.4%
Global core bonds lost ground today in the run-up and after a mixed US payrolls report. Strong average hourly earnings stood out. US yields tested key resistance after the release, but breaks didn't occur yet apart from at the 2-yr tenor. At the time of writing, US yields rise by 2.5 bps (2-yr) to 4 bps (5-yr). German yields trade 0.8 bps (2-yr) to 3.3 bps (10-y) higher. On intra-EMU bond markets, 10-yr yield spreads versus Germany barely changed.
The Bund opened little changed, but came under pressure mid-morning and dropped about 40 ticks before a bottom was found and sideways trading kicked in. US Treasuries copied the Bund's move. Various factors may have been in play. Some positioning ahead of the US payrolls, very strong German order intake (which was published at the opening of the session though) and technical factors. The decline accelerated when yesterday's low was broken. During US dealings, focus turned to the payrolls report. The outcome was mixed. Net job growth hugely disappointed (-33k), but was distorted by hurricanes Harvey and Irma. Taking into account the previous two months' revisions, payrolls missed consensus by 151k which is gigantic. The unemployment rate dropped to the lowest level since 2001 though and was accompanied by a rise in the labor force participation rate (to 63.1%). Average hourly earnings rose more than forecast (0.5% m/m & 2.9% y/y vs 0.3% m/m & 2.6% y/y consensus) and matched the fastest pace since 2009. Investors focused on the inflation component of the report, pulling US Treasuries lower. The move remained all in all modest with US yields rapidly running into key resistance levels. The US 2-yr yield managed to take out the 1.5% hurdle, but the 5-yr yield (1.97%) and 10-yr yield (2.4%) have more difficulties. The market implied probability of a December rate hike increased further to 80%.
Currencies
USD gains modestly on distorted payrolls
The US payrolls were the focus for USD trading today. As expected, the report was distorted by the impact of the hurricanes. However, the decline of the unemployment rate (to 4.2%) and a strong rise in average hourly earnings suggested a further improvement in labour market conditions. US yields and the dollar rose slightly after the report. EUR/USD trades in the 1.17 area. USD/JPY is changing hands around 113.25.
Overnight, Asian markets profited from positive spill-over effects from WS's record race. Even so, the gains in USD/JPY remained modest. The pair continued to struggle to overcome the 113.00/26 resistance. Uncertainty on the outcome of the Japanese parliamentary elections might play a role. Overall USD strength finally pushed EUR/USD for a test of the recent lows below 1.17. The decline of the Aussie dollar accelerated after RBA-member Harper indicated that the economy isn't out of the woods and as he suggested that an additional rate cut isn't ruled out.
The dollar tried to extend its uptrend early in European dealings, but there was no strong enough driver just hours before the he key US payrolls report. Very strong German factory orders (3.6% M/M and 7.8% Y/Y) maybe also prevented a further decline of EUR/USD. The pair settled in a tight range close to 1.17. USD/JPY held near 113 as the equity rally stalled.
US payrolls painted quite a diffuse picture. There was a net decline in the number of people employed of 33K. The report was subject to major disruptions due to the hurricanes Harvey and Irma. At the same time, the unemployment rate declined to 4.2% from 4.4%, the lowest since 2001. Average hourly earnings rose a strong 0.5% M/M and 2.9% Y/Y (only 0.3% M/M and 2.6% Y/Y was expected). Bonds and the dollar reacted in the first place to the decline in the unemployment rate and rise in wages. US yields increased and interest rate differentials with the euro and the yen rose modestly. EUR/USD dropped to the 1.1670 area, but the dollar couldn't hold on to the initial gains. EUR/USD trades currently again in the 1.1190 area. USD/JPY jumped to the 113.40 area. This cross rate is a bit more resilient (currently 113.30 area) even as equities show modest losses after the payrolls. Conclusion: USD yields and the dollar rise marginally after strong US wage data, but the disruptions due to the hurricanes prevent investors to play the USD reflation trade in a more aggressive way.
Political uncertainty keeps sterling the defensive
Sterling remained in the defensive today even as there was no high profile negative news. Lingering uncertainty on the political fate of PM May and the lasting stalemate in the Brexit negotiations continue to haunt sterling. The Halifax House prices rose (0.8% M/M and 4.0%Y/Y) were higher than expected but that wasn't the markets' focus. EUR/GBP initially held a tight in the 0.8930/55 area. The UK currency lost further ground in the run-up to the US trading session. Decent eco data probably won't help as long as there is no clarity on UK politics. The technical picture of sterling is deteriorating, both against the euro and the dollar. US payrolls caused temporary gyrations in cable and EUR/GBP, but had no substantial impact. EUR/GBP trades in the 0.8965 area. Cable lost a few more ticks in line with the overall USD up-tick. The pair trades in the 1.3050 area, extending the established decline. Sterling might be vulnerable to additional losses if risk sentiment deteriorates.
Jobs: Taking the Long View Over the Short Run Dip
Quickly moving beyond the temporary distortions, the outlook for jobs/personal income/consumer spending remains optimistic. The Fed still has the green light in December, even as jobs fell 33,000 in September.
September Jobs Down 33,000: Hurricane Whirlwinds
Nonfarm payrolls fell 33,000 in September, with the three month average slipping to 148,000 jobs. Despite the weakness, job gains in recent months and uptrend in wages are good for consumer incomes and consistent with 2.5 percent economic growth in the third quarter, and Fed policy as currently projected for a December rate hike.
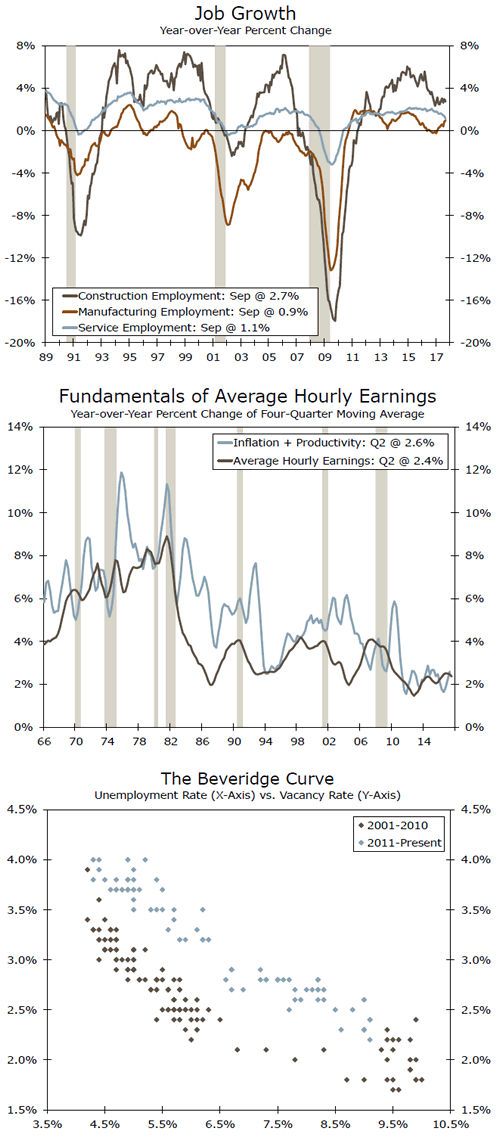
Over time hiring in the services sector remains solid (top graph). In the goods sector, manufacturing and construction employment have continued to show gains over the past four years in contrast to the volatility witnessed, especially in manufacturing jobs, in the prior two expansions. Also reassuring has been the strength in the employment components of both the ISM manufacturing and non-manufacturing surveys this year.
Wage Growth: Real Wage Gains Over the Past Two Years?
Despite the focus on nominal wage gains, the real story for the American household is that real wages continue to rise and thereby boost household real incomes and consumer spending.
Nominal average hourly earnings rose 0.5 percent in September and are up 2.9 percent over the year. We interpret this gain as a shift in the mix of jobs where lower wage leisure and hospitality workers fell 111,000 in September. While job growth remains strong, the gradual rise in earnings over the past six months signals higher incomes but also pressure on profits as firms have modest top-line pricing power (especially in the goods sector).
Longer term, the modest inflation readings and weak productivity numbers have limited the gains in nominal wage growth (middle graph). Lackluster productivity growth in the current cycle has weighed on wage growth and will likely continue to hamper wage appreciation. Moreover, inflation has been persistently below the FOMC's target of two percent and has struggled to sustain upward momentum. With both productivity growth and inflation continuing to prove sluggish, it is not altogether surprising that wage growth has disappointed given the performance of the fundamentals.
Structural Problems Persist: Drag on Growth
For any given unemployment rate (labor supply), the vacancy rate (job openings) remains wider than in the previous expansion (bottom graph), however the slack is gradually tightening. This Beveridge Curve signals a structural weakness in the labor market which is confirmed by several labor market survey indicators. Compared to a year ago, the unemployment rate for those without a high school education and with a high school diploma remains higher than the unemployment rate for those with some college.
The mean duration of unemployment rate remains at 24.4 weeks which is higher than any level since 1982. Finally, the prime age labor force participation rate has risen over the last year but remains far below the level of participation since 1990.
Hurricane Impact Hides Strong Underlying U.S. Labour Market in September
Highlights:
- Payroll employment in September dropped 33k following the 169k increase in August though greater strength in the household employment survey contributed to the unemployment rate dropping to 4.2%.
- The annual increase in wages jumped to 2.9% though it may have been distorted by the hurricanes.
Our Take:
The impact of Hurricanes Irma and Harvey was clearly evident in today's report as the monthly tally for September payrolls was much weaker than expected declining 33k following the reported 169k gain in August. The BLS, which compiles the data acknowledged that the two hurricanes had a clear downward impact on the job count though was not able to provide a precise estimate of the hit. However, the BLS did point out that food services component sank 105k in September compared to a trend gain of 24k over the prior twelve months. The BLS noted that this sector is particularly vulnerable to weather-related disturbances as "a large majority of [these] workers are not paid when they are absent from work." This suggests that this single component likely biased down September payrolls by almost 130k and indicative that underlying payroll gains remain solidly positive in the month. Underlying strength in September labour markets was also conveyed by the unemployment rate dropping more than expected to 4.2% from 4.4% in August. The unemployment rate is based on the separate household survey where individuals unable to get to work due to adverse weather are still counted as 'employed.'
The continued underlying strength in labour markets augurs well for overall GDP growth to continue to increase at an above-potential rate. This pace of activity will likely be abetted by the repair and rebuilding work that will ensue in the wake of the damage to from both hurricanes. With the 4.2% unemployment rate reported today indicative of labour markets operating at capacity, the Fed will likely see the need to continue to tighten policy. Thus today's report reinforces our view that the fed funds range will be hiked 25 basis points in December with four similar-sized increases through 2018.
Canadian Wages Finally Starting to Pick Up as Job Gains Continue
Highlights:
- Employment rose 10k in September as massive swings in full-time (+112k) and part-time (-102k) largely offset one another.
- The unemployment rate held steady at 6.2%. Aside from a two-year period prior to the 2008-09 recession, when the economy was running beyond full capacity, unemployment hasn't been this low in decades.
- Wage growth picked up to 2.2%, the highest pace in more than a year, from a low of 0.5% in April. September's increase was in goods-producing jobs, led by an gain in construction sector employment.
- Services employment was flat as a jump in education services, likely reflecting shifting hiring patterns for teachers, was offset by a pullback in culture and recreation employment.
- A more moderate pace of job growth in Q3 - with average monthly gains of 14k compared with 31k over the first half of the year - is consistent with our forecast that GDP growth shifted down to a still above trend 2.5% annualized rate in the quarter.
Our Take:
Canada posted a tenth consecutive job gain in September, extending the best streak in nearly a decade. But the bigger story in today's employment report is that wages are finally starting to pick up after a period of puzzlingly slow growth. Average hourly wages were up 2.2% from a year ago, largely due to acceleration in the last few months. It appears tight labour market conditions, including a near-decade-low unemployment rate and limited 'hidden' slack, are finally having an effect. Faster wage growth, which should eventually feed through to higher prices, supports the Bank of Canada's expectation that inflation will return to its 2% target over the next year. After a more dovish speech by Governor Poloz last week trimmed the odds of another rate hike this year, we think today's report supports our forecast that the overnight rate will be raised once more in 2017.
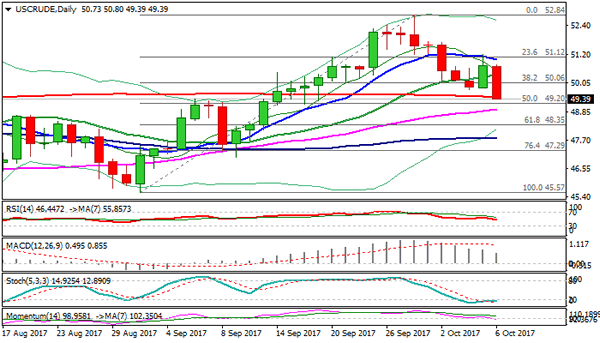
WTI Oil Falls Below $50; Near-Term Bias Turns Lower
WTI oil holds in red on Friday and returned below $50 handle and also broke back into weekly cloud (cloud top lies at $49.87) with fresh acceleration lower after US jobs data, denting next important support at $49.47 (200SMA). Near-term focus is turning lower after recovery attempts was capped by south-turning 10SMA and fresh acceleration lower posted new 3-week lows. Close below $50 will be seen as negative signal, while weekly close below 200SMA would generate stronger bearish signal. Immediate targets lay at $49.20 (Fibo 50% of $45.57/$52.84 ascend) and $48.98 (rising 55SMA), which guard next pivot at $48.35 (Fibo 61.8%). Broken 20SMA ($50.38) is expected to limit corrective upticks.
Res: 50.00; 50.38; 50.80; 51.02
Sup: 49.39; 49.20; 48.98; 48.35