
Sample Category Title
EUR/CHF Weekly Outlook
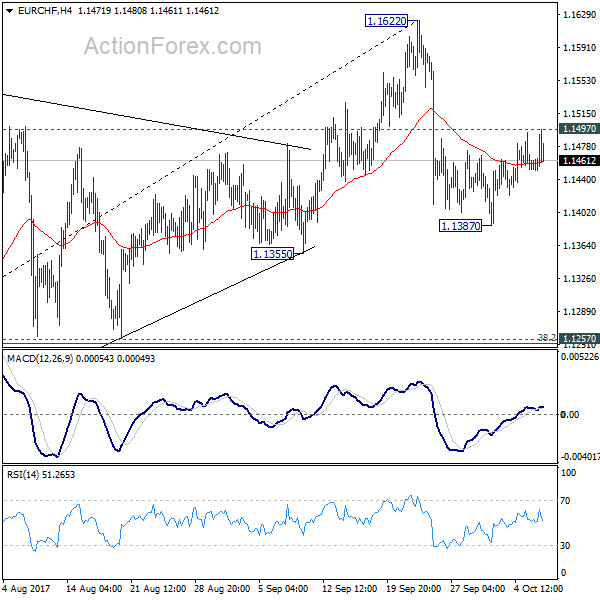
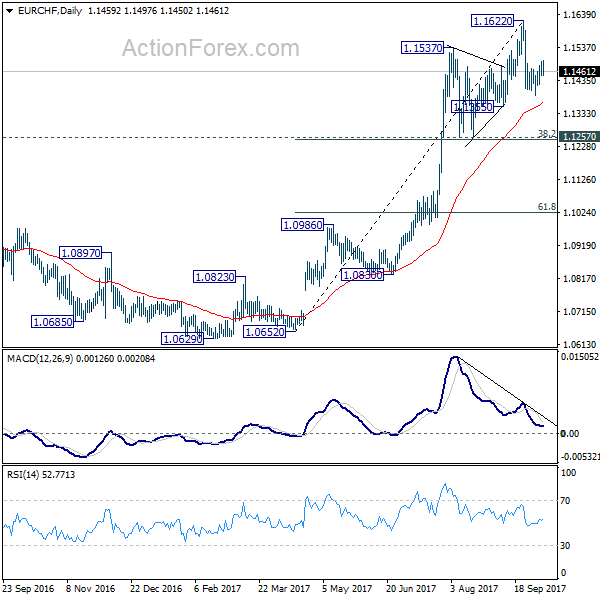
EUR/CHF dipped to 1.1387 last week then recovered. Overall outlook is unchanged that price actions from 1.1622 are developing into a correction. Initial bias is neutral this week first. Below 1.1387 will target 1.1257 cluster support (38.2% retracement of 1.0652 to 1.1622 at 1.1251). Strong support is expected there to contain downside and bring rebound. Above 1.1497 will extend the recovery. But break of 1.1622 is needed to confirm up trend resumption. Otherwise, the consolidation should continue with risk of at least another fall.
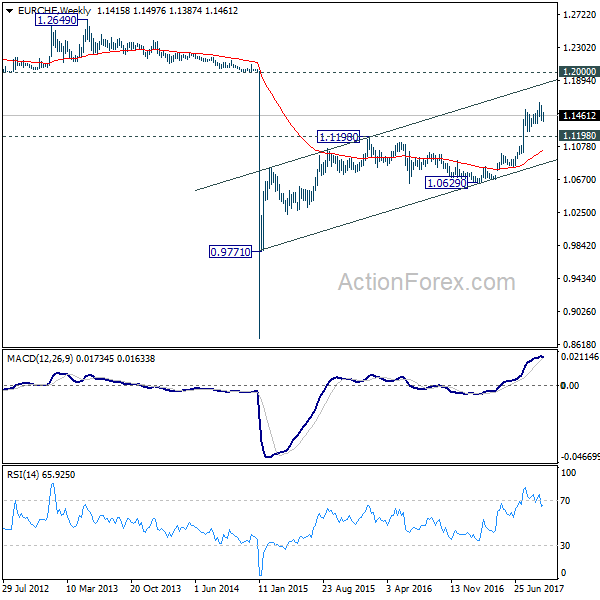
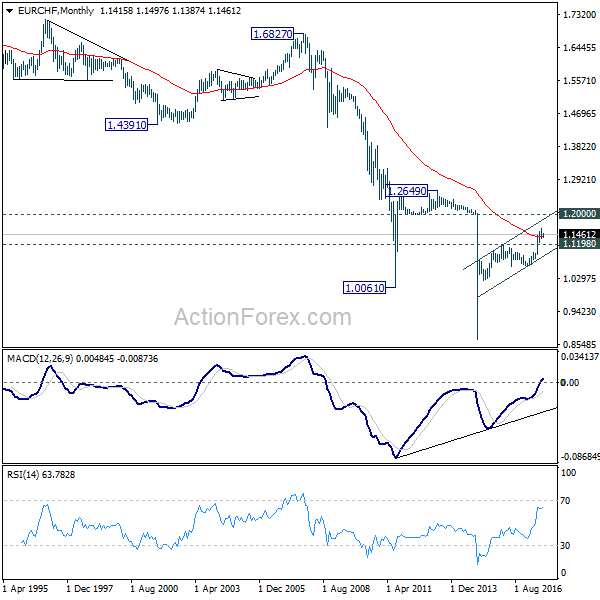
In the bigger picture, long term rise from SNB spike low back in 2015 is still in progress. EUR/CHF should now be heading back to prior SNB imposed floor at 1.2000. For now, this will be the favored case as long as 1.1198 resistance turned support holds.
Dollar Rally Clouded by North Korea Risk, Politics Might Overshadow Economic Data Again
Dollar ended as the strongest major currency last week as economic data released affirmed a December Fed hike. The surprised contraction in non-farm payroll was offset by strong wage growth. However, the greenback pared back some of its gain on resurgence on North Korea risk. On the other hand, the British Pound suffered broad based heavy selling as there were increasing calls for Prime Minister Theresa May to step down, in the crucial time of trade negotiations with the world. In spite of political uncertainties in Catalonia, Euro showed much resilience and ended the week mixed only. North Korea, Catalonia, Theresa May, Japan election, are the key things to watch ahead. Politics might overshadow economic data again.
Markets pricing in over 90% chance of Fed December hike
Economic data from US last week affirmed the case for a December rate hike by Fed. Both ISM indices beat market expectations and improved in September. Non-farm payroll report showed the first contraction since 2010, by -33k in September. But that was heavily skewed by the impact of hurricanes. Unemployment rates indeed dropped to 4.2%, down from 4.4% while participation rate rose to 63.1%, up from 62.9%. The most positive surprise was wage growth. Average hourly earnings jumped 0.5% mom. While wage growth could also be inflated by the hurricanes, it beat the already optimistic expectation of 0.3% mom. Fed fund futures are now pricing in over 90% chance of a December hike.
Trump moved one step with tax plan
Another Dollar positive development was that the House approved a budget outline on Thursday. That was a procedural step for US President Donald Trump and Republicans to push through the tax plan. The tactic that Republicans used is a procedure called reconciliation. That could prevent Democrats from blocking a tax bill through filibuster in the Senate. Only 60 votes are needed to overcome filibuster and Republicans already got 52. And, under reconciliation, a bill can be passed with simple majority, without even involving the Democrats
North Korea ready to strike US West Coast
However, Dollar's post NFP rally reversed on news that North Korea is ready to launch another missile any time. Reuters reported that a Russian Duma's international affairs committee member, Anton Morozov, said that "they are preparing for new tests of a long-range missile." And, "they even gave us mathematical calculations that they believe prove that their missile can hit the West Coast of the United States." Also, "they intend to launch one more long-range missile in the near future. And in general, their mood is rather belligerent." The news clearly put some nerve on investors as seen in yield and Dollar just before the weekly close.
Dollar index hit 94.14 key near term resistance
Dollar index extended rebound from 91.01 and reached as high as 94.26. 94.14 key near term resistance was breached but there was no follow through buying. Initial bias stays neutral this week first. Decisive break of 94.14 will confirm near term reversal on bullish convergence condition in 4 hour MACD. And that's after defending 91.91/3 key cluster support level, with 38.2% retracement of 72.69 (2011 low) to 103.82 (2017 high) at 91.93. In that case, further rise will likely be seen through 38.2% retracement of 103.82 to 91.01 at 95.90 to 61.8% retracement at 98.92. However, break of 92.94 near term support will indicate rejection from 94.14 and bring retest of 91.01 low instead.
TNX also hit 2.396 resistance
10 year yield also seemed to face some strong resistance from 2.396 last week. At this point, we're favoring the case that correction from 2.621 has completed at 2.034 already. Decisive break of 2.396 will pave the way to retest 2.621 high. However, break of 2.309 support will at least bring pull back to 55 day EMA (now 2.244). In that case, we'll have to assess the structure of the pull back to decide where rebound from 2.034 is finished.
Euro mixed despite Catalonia uncertainty
Euro ended the week mixed, facing some pressure from the political uncertainty between Spain and Catalonia. The independence referendum held last Sunday was not a legally recognized one, and could originally be shrugged off by investors. But the violence used by Spanish police on voters and poll stations caught the world's attention. And the tensions there quickly intensified. The Catalan government said on Friday that the official results of the referendum showed it had passed overwhelmingly. Final count showed 2,044,038 out of 2,286,217 voted for independence, with a turnout rate of 43%. The speaker of Catalonia regional parliament called a Tuesday evening session to discuss the issue. And leader Carles Puigdemont could unilaterally declare independence after that.
European leaders are generally against Catalonia independence even though some condemned the violence used by Spanish government. There are now worries on resurgence of another Euro crisis. In particular, if Catalonia does get their secession from Spain, many other separationists in EU might follow and step up their effort. They might included another region of Basque Country in Spain, the wealthy regions of Lombardy and Vento in Italy, Flanders and Wallonia in Belgium, South Tyrol in Italy. And even Scotland might come back with a second independence referendum too.
DAX hit record high
But then, it should be noted that performance of Euro wasn't that bad last week. The common currency only closed lower against Dollar, Yen and Canadian Dollar. The negative impact was also mainly seen in Spanish markets. Other markets seemed couldn't care less. German DAX surged to new record high at 12993.53 before closing at 12955.94. The development now suggests that long term up trend is resuming for 61.8% projection of 10174.92 to 12951.54 from 11868.84 at 13584.79 first. There is prospect of hitting 100% projection at 14645.46 in medium term.
Sterling tumbles on political turmoil
Sterling was sold off steeply last week and ended as the weakest major currency. There was a suddenly intensification of calls for Prime Minister Theresa May to step down, after her shambolic speech at the Conservative Party Conference. And it's reported that there were quite a number of MPs ready to urge May to resign. That comes at a very difficult time as the Brexit negotiation with EU is going on, without any notable progress to move on to trade discussions. And there are still piles of work to be done on post-Brexit trade agreements with other countries, like the US and Japan. One bookie is now offering 2/1 on May quitting this month, that is 33% chance.
BoE rate path reassessed
In addition, markets are reassessing BoE outlook after a string of weaker than expected data released. This is no change in the expectation for BoE to hike in November. And, the central bank will continue to do so barring any disasters. However, a 25bps hike would just bring interest rate back to pre-Brexit referendum level. BoE will very likely stop there afterwards, until the Brexit picture becomes clearer. That one-off rate hike should be well priced in already.
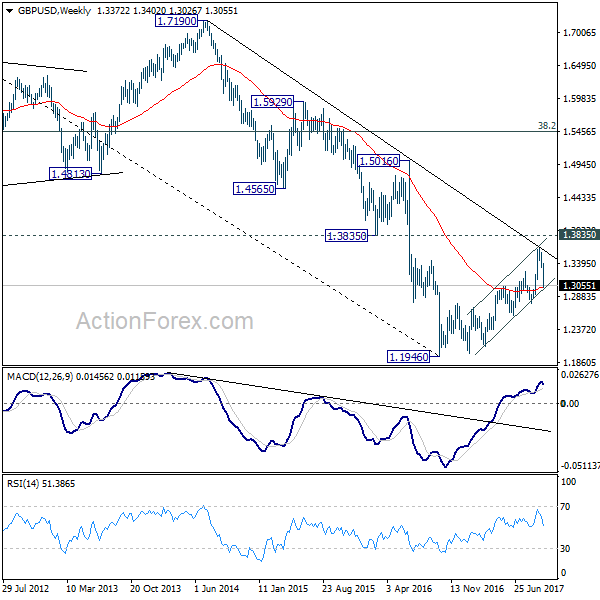
GBP/USD could have ended medium term rebound
GBP/USD was the biggest mover last week, losing -332 pts, or -2.48%. Technically, the pair is still staying in medium term rising channel. And rise from 1.1946 bottom is still mildly in favor to extend. However, it should be noted that it's limited below 1.3835 support turned resistance. And it just bounded off from a long term falling trend line. A break of 1.2773 support will now suggest that rebound from 1.1946 has completed and the long term down trend could resume. Political developments in the coming weeks will be crucial.
Trading strategies
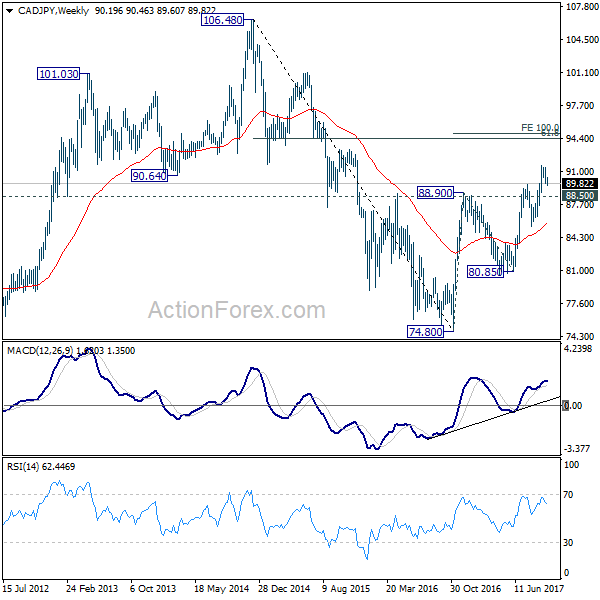
Regarding trading strategies, we're holding on to CAD/JPY long (bought at 89.90). The cross dipped mildly as near term consolidation from 91.62 extends. But overall outlook remains bullish as the long term rise from 80.85 is expected to extend towards 61.8% retracement of 106.48 to 74.80 at 94.37 and above. We'll hold on to the position with stop at 88.50. Indeed, considering the loss of momentum in USD/CAD, we'll add to our long position in case of a break of 91.62 as the up trend resumes.
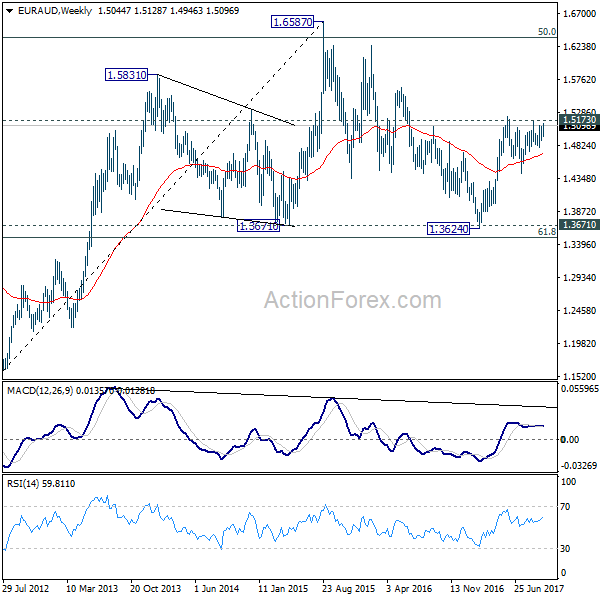
We tried to buy EUR/AUD last week but that didn't work out. Nonetheless, Aussie ended as the third weakest one, and mild near term strength is seen in EUR/AUD. There is no change in the view that RBA is nowhere near a rate hike. And Aussie was indeed weighed down by RBA board member Ian Harper's comment that he didn't rule out a rate cut. Judging from last week's price actions. AUD/USD's rise from 0.7328 should have completed at 0.8124. And near term outlook in AUD/USD is turned mildly bearish for 0.7628 fibonacci support. EUR/USD seems to be losing downside momentum ahead of 1.1661 support. Also, there is risk of a Dollar pull back as dollar index just hit 94.14 resistance. Therefore, we'll try again to buy EUR/AUD on break of 1.5173 resistance, with 1.6587 as target.
GBP/JPY Weekly Outlook
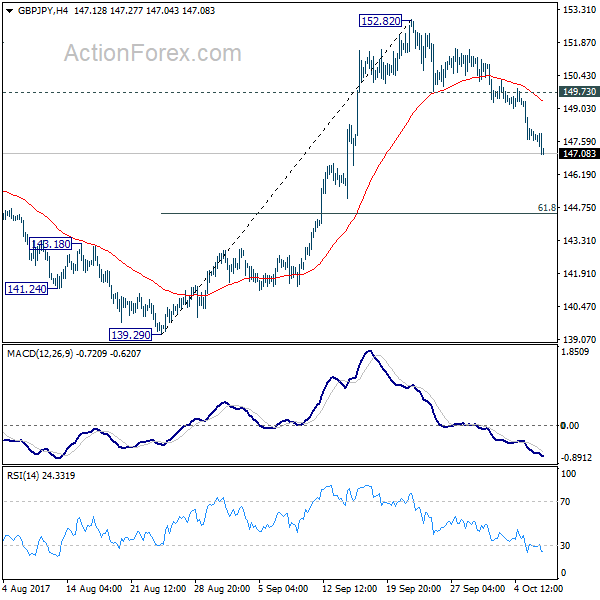
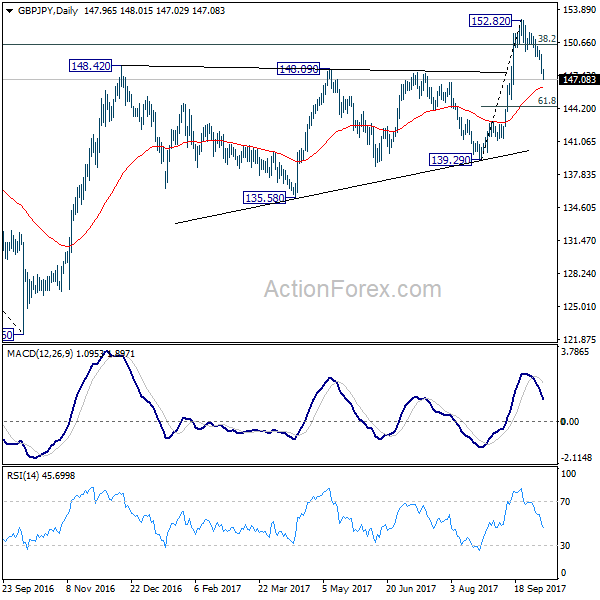
GBP/JPY dropped sharply to as low as 147.02 last week as the decline from 152.82 accelerated. Initial bias stays on the downside this week for 61.8% retracement of 139.29 to 152.82 at 144.45. Such decline is seen as a correction and we'd look for strong support from 144.45 to bring rebound. On the upside, break of 149.73 support turned resistance is needed to indicate completion of the fall. Otherwise, deeper decline will now remain in favor, even in case of recovery. Also, sustained break of 144.45 will put 139.29 key support in focus.
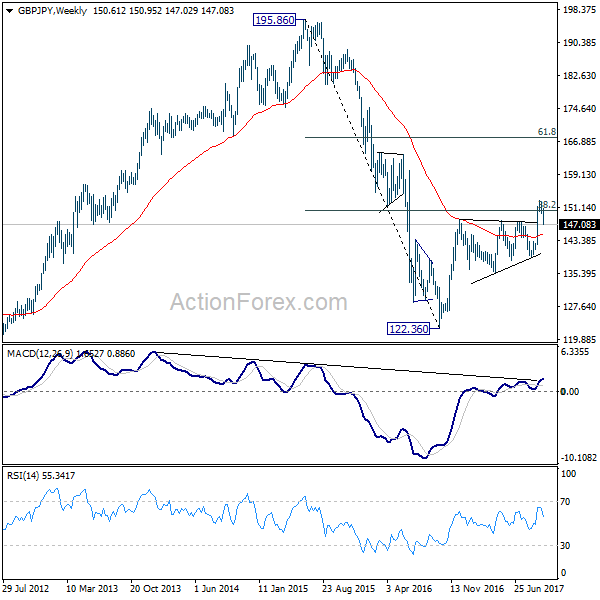
In the bigger picture, medium term rebound from 122.36 is still expected to resume after corrective pull back from 152.82 completes. Firm break of 38.2% retracement of 196.85 to 122.36 at 150.43 will carry long term bullish implications. In that case, GBP/JPY could target 61.8% retracement at 167.78. However, break of 139.29 will indicate rejection from 150.43 key fibonacci level. And the three wave corrective structure of rebound from 122.36 will argue that larger down trend is resuming for a new low below 122.26.
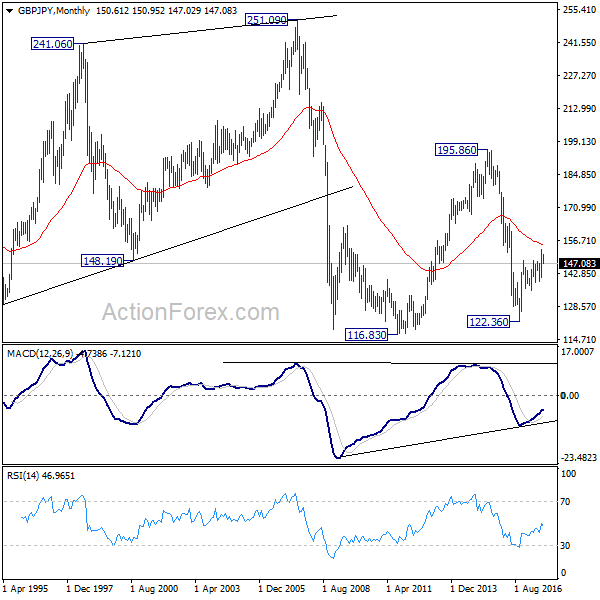
In the longer term picture, current rebound argues that the down trend from 195.86 (2015 high) has already completed at 122.36. Focus is now on 55 month EMA (now at 155.14). Firm break there will suggest that rise form 122.36 is developing into a long term move that target 195.86 again. And, price actions from 116.83 (2011 low) is indeed a sideway pattern that could last more than a decade. However, firm break of 139.29 will suggests that the long term down trend is still in progress and could break 116.83 low ahead.
Eco Data 10/13/17
[php_everywhere] [/php_everywhere]
Eco Data 10/12/17
[php_everywhere] [/php_everywhere]
Eco Data 10/11/17
[php_everywhere] [/php_everywhere]
Eco Data 10/10/17
[php_everywhere] [/php_everywhere]
Eco Data 10/9/17
[php_everywhere] [/php_everywhere]
Weekly Economic and Financial Commentary: Hurricanes Harvey and Irma Blow Payrolls Off Course
U.S. Review
Hurricanes Harvey and Irma Blow Payrolls Off Course
- Nonfarm payrolls contracted for the first time since 2010 as Hurricanes Harvey and Irma disrupted work and routine hiring. Even though a record number of people were unable to work due to the weather, the unemployment rate fell to 4.2 percent amid a curiously strong rise in the household measure of employment.
- The ISM manufacturing and nonmanufacturing indexes hit multi-year highs in September. While some of the strength can be traced to longer supplier delivery times from storm disruptions, production, new orders and employment improved in both surveys.
Hurricanes Harvey and Irma Blow Payrolls Off Course
Employment contracted for the first time in seven years last month as Hurricanes Harvey and Irma disrupted work and typical hiring. Nonfarm payrolls contracted by 33,000 jobs in September, led by a 111,000 decline in the leisure & hospitality sector. Average hourly earnings rose a stronger-than-expected 0.5 percent, but the average wage last month was flattened by the drop in the low-paying leisure & hospitality industry.
Roughly 1.5 million people reported that they were unable to work during the survey reference period, which was the week that Hurricane Irma hit Florida. Yet paradoxically, the number of people defined as employed last month jumped by 906,000. That was the biggest one-month increase since 2013 and more than four times the average over the past year. Even with an increase in labor force participation, that pushed the unemployment rate down to 4.2 percent.
The household survey can be even more volatile than the payroll survey given its small sample size (about 60,000 households) so monthly readings can exaggerate the trend. Given that September conditions were particularly atypical, we have a hard time taking the drop in the unemployment rate and rise in participation at face value this month.
The manufacturing sector looks to have been relatively unshaken by the recent storms. Factory orders for August rose 1.2 percent in August amid strong demand for durable goods. Nondefense capital goods order ex-aircraft are now up 7.2 percent on a three-month average annualized basis and point to solid equipment spending in the months ahead.
The timelier ISM manufacturing index suggests the positive momentum carried into September. At 60.8, the index rose to its highest level since 2004. Some of the headline's gain was attributable to longer supplier delivery times—usually a sign of growing demand at suppliers, but in the most recent month lengthened by supply chain disruptions. Nevertheless, supplier delivery times have been lengthening since the start of the year and look to have encouraged more hiring. The employment index rose to a six-year high and is consistent with manufacturing payrolls having risen by an average of 9,700 since July.
Production looks set to remain strong with the new orders index coming in above 64. We suspect the auto sector is providing some temporary support as Harvey and Irma have generated the need to replace vehicles. Auto sales jumped to an annualized rate of 18.5 million units from a two-and-a-half year low in August.
While the manufacturing sector has shifted into a higher gear this year, construction activity has slowed. The o.5 percent rise in August construction outlays came on the heels of a 1.2 percent pullback, which was twice as steep as what was initially reported. Elsewhere outside the manufacturing sector, however, activity continues to expand. The ISM non-manufacturing index leapt to a new cycle in September. The pickup was supported by rising current activity, new orders and employment, but also longer supplier delivery times.
U.S. Outlook
CPI • Friday
Markets and FOMC members will closely be watching the September CPI release next Friday. After three months of lowerthan- expected inflation readings, the CPI index came in higher than what markets forecasted in August. The September reading has significant monetary policy implications as the FOMC prepares to continue to raise rates. On a year-over-year basis, core inflation continues to look rather anemic. Ex-food and energy, prices were up 1.7 percent over the past 12 months. Following the August gain, however, the recent trend looks stronger; over the past three months, the core index has risen at a 1.9 percent annualized pace.
August's strong gain should help alleviate concerns among Fed members that the slowdown in inflation that began in the spring is set to continue. A strong September print would further ease inflation worries and make a December rate hike more likely.
Previous: 0.4% Wells Fargo: 0.6% Consensus: 0.6% (Month-over-Month)
Retail Sales • Friday
We expect retail sales to grow 1.7 percent in September following a 0.2 percent contraction August, month over month. August's contraction can largely be traced to Hurricane Harvey's impact, with most store categories showing steep declines. Auto sales experienced the sharpest drop with sales of motor vehicles and parts declining 1.6 percent. The decline in auto sales eclipsed the boost from the 2.5 percent rise at gas stations.
For September, we expect building supply stores to have much stronger sales as Houston and the entire state of Florida rebuild and recover from major back-to-back storms. The data in September's release are likely to contain Harvey-related noise, which will make gauging the actual strength of the consumer more difficult.
Previous: -0.2% Wells Fargo: 1.7% Consensus: 1.4% (Month-over-Month)
Business Inventories • Friday
Business inventories rose for a third consecutive month in July and look poised to add to third quarter GDP. Next Friday, August inventory data is slated to be released.
Although we only have one month of the quarter's data in, we expect inventories will be additive to GDP in Q3. As we have highlighted before, it would not take much of an increase in real inventories to provide a significant boost to GDP following two quarters of scant stock building. We are currently penciling in a $40 billion annualized increase, which would add 0.8 percentage points to topline GDP growth. Given the late stage of the business cycle, it is not altogether shocking that we have witnessed more caution on the part of businesses recently. That caution is manifested in the seven times in the past nine quarters in which inventories have been a drag on growth. Friday's release will be very telling for the direction inventories will push/pull GDP in Q3.
Previous: 0.2% Wells Fargo: 0.6% Consensus: 0.4% (Month-over-Month)
Global Review
Soft Consumer Numbers in Australia
- Australia's Reserve Bank (RBA) kept rates on hold this week. The latest data for retail sales substantiated the RBA's recent warnings about the sustainability of consumer spending amidst elevated consumer debt. Not only did Australian retail sales fall in August, the initial flat reading for July was revised to show a decline.
- The latest survey data offer mixed signals for business activity in the United Kingdom.
- After a strong start to the year, a slowdown in the pace of hiring in Canada is consistent with our outlook for slower Canadian growth in the second half.
RBA's Fears Come True With Consumer Spending Slip
The Reserve Bank of Australia (RBA) has kept its official cash rate at 1.5 percent for a little over a year now. The RBA is faced with balancing rising consumer debt amidst a run-up in home prices. Although there have been some signs of firming in the Aussie economy, a recent miss in consumer spending figures highlights the pressure on many Aussie households at present. We learned this week that Australian retail sales fell 0.6 percent in August which follows a smaller decline in the prior month. Although the RBA meeting occurred before the retail sales print hit the wire, policymakers at the Bank have been highlighting the unsustainability of household debt in recent communications. With inflation still low and wobbly fundamentals in housing, we still see the RBA on hold well into 2018. Going into the week, one could have reasonably expected the RBA to indicate a tightening bias. However after this week's lousy retail sales figures, which included a downward revision to prior data, one board member mentioned to a U.S. media outlet late in the week that another rate cut cannot be ruled out.
Business Activity in the United Kingdom
Speaking of central banks, the Bank of England is on hold as well and we expect it will refrain from raising rates until after the turn of the year. That accommodative monetary policy stance is helping to underpin economic activity in the United Kingdom, but some measures of business spending have softened. Until some of the uncertainty surrounding the Brexit process is cleared up, businesses may take a "wait-and-see" approach which could hinder investment spending.
Earlier this week, the manufacturing as well as the service sector PMIs for the United Kingdom were released. While both measures have bounced off their post-Brexit lows, there was a sharper recovery on the manufacturing side, perhaps reflecting the boost from the earlier decline in the value of the British pound. As the currency has retraced some of its lost value in recent months, the pace of expansion in the manufacturing sector has moderated. The U.K. manufacturing PMI slipped to 55.9 in September from 56.7 reading in the prior month. The U.K. services PMI rose slightly more than expected to 53.6.
Canadian Employment Friday
Thanksgiving comes early in Canada. The Toronto Stock Exchange and Canadian banks will be closed on Monday of this coming week in observance of the Canadian holiday. But the September employment figures for Canada hit the wire at the same instant that it did in the United States.
Over the past year or so, Canada's labor market has been adding jobs at about as fast a rate as it has at any point in the past decade. While monthly jobs number can be notoriously volatile in Canada, the 6-month moving average plotted in the bottom graph shows sustained job growth north of 25K for the better part of the past year. September jobs numbers were a bit softer at 10K due to a loss of momentum in the third quarter. This is consistent with our expectation for growth in Canada to moderate in the second half.
Global Outlook
U.K. Industrial Production • Tuesday
After a strong finish to 2016, industrial production growth in the United Kingdom has languished for most of 2017. A weak pound has likely been a tailwind for British manufacturers, as have the stronger growth environments in the global economy generally and the Eurozone specifically. However, the uncertainty related to the ongoing Brexit negotiations has likely been an offsetting headwind as some businesses delay making capital investments until there is more clarity. Construction output, which is also reported next Tuesday, has fallen in four straight months, with another decline in August expected by the Bloomberg consensus.
That said, manufacturing output in the U.K. increased in July for the first time in 2017. For August, the Bloomberg consensus expects a 0.3 percent gain in manufacturing output and a 0.2 percent increase for industrial production as a whole, which, if realized, would mark the first back-to-back monthly gains since late 2016.
Previous: 0.4% Consensus: 0.9% (Year-over-Year)
Mexican Industrial Production • Thursday
Industrial production growth in Mexico was weak in July, declining 1.0 percent over the month and 1.6 percent over the year. Construction, mining and utilities output all declined in the month, although manufacturing production managed to eke out a 0.3 percent gain. The all-important automobile sector has helped carry industrial production growth in Mexico; automobile, light trucks and parts production increased 9.8 percent on a year-earlier basis. Production in this sector is decelerating, however, as auto demand has softened in the United States, which generates most of the demand for Mexican autos.
The threat of NAFTA renegotiation continues to loom in the background for the Mexican economy, but thus far economic growth has managed to hold relatively steady despite a sharp depreciation in the peso that only began to reverse itself earlier this year and headwinds related to NAFTA uncertainty.
Previous: -1.6% Consensus: -0.5% (Year-over-Year)
Eurozone Industrial Production • Thursday
Unlike the United Kingdom, industrial production in the Eurozone has been accelerating of late, reaching 3.2 percent year-over-year in July. Encouragingly, although the July monthly gain was just 0.1 percent, output in cyclically-sensitive industries such as capital goods and durable consumer goods rose 0.8 percent and 0.7 percent, respectively. The gains have coincided with a continued improvement in the survey data; the purchasing managers index for Eurozone manufacturers touched 58.1 in September, the highest reading since February 2011.
In the policy statement that followed its September meeting, the Governing Council of the European Central Bank acknowledged that the economic expansion in the euro area "continues to be solid and broad-based across countries and sectors." We look for the Governing Council to announce a further reduction in its monthly asset purchase rate at its October 26 meeting.
Previous: 3.2% Consensus: 2.6% (Year-over-Year)
Point of View
Interest Rate Watch
Squeeze Play
Interactions between monetary policy intentions and the expected pattern of federal deficits represent a squeeze play on financial markets as we look ahead into 2018 and develop our annual outlook for next year.
Inflation and Fed Funds Squeeze
Looking ahead, the spread between the pace of inflation, measured by the PCE, and the Fed funds rate has diminished significantly over the last year as illustrated in the top graph. This narrowed margin indicates that, looking into 2018, the real Federal funds rate will move into positive territory, and we have not experienced positive real short-term rates since the 2005-2007 period. As a result we are cautious on the pace of economic growth if 1) inflation does not accelerate but 2) the FOMC pursues its current dot-plot indicated path for the funds rate.
Fed Balance Sheet and Federal Deficits
As illustrated in the middle graph, by the middle of 2018 and through 2019, the Fed's intention to shrink its balance sheet will imply that some additional U.S. Treasury issuance will hit the market relative to the past. The issue comes with the rising projection of federal deficits/financing from the Congressional Budget Office. The conflict is clear; rising debt supply in the face of declining Fed demand.
Federal Debt—At Normal Interest Rates?
As illustrated in the bottom graph, since 1982, the growth in debt has been a greater issue for the government sector than for the nonfinancial corporate sector. Over that period, government debt has grown from 40 percent to 100 percent of GDP while nonfinancial corporate debt has moved from 30 percent to 45 percent. Meanwhile, the severe correction in the household debt situation since 2008 is fairly clear.
Moreover, federal debt is not meanreverting, that is, they are not returning to a steady percentage of GDP. One possible implication of this debt burden is that any downturn in the economy would likely be accompanied by a rising debt burden.
Credit Market Insights
Homeownership Rates Fall Further
Homeownership rates continued to drop across broad demographic groups from 2013 to 2016, according to the triennial Survey of Consumer Finances. Nationally, the percent of families owning a primary residence fell 1.5 percentage points to 63.7, marking continuous declines since the 2007 survey. However, the most recent quarterly data shows homeownership rates stabilizing, so 2016 may be a bottom.
Of note is the breadth of homeownership declines across demographic groups, whether by age, region, income or family structure. Explanatory factors include tighter lending standards, reduced affordability from rising home prices and a lack of supply of new housing in desirable markets. In addition, rising student loan debt and delayed family formation mean that younger buyers in particular are entering the housing market at historically slower rates. Only 33.1 percent of families under age 35 owned a home in 2016, compared to 41.6 percent in 2004.
Some of the only groups to see increased homeownership rates in recent years are families in rural areas and above age 75. Housing outside metro areas has remained more affordable and older Americans are increasingly choosing to age in place, which can help explain these trends.
Looking forward, wage gains stemming from a tightening labor market and families aging into cohorts more likely to own homes may support homeownership rates, or at least keep them stabilized.
Topic of the Week
Tax Details Finally Begin to Emerge
Last week, top Republican officials released their proposal to reform the tax code. Highlights of the plan included a doubling of the standard deduction, a consolidation of current tax rates to three brackets of 12 percent, 25 percent and 35 percent and the removal of "most" deductions except home mortgage interest and charitable contributions. On the business side, the proposal lowers the top corporate rate to 20 percent, introduces full expensing of capital investments for "at least five years" paired with a "partial limitation" of net interest expense for corporations. The proposal also creates a 25 percent rate for pass-through businesses.
Our readers should bear in mind that last week's proposal is just that: a proposal that has no binding impact. This plan is an opening bid that will likely have multiple iterations to come, just as occurred with the Affordable Care Act repeal-and-replace effort.
In our view, the likelihood of this proposal passing in its current form is unlikely. The real challenge boils down to this: the Republican plan is aggressive in its tax cutting efforts, making the plan very costly in the absence of revenue raisers, which have yet to be fully fleshed out and will likely raise some strong policy disagreements. We maintain the view that the only provisions likely to become law are a doubling of the standard deduction, an increase in the child tax credit, a lowering of the corporate rate to 25 percent and a repatriation tax holiday on corporate profits.
As of this writing, the House has passed a budget resolution and the Senate Budget Committee has advanced their version, with a full Senate vote expected in a few weeks. They will next need to come together and hammer out the differences between the two bills to proceed with tax reform through the reconciliation process. Once complete, the respective tax writing committees can get to work on drafting legislation, with the goal of producing a bill roughly one month from now. Stay tuned. For more on our tax outlook, see "Our Fiscal Policy Assumptions: An Update" available on our website.
The Weekly Bottom Line: Navigating Through Weather-Induced Distortions
U.S. Highlights
- Recent U.S. economic data has been distorted by hurricanes with the volatility likely to persist in the coming weeks. This theme came across this week, with auto sales, ISM indices, trade and payrolls all impacted.
- Auto sales surprised to the upside, as affected consumers begun to replace flood-damaged vehicles. Meanwhile, ISM indices surged, supported by slower supplier deliveries, with some reversal likely ahead.
- The jobs report surprised to the downside, with payrolls falling by 33k, but did include positive elements, such as a declining jobless rate and accelerating wage growth. These reinforced the likelihood of a rate hike by year-end.
Canadian Highlights
- Signs that Canada's economy is cooling increased this week with data on international trade that showed Canadian export volumes falling 1.9% in August, the third straight month of decline.
- Still, the Canadian job market keeps on chugging. The economy experienced its 10th straight month of job growth with 10k jobs added in September. Since the start of the year, the unemployment rate has fallen 0.7 percentage points and, at 6.2%, is at or close to its long-run structural rate.
- The question of how quickly the Canadian economy can grow is on the minds of monetary policymakers. In a speech this week, Deputy Governor Leduc put his estimate for potential at 1.5%, the top end of the Bank of Canada's range of 1.0% to 1.6%.
U.S. - Navigating Through Weather-Induced Distortions
Recently published U.S. economic data has been distorted by Hurricanes Harvey and Irma with the volatility likely to persist in the coming weeks. This theme has been highlighted by this week's releases, with auto sales, ISM indices, trade, and this morning's payrolls all impacted by mother nature. Despite the distortions, data this week was constructive, and along with the chance of tax reform has lifted U.S. stock indices to all-time highs.
Much of this week's economic data surprised to the upside. Both ISM indices soared to their highest levels since the mid-2000s. The gains among their subcomponents were broad-based, but the readings were partly supported by slower supplier deliveries (Chart 1) on account of transport infrastructure closures and factory outages. The index typically rises with higher demand, but in this case it increased due to supply constraints, with some reversal likely in the coming months. On the other hand, the surge in auto sales to an impressive 18.5 million annualized units was related to consumers in Texas and Florida replacing flood-damaged vehicles. Alongside the rise in gasoline prices, the increase in auto sales should materialize in a healthy retail sales report next week. Further out, we anticipate replacement demand for vehicles to continue to prop up sales, boding well for durables and overall consumer spending through the end of 2017.
But not all data surprised to the upside. While the nominal trade deficit continued to narrow, export volumes retreated for the second consecutive month. The fact that petroleum exports fell sharply suggests that the Gulf refinery outages played a significant role in reducing export volumes. Having said that, import volumes also retreated as ships were unable to dock and unload at many Texas ports.
The jobs report was another example of data being affected by hurricanes. Payrolls declined by 33k in September, marking the first contraction since 2010. Results from the prior two months were also revised down a total of 38k, but the 6-month trend was still a healthy 153k pace prior to the recent anomaly. Still, the September report offered positive elements as well. The jobless rate fell to a 16-year low of 4.2%, while wage growth accelerated to 2.9% y/y (Chart 2). July and August were also revised higher to 2.6% and 2.7% respectively from 2.5% y/y initially. The accelerating trend in compensation is very encouraging and bodes well for the inflation outlook. Still, September's results should be taken with a grain of salt, with some of the wage pressures related to hurricane distortions.
All told, apart from the decline in nonfarm payrolls, the stream of data this week has been better than expected. Importantly, looking past the transitory factors, the economy appears to be on a solid footing. Growth should come in above 2% annualized in the third quarter and near 3% to cap off the year. Declining unemployment and rising wages further reinforce the likelihood that the Fed will hike once more by year end, particularly if these translate into firmer inflation readings. So far, markets are increasingly comfortable with this narrative, with the probability of such an outcome rising to around 90% this morning.
Canada - Coming Back to Earth
Canada's economy is cooling from its red hot pace of activity in the first half of the year. This was confirmed this week in data on international trade that showed Canadian export volumes falling 1.9% in August, the third straight month of decline (Chart 1). This data is volatile however, and we anticipate a rebound in the months ahead. Still, with imports eking out small gains in each of the past two months, net-exports are likely to subtract from economic growth in the third quarter, which continues to track slightly above 2.0%.
The softening near-term economic outlook struck a blow to the Canadian dollar, which fell more than half a cent against the U.S. dollar (to just under $0.80 U.S.) as of writing. With growth cooling, the Bank of Canada may be less anxious to raise the overnight rate, satisfied for the time being that the removal of emergency level cuts is enough to take some wind out of the economy's sails.
Without a doubt, the question of how quickly the Canadian economy should or can grow is firmly on the minds of Canada's monetary policymakers. This week, a speech by Deputy Governor Sylvain Leduc noted the deceleration in productivity growth in Canada and offered that a decline in the rate of new firm creation (and destruction) bears some of the blame. As he explained, a key source of productivity growth is the replacement of old firms (and ideas) with new ones. A slowdown in the rate of entry limits this key source of productivity growth.
The good news is that firm entry appears to have stabilized (Chart 2), which would be good news for Canada's productivity prospects. Measuring the potential growth rate of the economy in real-time is difficult. The recent underperformance in inflation suggests that perhaps Canada's productive potential isn't as meagre as it has been made out to be. Indeed, Deputy Governor Leduc put his estimate for potential at 1.5% at the top end of the Bank of Canada's range of 1.0% to 1.6%.
The notion that Canada is awash in underutilized resources, however, is hard to square with the data on the Canadian labour market. In September, the Canadian economy experienced its 10th straight month of job growth (+10k). Since the start of the year, the unemployment rate has fallen 0.7 percentage points and, at 6.2%, is at or close to its long-run structural rate. Moreover, any worries about the composition of job growth favouring part time work should be assuaged by September's report in which full-time jobs rose 112k and part-time fell 102k. This was enough to push aggregate hours worked up 2.4% year-on-year, well above its estimated trend rate of under 1%.
All this means that even as the Canadian economy comes back down to earth, growth of around 2.0% is likely sufficient to put gradual upward pressure on inflation and keep the Bank of Canada in tightening mode. Still, as long as there is some uncertainty around the potential economic growth rate as well as the impact of hikes already in the pipeline, the central bank can go slow. We still expect one more hike before this year is out, but anticipate a slower pace of hikes next year, with just two more before the end of 2018.
U.S.: Upcoming Key Economic Releases
U.S. Consumer Price Index - September
Release Date: October 13, 2017
Previous Result: 0.4% m/m, core 0.2% m/m
TD Forecast: 0.6% m/m, core 0.2% m/m
Consensus: 0.6% m/m, core 0.2% m/m
We expect headline CPI inflation to pick up to 2.3% y/y in September, with prices up 0.6% m/m. Energy prices will exert an even larger contribution this month led by an 11% bounce in gasoline prices. Food prices could also see stronger gains from crops affected by Hurricane Irma. But outside of food and energy, we expect price impacts to be minimal as was the case in past hurricane episodes. Nonetheless, we expect a solid 0.2% print in the core CPI, keeping the core inflation rate stable at 1.7% y/y with upside risk for a firmer 1.8% pace. The September data will be widely scrutinized by Fed officials, particularly by those who are still on the fence over a December rate hike based on the past disappointment in inflation this year. A second consecutive 0.2% rise in core inflation will help build the conviction that price pressures are finally picking up as transitory factors dissipate.
U.S. Retail Sales - September
Release Date: October 13, 2017
Previous Result: -0.2%, ex-auto 0.2%
TD Forecast: 1.7%, ex-auto 1.1%
Consensus: 1.4%, ex-auto 0.9%
We expect a strong 1.7% increase in September retail sales, reflecting a hurricane-induced surge in demand concentrated in motor vehicles. New vehicle sales massively beat expectations in September, hitting a 12-year high of 18.5m units, or a 15% m/m increase, as consumers affected by the twin hurricanes looked to replace their damaged vehicles. Industry estimates suggest that sales have further room to run; over 500k vehicles were damaged by the storms, propping up demand at least through November. Meanwhile, the sharp jump registered in gasoline prices following Hurricane Harvey should lend a boost to gasoline station receipts. Other categories such as building materials could see a boost as well, such that we see scope for a 0.5% rise or higher in the core control group (excluding auto, gasoline station, food services and building material sales). The report would leave Q3 real PCE tracking near a 2% pace.
Canada: Upcoming Key Economic Releases
Canadian Housing Starts - September
Release Date: October 5, 2017
Previous Result: -$3.04bn
TD Forecast: -$2.7bn
Consensus: N/A
We look for housing starts to moderate to 212k units in September vs 223k in August. That would leave Q3 as a whole up 6% over Q2. We look for the September dip to be led by multi-family units, with scope for higher single-family starts to partially offset. An overall drop in September is also likely to be driven by starts in Ontario, which came back strongly in the prior two months.
Dollar Flying After NFP Shows Strong Wage Gains
Hurricanes Hit Number of Jobs but Not Wages
The USD dollar is higher across the board against major pairs. The American currency posted weekly gains against major pairs, but had a mixed performance Friday in the aftermath of the release of the U.S. non farm payrolls (NFP) report. The expected impact of hurricanes in September manifested itself in the first negative NFP reading since 2010. The US economy lost 33,000 jobs in September, but wages surprised with a 0.5 percent gain. The focus of investors has shifted from the headline number of jobs to inflation indicators, such as wages. The strong gain was quickly priced in with the CME FedWatch tool showing a higher than 90 percent probability of a rate hike in December.
The next hurdle for a December rate lift by the U.S. Federal Reserve will come with the release of retail sales and consumer price index (CPI) data on Friday, October 13 at 8:30 am EDT. Retail sales were weaker than expected in September with a contraction in the headline number. Inflation on the other hand met the forecast and given the focus will be on the CPI for clues that validate or weaken a case for a Fed December hike.
The pound has fallen to a one month low as Prime Minister Theresa May, has lost the confidence of a large group of Conservative MPs with a potential ouster in the cards. Disappointing data and political uncertainty are anticipated to continue next week for sterling despite hawkish comments from Bank of England (BoE) policy makers. The euro remains under pressure from the after shocks of the Catalonia independence referendum and awaiting further developments.
The EUR/USD lost 0.75 percent in the last five days. The single pair is trading at 1.1693 in a week that saw the resurgence of the USD with strong economic releases, Fed members supporting a rate hike and the rise in wages putting some inflationary pressure. European data was mixed by contrast with the biggest topics once again turning to political uncertainty. The Catalonia independence referendum and the response by the Spanish government have brought the fragility of the EU into focus once again. Brexit talk and the political infighting within the Conservative party in the UK also weighted on the euro versus the greenback.
US indicators will dominate the calendar in the week from October 9 to 13. FOMC member speeches, the release of the minutes from the September FOMC meeting, US producer price index, inflation and retail sales with only the speech by European Central Bank (ECB) President Mario Draghi on Wednesday a highlight for the EUR.
The GBP/USD lost 2.67 percent this week. Cable is trading at 1.3038 with markets losing confidence in Prime Minister May and her party might be pushing to oust her. Disappointing data this week in construction and manufacturing PMIs offset comments from Bank of England (BoE) policymakers about a possible rate hike later this year. Ian McCafferty and chief economist Andy Haldane issued comments this week that supported the view of Governor Mark Carney about the economy being strong enough to remove stimulus. That is precisely the point that was put in question by the weak data and presents an issue for the BoE. After so much rhetoric to hike rates will the current trend of soft data forced them to rethink their intended rate path, or do they follow through in fear of losing credibility?
Manufacturing production data will be released on Tuesday, October 10 at 4:30 am EDT on a week with little UK indicators to guide traders. The US economic calendar is not as busy but will feature the release of the September Federal Open Market Committee (FOMC) meeting minutes on Wednesday, October 11 at 2:00 pm EDT and comments from FOMC members throughout the week. The highlight of the week for the GBP/USD will be the release of inflation and retail sales data. In the past it has proven to be a tough obstacle for a NFP driven dollar rally to survive.
Market events to watch this week:
Tuesday, October 10
- 4:30am GBP Manufacturing Production m/m
Wednesday, October 11
- 2:00pm USD FOMC Meeting Minutes
Thursday, October 12
- 8:30am USD PPI m/m
- 8:30am USD Unemployment Claims
- 10:15am EUR ECB President Draghi Speaks
- 11:00am USD Crude Oil Inventories
Friday, October 13
- 8:30am USD CPI m/m
- 8:30am USD Core CPI m/m
- 8:30am USD Core Retail Sales m/m
- 8:30am USD Retail Sales m/m
*All times EDT