Sample Category Title
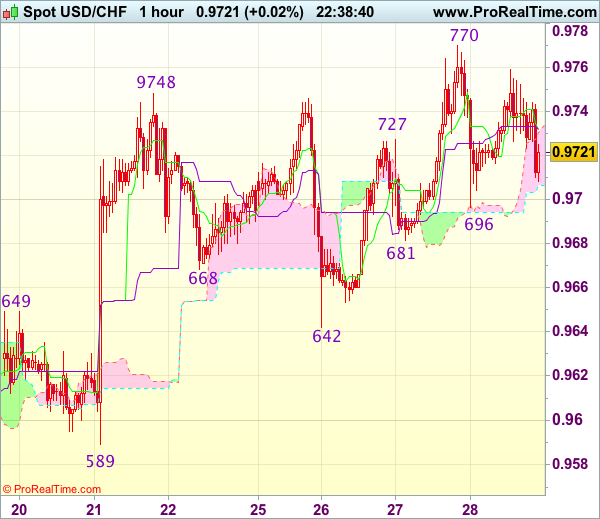
Trade Idea Wrap-up: USD/CHF – Stand aside
USD/CHF - 0.9714
Most recent candlesticks pattern : N/A
Trend : Near term up
Tenkan-Sen level : 0.9731
Kijun-Sen level : 0.9730
Ichimoku cloud top : 0.9732
Ichimoku cloud bottom : 0.9706
New strategy :
Stand aside
Position : -
Target : -
Stop : -
Although the greenback retreated to 0.9696 yesterday, as dollar found support there and rebounded, suggesting another test of resistance at 0.9770-73 cannot be ruled out, however, break there is needed to signal recent upmove has resumed and revive bullishness for the move from 0.9421 low to to extend gain to 0.9800-10 but overbought condition should limit upside to 0.9840-50.
In view of this, would not chase this rise here and would be prudent to stand aside in the meantime. Below said support at 0.9696 would suggest top is possibly formed, bring test of 0.9681 support, break there would add credence to this view, bring correction of recent rise towards support at 0.9642 which is likely to hold on first testing.
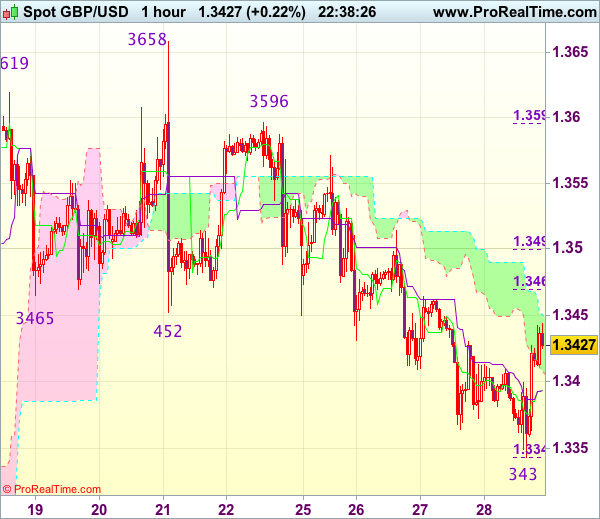
Trade Idea Wrap-up: GBP/USD – Buy at 1.3385
GBP/USD - 1.3446
Most recent candlesticks pattern : N/A
Trend : Near term down
Tenkan-Sen level : 1.3399
Kijun-Sen level : 1.3399
Ichimoku cloud top : 1.3451
Ichimoku cloud bottom : 1.3408
Original strategy :
Sell at 1.3500, Target: 1.3380, Stop: 1.3535
Position : -
Target : -
Stop : -
New strategy :
Buy at 1.3385, Target: 1.3485, Stop: 1.3350
Position : -
Target : -
Stop : -
As cable found good support at 1.3343 and has staged a strong rebound, suggesting low is possibly formed there and consolidation with mild upside bias is seen for test of 1.3465-70 (50% Fibonacci retracement of 1.3596-1.3345), however, reckon resistance at 1.3514 would limit upside and price should falter well below resistance at 1.3571, bring another decline later.
In view of this, we are looking to turn long on dips as 1.3380-85 should limit downside. Only below said support at 1.3343 would abort and signal the selloff from 1.3658 top has resumed and extend weakness to previous resistance at 1.3329, then towards 1.3300.
Eurozone Business and Consumer Confidence Surges, USD GDP Grows
Today was a busy day in regards to economic data releases. Gross Domestic Product in the US grew at 3.1% in the second quarter, slightly above the previous forecast. It is the best quarterly growth in almost two years. The economy at its core remained stable as growth in the job market and a booming stock market encouraged households to spend. According to advance economic indicator reports from the US Commerce Department, the trade deficit for US goods narrowed 1.4% and came in at $62.94 billion in August as compared to July. Exports rose 0.2% and goods imports decreased 0.3%. But the Commerce Department also warned that the data may have been affected by Hurricanes Irma and Harvey as ports were closed and caused shipment diversions and delays.
The euro received support after the European Commission earlier today released the economic sentiment indicator, which combines both the business and consumer confidence reports. Economic sentiment rose to 113 in August from 111.9 in July, the highest level its been since June 2007. The strong growth in business confidence implies that the Eurozone economy will be enjoying faster growth in the final months of the year. More confident businesses tend to invest more while households spend more freely. Increases in aggregate confidence will also give the European Central Bank some comfort as it looks to reduce its stimulus program from as early as next year. ECB's economists are also expecting 2.2% economic growth for the region. Inflation data released earlier today suggests that the inflation rate has not moved toward the target in September. Germany's consumer prices rose 1.8% compared to a year earlier and in Spain the rate of inflation slowed to 1.9% from 2% in August.
AUD/USD
AUD/USD is consolidating and trading around last month's low at 0.78072. The pair is trading below the 50- day moving average, which plays a resistance role. The relative strength index is mixed and calls for a bearish movement. As long as the price remains below 0.7887 (yesterday's high) look for further decline to 0.7798 (today's low) and 0.7755. Alternatively, above 0.7887 (yesterday's high) look for 0.7907 (last week's low) and 0.7945.
EUR/USD
EUR/USD rebounded from 1.17162 (this week's low) but the bias remains bullish. The extent of the rebound however should be limited. The downward movement is reinforced by the declining 50 day moving average and the relative strength index is also showing a bearish outlook. So, below 1.18606 (last week's low) look for further downside to 1.17163 (this week's low) and 1.16616 (last month's low). Alternatively, above 1.18606, look for 1.1900 and 1.19360 (this week's high).
NZD/USD
NZDUSD is expected to trade with a bearish outlook as the process of lower highs and lows remains intact. The 50 day moving average and 20 day moving average are still heading downward. So as long as the price remains below 0.72467 (last week's low) look for downside targets at 0.71656 (today's low) and 0.71304 (last month's low). Alternatively, above 0.72467 look for 0.7285 and 0.7305.
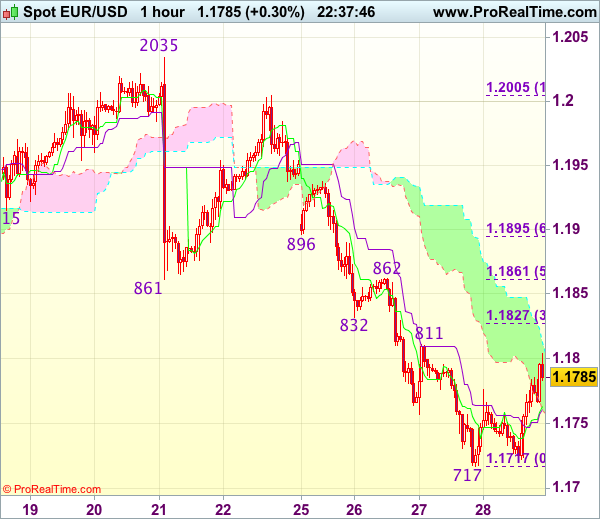
Trade Idea Wrap-up: EUR/USD – Sell at 1.1830
EUR/USD - 1.1782
Most recent candlesticks pattern : N/A
Trend : Down
Tenkan-Sen level : 1.1763
Kijun-Sen level : 1.1761
Ichimoku cloud top : 1.1813
Ichimoku cloud bottom : 1.1760
Original strategy :
Sell at 1.1810, Target: 1.1710, Stop: 1.1845
Position : -
Target : -
Stop : -
New strategy :
Sell at 1.1830, Target: 1.1730, Stop: 1.1865
Position : -
Target : -
Stop : -
As the single currency has rebounded after holding above support at 1.1717, suggesting minor consolidation above this level would be seen and recovery towards resistance at 1.1811 cannot be ruled out, however, reckon renewed selling interest would emerge around 1.1825-30 (38.2% Fibonacci retracement of 1.2005-1.1717) and bring another decline later, below said support at 1.1717 would signal the decline from 1.2093 top has resumed and extend weakness to 1.1700 but loss of downward momentum should prevent sharp fall below previous support at 1.1662 and reckon 1.1625-30 would hold, bring rebound later.
In view of this, we are looking to sell euro on recovery as previous support at 1.1832 (now resistance) should limit upside and bring another decline. A firm break above previous support at 1.1832-38 (now resistance) should hold and bring another decline later. Above resistance at 1.1862 would abort and signal low is formed instead, bring a stronger rebound to 1.1896 (another previous support).
Yen Steady Ahead of Japanese Consumer Spending, Inflation Reports
USD/JPY has posted small losses on Thursday. In North American trade, the pair is trading at 112.63, down 0.15% on the day. In the US, Final GDP impressed with a 3.1% gain, above the forecast of 3.0%. Unemployment claims jumped to 272 thousand, higher than the estimate of 269 thousand. Later in the day, Japan releases Household Spending and Tokyo Core CPI, two key indicators that could move the yen. On Friday, the US releases Personal Spending and UoM Consumer Sentiment.
The BoJ has no plans to adjust its ultra-accommodative policy, and this was reiterated in the minutes of the Bank's August policy meeting. Most policymakers remained in favor of continuing present policy, and expressed optimism that inflation levels would move higher. Is there a real basis to this positive sentiment? Inflation remains well short of the BoJ target of just below 2 percent, and in its most recent forecast, the BoJ said that this target would not be met until 2020. Still, the BoJ has so far rejected calls to lower its inflation target, so it's unlikely that the Bank will taper its radical stimulus program anytime soon. On Thursday, BoJ Governor said that with the economy continuing to expand, he expects inflation to move closer to the BoJ's inflation target of just below 2.0%.
What can we expect from the Federal Reserve with regard to interest rate policy? Fed policymakers remain divided on the hot issue of a third and final rate hike in 2017. Fed Chair Janet Yellen waded into the rate debate on Tuesday, as she sent out a surprisingly hawkish message to the markets. Yellen said that she favored gradual rate increases, and voiced confidence that inflation levels would move higher. She added that if the Federal Reserve did not continue to raise rates, the red-hot labor market could become overheated, potentially causing a recession. Yellen appeared to echo sentiments voiced by New York Fed President William Dudley, who made a strong case for raising rates on Monday. Dudley cited a soft US dollar and strong global growth as reasons why inflation would increase and also translate into stronger wage growth. Dudley said he expects inflation to reach the Fed's target of 2 percent in the "medium term", and predicted that the Fed would continue to gradually remove monetary accommodation. However, Chicago Fed President Charles Evans sent out a very different message, calling on the Fed to avoid another rate hike until wage and inflation levels moved higher. Evans said that inflation, which is running at around 1.4 percent, is too low, and wants to see "clear signs" that prices are moving higher before the Fed presses the rate trigger. For their part, the markets are more confident in a December move – according to the CME Group, the odds of a December hike are priced in at 76%, while the odds were mired below 50% just a few weeks ago.
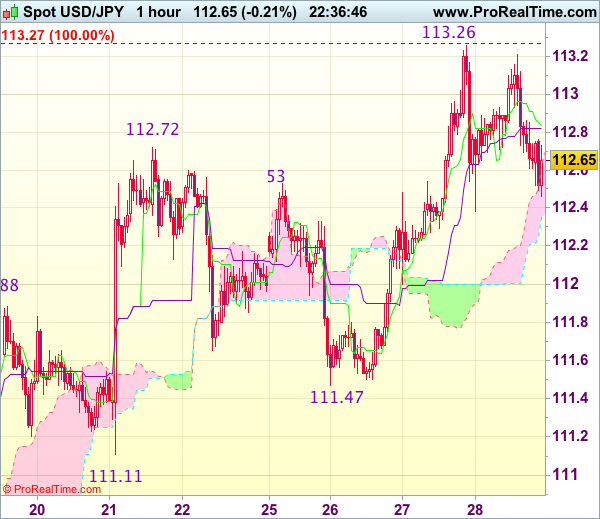
Trade Idea Wrap-up: USD/JPY – Stand aside
USD/JPY - 112.71
Most recent candlesticks pattern : N/A
Trend : Up
Tenkan-Sen level : 112.84
Kijun-Sen level : 112.82
Ichimoku cloud top : 112.63
Ichimoku cloud bottom : 112.35
New strategy :
Stand aside
Position : -
Target : -
Stop : -
As the greenback has retreated again after faltering below indicated resistance at 113.26, retaining our view that further consolidation would take place and weakness to 112.30-35 cannot be ruled out, however, break of 112.00 is needed to signal top has been formed, bring retracement of recent rise to 111.75-80 but previous support at 111.47 should remain intact, bring rebound later.
On the upside, expect recovery to be limited to 113.00 and said resistance at 113.26 should remain intact, bring retreat later. A break above this week’s high at 113.26 is needed to revive bullishness and signal recent upmove has resumed, then further gain to previous resistance at 113.58 would follow but loss of upward momentum should prevent sharp move beyond 113.75-80 and reckon 114.00-10 would remain intact. As near term outlook is mixed, would be prudent to stand aside for now.
Will Euro Appreciation Derail the Eurozone Economy?
Executive Summary
The broad-based appreciation of the euro this year raises some interesting macroeconomic questions. Specifically, will euro strength reduce export growth and thereby weigh on overall GDP growth? Will CPI inflation, which is benign already, recede further due to euro appreciation? In our view, we are still a long way away from worrying about the growth-restraining and CPIdepressing effects of euro appreciation, because the effects that the exchange rate has on export growth and CPI inflation tend to be rather modest.
Broad-Based Appreciation of the Euro in 2017
The euro has risen more than 5 percent on a trade-weighted basis this year (Figure 1). The euro has had a good run vis-à-vis the U.S. dollar, strengthening about 13 percent since the beginning of the year (Figure 2). But the euro's strength has been broad based, with the common currency up about 8 percent against both the Japanese yen and the Swiss franc and roughly 3 percent versus the British pound. A detailed explanation for the euro's appreciation is beyond the scope of this report. That said, stronger-than-expected economic data, which have prompted expectations of less accommodative ECB monetary policy going forward, undoubtedly have contributed to the rise in the value of the euro.
The focus of this report is to consider what macroeconomic effects, if any, the appreciation of the euro may have on the Eurozone.1 Will euro strength reduce export growth and thereby weigh on overall GDP growth? Will CPI inflation, which is benign already, recede further? Will the ECB, which appears poised to remove policy accommodation going forward, need to keep its quantitative easing (QE) program in place?
Exports More Sensitive to Foreign Growth than to Exchange Rate
In theory, exchange rate changes should have a meaningful effect on real GDP growth in the Eurozone as real exports of goods and services are equivalent to nearly 50 percent of real GDP in the euro area. However, these figures, which are derived from the Eurozone's GDP accounts, include trade among the 19 individual economies in the Eurozone. Because countries in the euro area share a common currency, the trade flows between these individual economies are not affected directly by exchange rate changes. Exports among the 19 individual economies of the Eurozone account for 45 percent of total exports in the euro area.2 Consequently, exports to countries that are outside the euro area, which would potentially be sensitive to exchange rate changes, are equivalent to roughly one-quarter of GDP in the euro area, not one-half as referenced previously.
How sensitive are these exports to non-Eurozone countries to changes in the exchange value of the euro? Figure 3 shows that there is some correlation between year-over-year changes in the real effective value of the euro and year-over-year growth in real exports to non-Eurozone countries. That is, depreciation of the real effective exchange rate (i.e., the inflation adjusted, trade-weighted value of the euro) tends to be associated with stronger export growth and vice versa. That said, the degree of correlation between these two variables is rather low.
However, there is a high degree of correlation between growth in real exports to non-Eurozone economies and growth in global industrial production (Figure 4). The formal statistical analysis that we conducted—details are available upon request—shows that the relationship between changes in the real exchange rate and growth in real exports are statistically significant. However, real export growth is much more sensitive to changes to global IP than it is to changes in the real exchange rate.3 Unless the recent appreciation of the euro turns into a runaway train, which we do not expect, then positive economic growth in the rest of the world, which we do anticipate, should ensure that export growth in the euro area remains positive. In short, the recent appreciation of the euro may reduce Eurozone export growth by a few tenths of a percentage point, but it is not likely to cause export growth to nosedive.
Services Mute Effect of Exchange Rate on Inflation
Everything else equal, euro appreciation puts downward pressure on import prices. If the amount of imports into the Eurozone is large enough, then lower import prices could cause consumer price inflation, which has been benign over the past few years, to recede further.4 In that regard, nominal imports currently are equivalent to 43 percent of nominal GDP in the euro area, suggesting that exchange rate appreciation could potentially lead to lower CPI inflation.
As in the case of exports, however, most individual economies in the Eurozone receive a significant amount of imports from other countries in the euro area, and these intra-Eurozone imports are not affected directly by exchange rate changes. Because Eurozone countries on average receive only half of their imports from countries that are outside the euro area, the relevant imports-to-GDP ratio for the overall Eurozone is about 20 percent or so.
There tends to be a fair degree of correlation between changes in the trade-weighted value of the euro and changes in non-oil import prices in Germany (Figure 5).5 However, changes in import prices do not appear to have much effect on both the overall and the core rate of CPI inflation in the euro area (Figure 6). Prices of services account for 45 percent of the Eurozone's consumer price index, and services tend not to be as widely imported as goods. Consequently, the euro appreciation that has occurred to date is not likely to have a marked effect on CPI inflation in the Eurozone. The euro would need to strengthen significantly further for it to have a meaningful effect on CPI inflation in the Eurozone.
Conclusion
After trending lower between 2010 and 2015, the trade-weighted value of the euro reversed course in 2016 and has risen noticeably this year. Furthermore, our currency strategy team looks for further modest gains in the euro vis-à-vis the U.S. dollar and many other major currencies going forward. In theory, euro appreciation could weigh on real GDP growth in the Eurozone if it leads to slower growth in real exports of goods and services in the euro area. It could also depress consumer price inflation even further if it causes import prices to level out and potentially decline.
In our view, we are still a long way away from worrying about the growth-restraining and CPI-depressing effects of euro appreciation. For starters, the common currency that is shared by the 19 member countries of the euro area means that there is a significant amount of trade in the Eurozone that is not affected by exchange rate changes. Moreover, the effects that the exchange rate has on export growth and CPI inflation tend to be rather modest. Yes, real appreciation in the euro exchange rate is associated with slower export growth in the Eurozone, everything else equal. But the effects of economic growth in the rest of the world are significantly more important for real export growth than is the real exchange rate. As long as the global economy continues to expand at a healthy pace, which we expect, then real export growth in the euro area likely will remain positive.
Similarly, the effects of the exchange rate on CPI inflation tend to be rather small as well. Changes in the nominal effective exchange rate can change import prices in the opposite direction (i.e., declines in the exchange rate are associated with increases in import prices and vice versa), but the effects on import price inflation are not one-for-one. Furthermore, services comprise one-half of the consumer price index, and services tend not to be imported to the same extent as are goods. Euro appreciation could eventually shave off a few tenths of a percentage point off of CPI inflation in the Eurozone. However, as long as the economic expansion in the euro area remains healthy, which we expect, inflation should slowly trend higher over time. Consequently, we look for the ECB to dial back its bond purchases further in coming months and for it to commence a slow pace of rate hikes in late 2018.
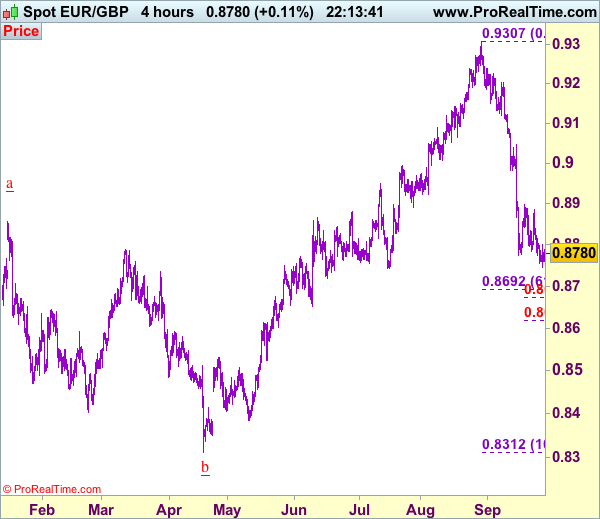
Trade Idea: EUR/GBP – Sell at 0.8890 or buy at 0.8670
EUR/GBP - 0.8781
Original strategy :
Sell at 0.8890, Target: 0.8740, Stop: 0.8930
O.C.O.
Buy at 0.8670, Target: 0.8820, Stop: 0.8610
Position : -
Target : -
Stop : -
New strategy :
Sell at 0.8890, Target: 0.8740, Stop: 0.8930
O.C.O.
Buy at 0.8670, Target: 0.8820, Stop: 0.8610
Position : -
Target : -
Stop : -
Although the single currency continued trading defensively after breaking below support at 0.8774 and near term bearishness remains for the selloff from 0.9307 top to extend weakness to 0.8690-95 (61.8% Fibonacci retracement of 0.8312-0.9307), loss of downward momentum should prevent sharp fall below 0.8670-75 (50% projection of 0.9226-0.8774 measuring form 0.8899) and bring rebound later. Above 0.8815-20 would bring recovery to 0.8850, however, resistance at 0.8899 should cap upside and bring another decline later.
In view of this, whilst we are looking to sell euro on recovery, we are inclined to turn long on subsequent decline as 0.8670-75 should limit downside. Below 0.8640-50 would risk weakness to 0.8600-10 but sharp fall below there should not be repeated and risk remains for another rebound to take place soon.
Our preferred count is that, after forming a major top at 0.9805 (wave V), (A)-(B)-(C) correction is unfolding with (A) leg ended at 0.8400 (A: 0.8637, B: 0.9491 and 5-waver C ended at 0.8400. Wave (B) has ended at 0.9413 and impulsive wave (C) has either ended at 0.8067 or may extend one more fall to 0.8000 before prospect of another rally. Current breach of indicated resistance at 0.9043 confirms our view that the (C) leg has ended and bring stronger rebound towards 0.9150/54, then towards 0.9240/50.
WTI Continues North after Kurdish Referendum, But for How Long?
Oil prices gained notably on Monday, amid potential supply disruptions. Turkish President Erdogan said he is willing to "close the tap" and cut oil flows from Iraq's Kurdish region to the rest of the world, after the Iraqi Kurds held an independence referendum. The precious liquid edged even higher during the European morning Thursday, perhaps due to another comment from Turkey that it will deal only with the central Iraqi government for all crude that passes through a Turkish pipeline.
We see the case for oil prices to remain supported for a while more, given that Turkey could follow up its threats and restrict the Kurds from accessing that pipeline. Something like that could eliminate roughly 500,000 barrels/day from the market. In addition, there is also the risk of military conflict, something Erdogan said is on the table on Monday.
WTI edged north during the European morning Thursday, after it hit support at the 52.00 (S2) line. Then, the price emerged above 52.50 (S1) to stop fractionally below the 53.00 (R1) resistance zone. The price structure on the 4-hour chart continues to suggest a short-term uptrend and as such, we see the possibility for the bulls to remain in the driver's seat for a while. A break above the 53.00 (R1) hurdle may set the stage for more upside extensions, perhaps towards the 54.00 (R2) territory, marked by the peaks of the 7th of March and 12th of April.
Looking at our short-term momentum studies, we see that both of them support the case for further near-term advances. The RSI turned up and now looks ready to cross above its 70 line, while the MACD, already positive, re-crossed above its trigger line and is now pointing up.
As for the bigger picture, even if WTI continues to trade north for a while, we remain skeptical on whether a healthy long-term uptrend can be established. The price is now trading within the longer-term sideways range, between 51.50 (S3) and 55.30 (R3), where we believe US shale producers may be attracted to increase production. This could put a lid on any future gains.
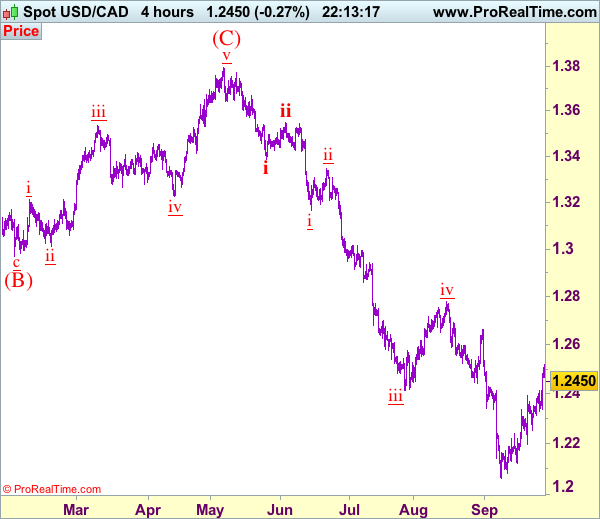
Trade Idea: USD/CAD – Target met and buy at 1.2360
USD/CAD - 1.2456
Trend: Down
Original strategy :
Bought at 1.2285, met target at 1.2450
Position: - Long at 1.2285
Target: - 1.2450
Stop: -
New strategy :
Buy at 1.2360, Target: 1.2560, Stop: 1.2300
Position: -
Target: -
Stop:-
As the greenback surged again after finding renewed buying interest at 1.2329 and reached our indicated upside targets at 1.2450 (our long position entered at 1.2285 made 165 points profit), adding credence to our view that low has been formed at 1.2061 and mild upside bias remains for this move to bring retracement of early selloff to 1.2525-30, then towards 1.2590-00, however, near term overbought condition should limit upside and reckon resistance at 1.2663 would remain intact.
As we have taken profit on our long position entered at 1.2285, would not chase this rise here and would be prudent to buy again on pullback as 1.2360-70 should limit downside. Below indicated support at 1.2313 would defer and risk weakness to 1.2254 support (Friday’s low) but only break of latter level would signal top is possibly formed, bring test of previous support at 1.2197, below this level would confirm and bring weakness to 1.2160-65, then towards support at 1.2121, break there would confirm the rebound from 1.2061 has ended and bring retest of this level later, We are keeping our count that wave v as well as wave (C) ended at 1.3794 and impulsive wave (i ii, i ii) is now unfolding with minor wave iii ended at 1.2414, followed by wave iv correction ended at 1.2778, wave v has reached our indicated downside target at 1.2100 and may extend to 1.2000.
To recap, wave B from 1.3066 is unfolding as an a-b-c and is sub-divided as a: 1.2192, b: 1.2716 and wave c is a 5-waver with i: 1.1983, ii: 1.2506, extended wave iii with minor iii at 1.0206, wave iv ended at 1.0781 and wave v as well as wave iii has ended at 0.9931, hence the subsequent choppy trading is the wave iv which is unfolding as (a)-(b)-(c) with (a) leg of iv ended at 1.0854, followed by (b) leg at 1.0108 and (c) leg as well as the wave iv ended at 1.0674. The wave v is sub-divided by minor wave (i): 0.9980, (ii): 1.0374, (iii): 0.9446, (iv): 0.9913 and (v) as well as v has possibly ended at 0.9407, therefore, consolidation with upside bias is seen for major correction, indicated target at 1.3700 and 1.4000 had been met and further gain to 1.4700 would be seen later.