Sample Category Title
Trump Tax Reforms Plan Boost Sentiment | RBNZ Left Interest Rate Unchanged | Euro Could Revisit 1.20
US markets broke its four day losing streak
GOP frame work on the tax reform is here
FOMC voter, William Dudley poured cold water on the interest rate hike hopes
The RBNZ left the interest rate unchanged
The European futures and Asian markets are showing that the investors are picking up the momentum from the US markets which broke its four day losing streak. The US equity markets have been focused on the fiscal stimulus and the tax reform plans. On Wednesday, we finally have some details on the GOP frame work on the tax reform. The corporate tax rate would be reduced to 20 percent which is in-line with the market expectations because it was expected. On top of this, the plan also outlines three levels of individual tax rates and double the standard deduction. Tax reform hopes triggered the strong bull rally in the equity markets this year. The announced plan also encourages firms to bring back their overseas profits. Traders do believe this reduction in the corporate tax would help the corporates to report more healthier profits .
The dollar index have also found its new friends and moved higher from its lows as investors factored in the impact of the newly proposed tax laws. This is despite the fact that we have very little details in relation to the new tax plans. This made investors to shave some profit. Announcing tax details only means that it is a start, because it has a long way to go. It is almost certain that the plan is going to face enormous obstacles which would keep investors on their toes. Once the dust is settled, then we will be able to see a more clear picture. Remember, Trump is still struggling in repealing the Obama Care. The official FOMC voter, William Dudley has poured some cold water on the interest rate hike hopes by stating that the current interest rate is appropriate for the time being given where the inflation is.
The RBNZ left the interest rate unchanged- in line with the market expectations. The bank is keen to leave the monetary policy more accommodating for some time and it does think that the lower currency would help it to create the growth which the bank is after. The dovish stance by the RBNC drove the currency lower and we do expect the currency to stay under pressure for some time.
The Euro-dollar is suffering from profit taking as traders are still waiting on the biggest economy of the Eurozone to announce a coalition government. We do know that the profit taking could be very temporary thing because it is evidently clear that the European central bank is on path to normalise its monetary policy i.e tapering. Therefore, it is highly likely that the euro-dollar would be able to visit the 1.2092 very soon.
Technical Outlook: AUDUSD – Consolidation Above Daily Cloud Base To Precede Fresh Downside
The Aussie remains in red for the fourth straight day and dented strong support at 0.7807 (15 Aug former trough), coming ticks ahead of another significant support provided by daily cloud base at 0.7794.
The price bounced after hitting new 2 ½ month low at 0.7799 which could be seen as consolidation ahead of final push below cloud top.
The zone between 0.7820 and 0.7794 marks very strong support, consisting of Fibo 38.2% of 0.7328/0.8124 rally / former higher low and daily cloud base and the broader bears may take a breather here. The notion is supported by oversold slow stochastic on daily chart, however, limited upside action is expected.
Session high at 0.7856 marks initial resistance ahead of Wednesday’s high at 0.7888 and daily cloud top at 0.7911, which is expected to cap extended upticks.
The pair is riding on extended third wave of five-wave sequence from 0.8124 peak, which could travel to 0.7777 (FE 176.4% and 0.7733 (FE 200%).
Res: 0.7856, 0.7888, 0.7911, 0.7951
Sup: 0.7807, 0.7794, 0.7777, 0.7758
Technical Outlook: USDJPY Struggles To Clear 113.00 Barrier But Focus Remains At The Upside
The pair shows strong signs of hesitation at 113.00 barrier which was dented on Wednesday / today on spikes to 113.25/20 highs, but so far without firm break higher.
Overall picture remains bullish, following break and close above previous target at 112.80 (Fibo 76.4% of 114.49/107.31 descend) with techs on daily chart in full bullish setup and supportive for further advance.
Rising 10 SMA is about to cross 200SMA and form Golden Cross which would provide an additional boost.
Sustained break above 113.00 zone would expose next targets - upper 20d Bollinger band at 113.68 and psychological 114.00 barrier.
Dips are expected to hold above 200SMA (112.05) and keep bulls intact.
Res: 113.25, 113.57, 113.68, 114.00
Sup: 112.71, 112.19, 112.05, 111.47
Technical Outlook: GBPUSD – Weekly 100SMA Contains Pullback For Now, BoE Carney’s Speech In Focus
Cable bounces in early hours of European session after hitting fresh two-week low at 1.3348, after failing to return below weekly 100SMA, which was broken two weeks ago for the first time since Oct 2014. The pair was in red for the five consecutive days, following pullback from fresh post-Brexit recovery high at 1.3655. Bearish near-term studies see risk of further easing towards next strong supports at 1.3318 (Fibo 38.2% of 1.2773/1.3655 ascend) and 1.3305 (rising 20SMA). Corrective upticks should stay capped under 1.3500 (daily Tenkan-sen) to keep near-term bears in play. Speech of BoE's Governor Carney is in focus today.
Res: 1.3409, 1.3461, 1.3482, 1.3500
Sup: 1.3363, 1.3348, 1.3318, 1.3305
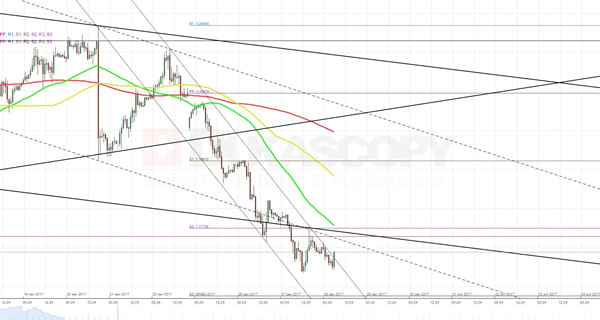
Technical Outlook: EURUSD Is Consolidating Above Daily Cloud Top, Bears Look For Fresh Extension Lower
The Euro is consolidating above key supports at 1.1724/20 (daily cloud top / Fibo 38.2% of 1.1118/1.2092 rally) which contains three-day fall from 1.1963, high posted after Monday’s gap-lower opening.
The pair maintains negative sentiment from German election outcome and took out some important supports that weakened technical outlook.
Upside attempts above daily cloud were so far mild, as falling hourly cloud continues to weigh, but the pair may stay in extended consolidation above ascending thick daily cloud (1.1724/1.1514) which provides significant support. Also, extended daily studies suggest bears may take a breather above the cloud before bears resume.
Asian session’s recovery top at 1.1776 marks initial resistance, ahead of broken 55SMA (1.1810) and broken neckline of daily H&S pattern at 1.1851, which is seen ideally capping extended corrective upticks.
Negative techs favor further downside, with sustained break below daily cloud top (1.1724) to trigger fresh extension of current wave C (of five wave pattern from 1.2092), towards its Fibonacci expansion levels at 1.1680 (138.2%) and 1.1619 (161.8%).
German inflation data are in focus today (CPI m/m is expected to stay unchanged at 0.1% in Sep).
Res: 1.1776, 1.1810, 1.1851, 1.1875
Sup: 1.1724, 1.1680, 1.1662, 1.1619
Elliott Wave Analysis: USD Index And NZDUSD
The USD is still in an uptrend and it appears that more upside may be seen in the near future if we consider that USD index can be making a five wave move within wave C/3, so there is even room for 94.20 after wave 4 set-back. We however may immediately turn bearish again, but after 92.18 is broken.
USD Index, 1H
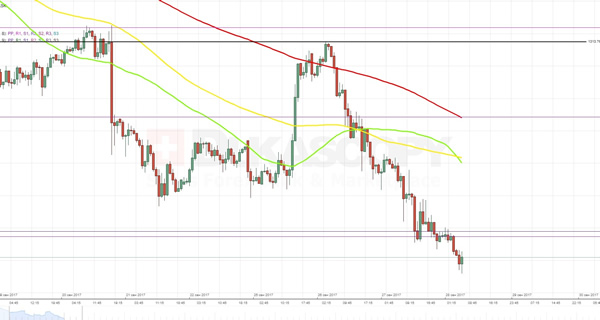
While USD index is up, we may see more weakness on commodity currencies which are very poor this week. NZDUSD is moving nicely lower and it appears that there might be room for a drop to 0.7100 in the near future.
NZDUSD, 1H
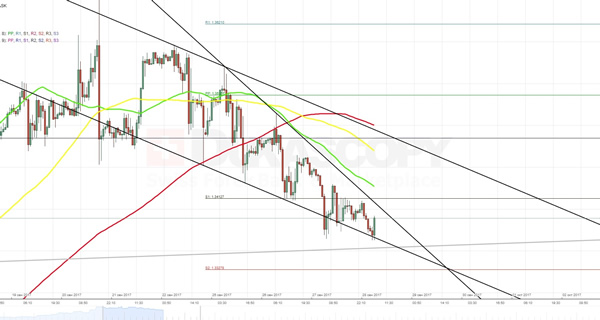
EURUSD Analysis: Encounters 100% Fibo Near 1.1715
Unfortunately for the Euro, a shared border of two senior descending channels did not manage to withhold the rate from falling to the south. However, this plunge did not last for long, as the currency pair made a turnaround apparently form the 100% Fibonacci retracement level at 1.1715. Given that this barrier is additionally secured by the monthly S1 at 1.1692 and the weekly S3 at 1.1688, the further appreciation of the buck seems unlikely. On the other hand, the surge in the opposite direction is similarly obstructed by the weekly S2 at 1.1774 and the slipping 55-hour SMA. For this reason, the pair might move horizontally for some time waiting for a strong impulse, which can be provided, for instance, by release of data on the US Final GDP.
GBPUSD Analysis: About To Leave The Falling Wedge
Contrary to expectations, the currency exchange rate did not make any significant moves yesterday and, for this reason, stayed in a falling wedge for additional day. However, the fact that the first four hours of this trading session were dominated by bears suggests that the pair is likely to leave the pattern in the southern direction.
Such outcome is supported not only by the weekly S1 located at the 1.3412 level but also by the 55-hour SMA, which is moving precisely along the resistance line of the wedge. Although the pair might face a strong support in the area between the 1.3350 and 1.3328 marks, from a larger perspective the Greenback should continue to gain value against the Pound.
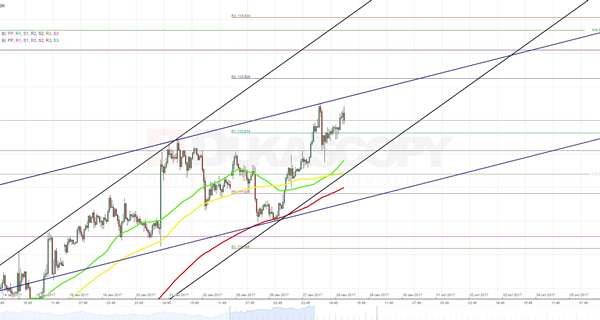
USDJPY Analysis: Breaks Long Term Pattern
Unfortunately for the Yen, the buck traders managed to push the pair through a combined resistance formed by the monthly R2 at 112.54 in conjunction with the upper trend-line of a ten month long falling wedge pattern. Despite such significant breakthrough, the exchange rate continues to fluctuate in two recently formed ascending channels whose cross point might represent a breaking point of another minor rising wedge. If this assumption is true, the pair might try to slip to the bottom. However, all these attempts are likely to be neutralized by a combination of the rising 55-, 100- and 200-hour SMAs. To put differently, if the pair has indeed left the long-term pattern, it might freely continue to climb to the top, facing no significant obstacles on its way (at least in the short run).
XAUUSD Analysis: Approaches Significant Support
Although previously the pair failed to break through the 1,290.93 level, a pressure from multiple technical indicators eventually pushed it to the bottom. As a result, the exchange rate reached the supposed yesterday's target at the 1,283.66 mark and represented the weekly S1. In theory, the buck has all means to drag the gold price down to the monthly S1, which is located at the 1,273.91 level and is additionally backed up by the 100-day SMA. However, in order to do that it has to break through the 61.8% Fibonacci retracement level at 1,278.96. In the short run these barriers a likely to force the pair to make a rebound. But from larger perspective, the pair has to pave the way through them and ultimately reach the bottom edge of the dominant ascending channel.