
Sample Category Title
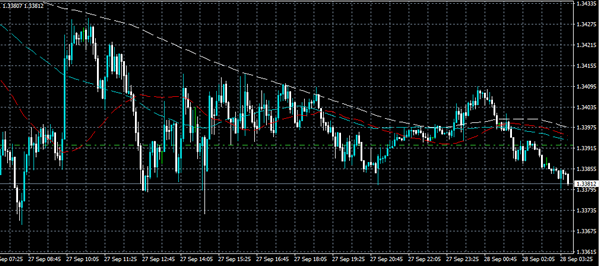
GBPUSD Intraday Analysis
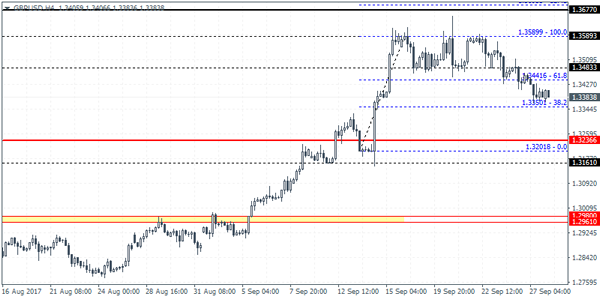
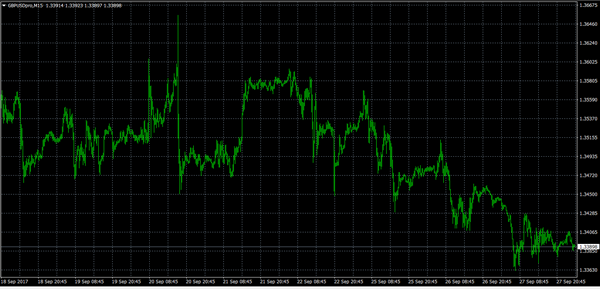
GBPUSD (1.3383): The British pound close at an eight day low yesterday with the bearish close suggesting further decline in prices. The bullish flag pattern remains invalidated with price action closing below the support at 1.1348 - 1.1344. A modest rebound could be expected with the breached support level likely to turn to resistance. This puts further downside pressure in GBPUSD with the next main support at 1.3236 likely to be tested. The decline to this support level will mark a correction in the GBPUSD rally but could also mean that a new bullish leg could be forming at this support.
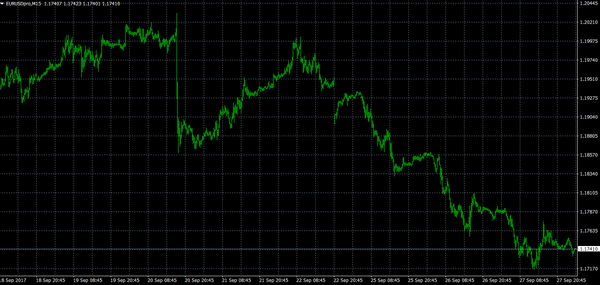
EURUSD Intraday Analysis
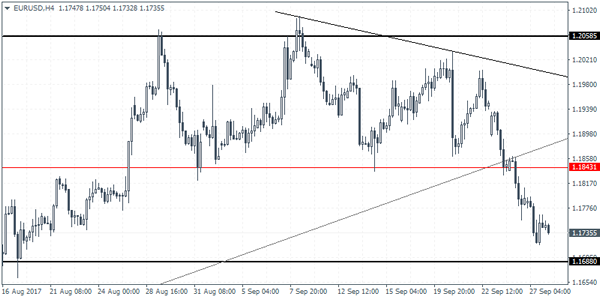
EURUSD (1.1735): The EURUSD broke past the 1.1822 support level and continued to decline lower, extending the losses. The next support level at 1.1672 is now under focus as price could be seen testing this support level. On the 4-hour chart, the downside price action in EURUSD confirms the descending triangle pattern which puts the lower target towards 1.1688 - 1.1672 level of support. The completion of the descending triangle pattern will potentially see price action likely to post a rebound off this lower support. The new range that could be established will be at 1.1840 - 1.1822 level of resistance and the new support level. Further declines in the common currency could push EURUSD lower towards 1.1440 support.
Sentiment In The US Dollar Improves. US Final GDP Awaited
The greenback managed to post some gains on the back of a better than expected durable goods orders report. Data showed that headline durable goods orders rose 1.7% on a month over month basis in August, beating expectations of a 0.9% increase. Investors were also positive on the U.S. dollar on the proposed tax overhaul which is expected to offer lower tax on corporate businesses and tax cuts on small businesses.
The RBNZ's meeting held yesterday saw the OCR being unchanged at 1.75% as widely expected. The RBNZ was seen lowering its GDP forecasts for the year ahead with the central bank likely preparing for a dovish forward guidance.
Looking ahead, the economic calendar today will focus on the final GDP revisions for the second quarter. According to the median estimates, the U.S. final GDP is expected to remain steady at 3.0%. The BoE Governor Carney is also expected to speak later today.
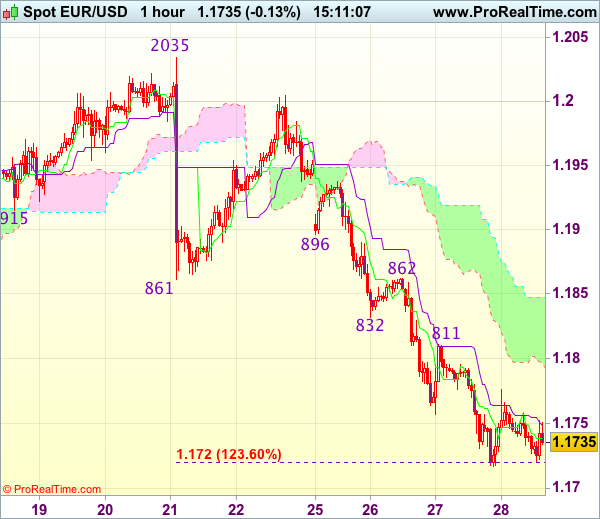
Trade Idea : EUR/USD – Sell at 1.1810
EUR/USD - 1.1756
Most recent candlesticks pattern : N/A
Trend : Down
Tenkan-Sen level : 1.1739
Kijun-Sen level : 1.1749
Ichimoku cloud top : 1.1847
Ichimoku cloud bottom : 1.1796
Original strategy :
Sell at 1.1830, Target: 1.1720, Stop: 1.1865
Position : -
Target : -
Stop : -
New strategy :
Sell at 1.1810, Target: 1.1710, Stop: 1.1845
Position : -
Target : -
Stop : -
As the single currency has remained under pressure after recent selloff, adding credence to our bearish view that the decline from 1.2093 top is still in progress and downside bias remains for further weakness to 1.1700, however, loss of downward momentum should prevent sharp fall below previous support at 1.1662 and reckon 1.1625-30 would hold, bring rebound later.
In view of this, we are looking to sell euro on recovery as resistance at 1.1811 should limit upside and bring another decline. Above previous support at 1.1832-38 (now resistance) should hold and bring another decline later. Above resistance at 1.1862 would abort and signal low is formed instead, bring a stronger rebound to 1.1896 (another previous support).
USDJPY Holding Onto Gains
The USDJPY pair continues to trade at an 11-week high around the 113 level, as Japanese politics and a stronger U.S dollar help to lift the pair. Japanese parliament was earlier dissolved in time for a snap election, which is widely speculated to be held on October 22nd.
Given the recent strength in the U.S dollar and the uncertainty surrounding the Japanese election, the expectation is for the USDJPY pair to remain bullish in intraday trading.
From a technical perspective, the USDJPY pair will remain strongly bullish, while trading above the former weekly price high, at 112.71.
A clear break above the current monthly high, at 113.25 should encourage USDJPY buying interest towards the July 14th swing high, at 113.57.
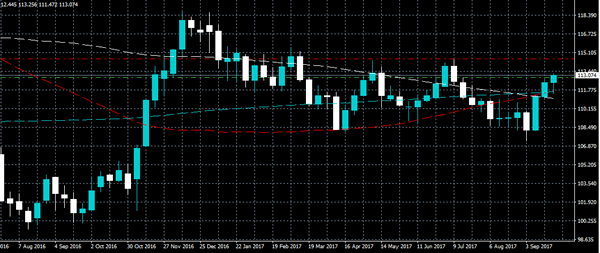
Key USDJPY technical support is currently located at 112.89 and the 112.71. Below 112.71 the pair risks further intraday losses towards 112.57 and 112.23.
To the upside, key intraday resistance above the current monthly price-high is found at 113.57 and 113.80. Above 113.80, price further resistance is found at 114.10 and 114.49.
.
GBPUSD Pair Remains Weak
The GBPUSD trades under the 1.3400 level, as Brexit negotiations with the EU remain deadlocked and the U.S dollar index continues to strengthen, after President Donald Trump proposed the biggest U.S. tax overhaul in three decades.
Sterling is expected to remain under further selling pressure while U.S fundamentals outweigh the United Kingdom's, while trading sentiment surrounding the greenback support further U.S dollar gains.
The GBPUSD pair has struggled to advance past the 1.3400 technical level during the Asian session, with price-action slipping further towards the currently weekly price-low.
Going forward, the GBPUSD pairs key 200-week moving average remains key, a move below the 200-week MA would signal further bearish losses for sterling
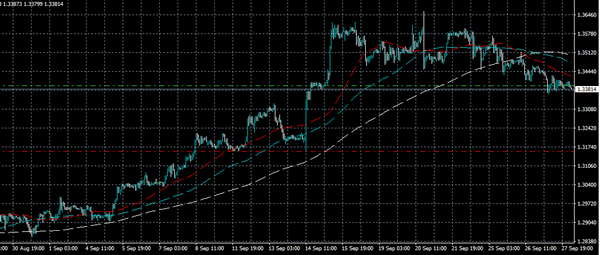
Key intraday support for the GBPUSD pair is found at 1.3360, 1.3340 and the key 1.3300 level. Below the 1.3300 level, the former yearly price high at 1.3268 acts as the foremost support.
To the upside, key GBPUSD technical resistance is found at the pairs daily pivot point, at 1.3400 and the 50-hour moving average at 1.3430. Above 1.3430, buying interest should accelerate towards 1.3444 and 1.3461.
.
Data-Dependent Traders Will Have Plenty To Talk About On Thursday
A deluge of economic data will make the rounds on Thursday, giving investors the latest insight into the Eurozone and US economies.
Market participants will be up bright and early for the release of the German consumer confidence survey, courtesy of GfK. The 06:00 GMT release is expected to show a slight increase in the confidence level of German consumers.
The European Commission's statistical agency will release a spate of sentiment indicators at 09:00 GMT, including services sentiment, consumer confidence, economic sentiment, business climate and industrial confidence. The September data sets are expected to confirm steady progress in the 19-member euro area.
Three hours later, Germany will release preliminary CPI data for the month of September. The consumer price index is forecast to rise 1.8% in the 12 months through September, unchanged from August.
Shifting gears to North America, the Labor Department kicks off Thursday trading with a weekly report on jobless claims. At the same time, the Department of Commerce will issue reports on the goods trade balance and second quarter GDP. The third and final estimate of gross domestic product is expected to show 3% annual growth between April and June, unchanged from the previous estimate.
Investors will also be busy keeping track of central bank speeches on Thursday. A pair of European Central Bank (ECB) policymakers are scheduled to speak, followed by Federal Reserve Governors Esther George and Stanley Fischer.
Fed officials are becoming increasingly hawkish on the prospect of a December interest rate increase. The hawkish posture has driven sharp gains in the US dollar, which once again proves the bizarre concept of “buying and rumour and selling the fact.” Between mid-2014 and January 2017, the US dollar index posted monstrous gains on the mere expectation that rates might rise one day. Now that rates have been hiked four times, it's no longer seen as a big deal.
EUR/USD
The euro got whacked again on Wednesday, falling to its lowest level in over a month. The EUR/USD exchange rate is trading around 1.1740, Prices are now eyeing the August low of 1.1661. Losing this level could prove catastrophic for the euro's bullish run.
GBP/USD
The British pound suffered another setback Wednesday, with prices falling below 1.34 US. Cable is currently in a four-day slump even as markets continue to price in a 2017 rate hike by the Bank of England. The GBP/USD faces immediate support at 1.3364. On the upside, immediate resistance is likely found at 1.3490.
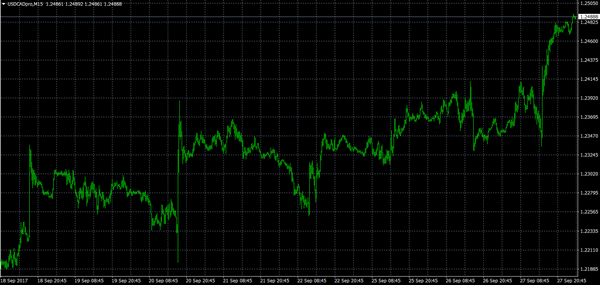
USD/CAD
A dovish Stephen Poloz on Wednesday triggered another slide in the Canadian dollar, with the USD/CAD climbing to one-month highs. The pair has gained another 0.1% on Thursday and is up a whopping 400 pips since 8 September. The next major resistance is 1.2464, which is the 50-day moving average.
Euro At Risk Of Further Declines Vs British Pound
Key Highlights
- The Euro started a downside move from the 0.9280 swing high and now trading below 0.8800 against the British Pound.
- There is a key bearish trend line forming with resistance at 0.8780 on the 4-hours chart of EUR/GBP.
- Germany’s GfK Consumer Confidence in Oct 2017 is forecasted to decline from 10.9 to 10.8.
- The US Gross Domestic Product report will be released for Q2 2017, and the GDP is forecasted to rise 3% (Annualized).
EURGBP Technical Analysis
The Euro started a major downside move from the 0.9280-90 levels against the British Pound. The EUR/GBP pair is already down more than 400 pips and looks set to break 0.8740.
The 4-hours chart of EUR/GBP clearly points a downtrend from well above 0.9250. The pair broke many support levels recently, including 0.9000, 0.8900 and 0.8850. There was even a close below 0.8800 and the 100 simple moving average (H4).
The pair recently traded as low as 0.8746 and is currently correcting higher. On the upside, there is a key bearish trend line forming with resistance at 0.8780 on the 4-hours chart.
An initial resistance is around the 23.6% Fib retracement level of the last decline from the 0.8885 high to 0.8746 low. As long as the pair is below 0.8800, it might decline further. Alternatively, a close above 0.8800 could push the pair towards 0.8850-60.
Germany’s GfK Consumer Confidence
Today in the Euro Zone, the German GfK Consumer Confidence for Oct 2017 was released. The forecast was slated for a minor rise from the last reading of 10.9 to 11.0.
The actual result was below the forecast, as there was a decline from 10.9 to 10.8. According to the report, both income expectations and propensity to buy decreased in September and thus GfK forecasts a decline in the consumer climate index from 10.9 to 10.8.
The report added that:
After the setback of the preceding month, income expectations in September stabilized and increased moderately. With an increase of 3 points, the indicator compensates for part of the decrease from August. It currently stands at 33.4 points. The indicator’s clear increase of 26.6 points in comparison with the preceding year can also be viewed as a clear indicator for the continuing positive economic sentiment.
The result is slightly negative and brings no hope for EUR/GBP, and that’s why any major recoveries remain capped near 0.8780-0.8800.
Economic Releases to Watch Today
US Initial Jobless Claims – Forecast 270K, versus 259K previous.
US Core Personal Consumption Expenditure for Q2 2017 (QoQ) – Forecast +0.9%, versus +0.9% previous.
US Wholesale Inventories for August 2017 (preliminary) – Forecast +0.4%, versus +0.6% previous.
US Gross Domestic Product Q2 2017 (Annualized) – Forecast 3% versus previous 3%.
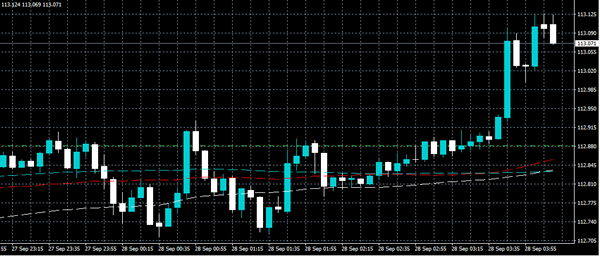
Trade Idea : USD/JPY – Stand aside
USD/JPY - 113.05
Most recent candlesticks pattern : N/A
Trend : Up
Tenkan-Sen level : 112.96
Kijun-Sen level : 112.82
Ichimoku cloud top : 112.20
Ichimoku cloud bottom : 112.01
Original strategy :
Exit long entered at 112.65,
Position : - Long at 112.65
Target : -
Stop : -
New strategy :
Stand aside
Position : -
Target : -
Stop : -
Although the greenback has staged a strong rebound after yesterday’s retreat to 112.38, break of this week’s high at 113.26 is needed to revive bullishness and signal recent upmove has resumed, then further gain to previous resistance at 113.58 would follow but loss of upward momentum should prevent sharp move beyond 113.75-80 and reckon 114.00-10 would remain intact, bring correction later.
In view of this, would not chase this rise here and would be prudent to stand aside. Below 112.70 would prolong consolidation and bring another retreat to 112.38, however, only a drop below this support would signal top has been formed, bring retracement of recent rise to the lower Kumo (now at 112.01) and then towards 111.75-80 but support at 111.47 should remain intact.

Forex: US & UK Rate Hikes Likely
The US economy's strength was underlined on Thursday with the release of US Durable Goods Orders for August that beat all estimates coming in at 1.7%. Markets had been expecting an improvement from the previous release of -6.8% to 1%. The strong release also negated the effects of the recent Hurricanes, which were expected to drag on Q2 growth. In addition, Core capital goods orders surged 3.3% year-on-year. With signs of increased business spending, the likelihood of a December rate hike looks ever more certain. The latest CME FedWatch tool rose to 83% from 72% on Monday on the likelihood of a December hike in rates.
The Trump Administration, and Republicans, unveiled their Tax Reform Plan to Congress. Changes in personal taxation and, more importantly, a huge reduction in corporation tax from 35% to 20% will help speed along US economic growth through capital & consumer spending. A repatriation of overseas assets is also part of the reform. This would allow US companies that hold in excess of $2.5 Trillion in profits overseas to repatriate this money back to the US at a significantly reduced tax rate – and not the current 35% corporate tax on earnings. Bear in mind, this is a “blueprint” that appears to leave out many details and will require a large amount of new legislation if, indeed, it gets passed. Trump is desperate for a “win”, as all of his previous plans have failed to be enacted, although many believe enacting this plan will face many hurdles.
The Bank of England's Chief Economist, Andy Holdane, commented on Wednesday that he saw encouraging signs of pay growth in the UK and that any increase in UK interest rates should be seen as a “good news story” for Britain's economy. He also stated, “In the September minutes in particular, a majority of the committee – of which I am one – said we could be nearing the point where a reduction in some degree of monetary stimulus might be warranted in the coming months”. The markets believe a hike in UK rates could come after the Bank of England November 2nd meeting, with suggestions of a 0.25% hike to 0.5%.
EURUSD remains weak but is holding above 1.1700 to currently trade around 1.1740.
USDJPY improve 0.2% in early Thursday trading to currently trade around 113.00.
GBPUSD is little changed overnight, currently trading around 1.3390.
Gold continues to suffer from overall USD strength. Currently, Gold is down 0.2% in early Thursday trading at $1280.
WTI has declined 0.3% overnight to currently trade around $52.00pb.
Major economic data releases for today:
At 07:35 BST, Bank of Japan Governor Haruhiko Kuroda will hold a press conference about monetary policies in Tokyo.
At 09:15 BST, Bank of England Governor Carney speaks. The markets will be scrutinizing his speech for clues regarding future monetary policy. His comments have been known to initiate GBP volatility.
At 13:30 BST, the US Bureau of Economic Analysis, Department of Commerce will release Core Personal Consumption Expenditures (QoQ) (Q2). Consensus is suggesting an unchanged release of 0.9%. Any release that is substantially different will result in USD volatility.
At 14:30 BST, the US Bureau of Economic Analysis will release Gross Domestic Product Annualized (Q2). Consensus forecasts suggest an unchanged rate of 3%.