Sample Category Title
Market Update – Asian Session: Equities Follow US Lead, USD Strengthens Asia Summary
Asia Summary
Asian equity markets opened mixed, generally following the lead of US markets. Hong Kong property names were weaker on another Chinese city adding property curves. Financial names gained on US yields rose overnight. Analysts note that Q4 volatility in China is likely to be subdued with efforts to keep markets stable ahead of Communist Party gathering on Oct 8th. RBNZ left rates unchanged as expected, noting that weaker currency is best for dealing with tradables inflation. Japan PM Abe dissolved lower house to make way for snap elections.
USD strength in the session attributed to Trump’s confirmation of proposed tax plan. USD/JPY rose giving some support to the Nikkei which opened +0.7%. The USD/KRW fell for a 3rd consecutive day, with North Korea continuing to weigh. In Japan weekly portfolio data, foreign investors sold a record amount of Japan assets, ¥3.41T, the most since mid-June. In Hong Kong, the 1-week HK$ HIBOR rose 15bps to 0.57786%, a fresh 2017 high.
Key economic data
(NZ) NEW ZEALAND CENTRAL BANK (RBNZ) LEAVES OFFICIAL CASH RATE (OCR) UNCHANGED AT 1.75%; AS EXPECTED
(CN) CHINA AUG SWIFT GLOBAL PAYMENTS (CNY): 1.94% V 2.00% PRIOR
(KR) South Korea Sept CPI m/m: 0.1% v 0.2%e; y/y: 2.1% v 2.2%e; Core y/y: 1.6% v 1.7%e
(AU) Australia Jun- Aug Job Vacancies: 6.0% v 3.3% prior (highest on record for quarter)
Speakers and Press
China/Hong Kong
(CN) China State Council chaired by Premier Li: Will further bolster its small and micro businesses with more financial measures to increase vitality of the economy – Xinhua
(CN) China State-owned Assets Supervision and Administration Commission (SASAC) Planning 3rd phase of SOE mixed-ownership pilot
Korea
(KR) North Korea (DPRK): joint declaration issued a decade ago with South Korea on realizing peaceful national reunification "clarified the practical ways for building trust between the north and the south
(KR) South Korea to allow tax deferment to companies impacted by Thaad; to offer cheap loans to car component markers impacted by China measures
(KR) South Korea Fin Min Kim: Growth is firm despite North Korea risk
Japan
(JP) Japan considering lowering leverage limit for FX trades on grounds that both retail and institutional investors are facing greater risks should the market face sudden fluctuations – Nikkei
(JP) S&P Analyst: Japan PM Abe's announcement to defer the FY20 primary budget balance goal will not affect S&P's credit rating for Japan
(JP) Japan PM Abe: Election will be a fight over developing Japan's future
US/Europe
(US) Fed's Rosengren (moderate, non-voter): Does not offer clue on rate hike timing
(UK) BOE's Haldane (chief economist): Was part of MPC majority that felt a reduction in monetary stimulus may be warranted in the coming months - UK press
Asian Equity Indices/Futures (00:00ET)
Nikkei +0.5%, Hang Seng -0.4%; Shanghai Composite -0.1%, ASX200 +0.1%, Kospi -0.1%
Equity Futures: S&P500 -0.0%; Nasdaq100 +0.0%, Dax +0.0%, FTSE100 -0.1%
FX ranges/Commodities/Fixed Income (00:00ET)
EUR 1.1756-1.1727; JPY 113.09-112.71; AUD 0.7856-0.7816;NZD 0.7233-0.7187
Dec Gold -0.3% at $1,284/oz; Nov Crude Oil -0.3% at $51.97/brl; Dec Copper -0.3% at $2.92/lb
GLD SPDR Gold Trust ETF daily holdings +0.3% to 864.7 metric tonnes
(CN) PBOC OMO: injects CNY70B in 14 and 28-day reverse repos v skips prior; drains net CNY0B v CNY40B prior
USD/CNY (CN) China PBOC sets yuan reference rate at 6.6825 v 6.6192 prior
(JP) Bank of Japan (BOJ) to accommodate T+2 JGB settlement for foreign central banks
(JP) Japan MoF sells ¥816.9B in 3-month bills; avg yield -0.1652%; bid-to-cover 4.46x\
(JP) Japan MoF sells ¥1.80T v ¥2.2T indicated in 0.1% 2-yr JGBs; avg yield -0.1190%; bid-to-cover 4.11x v 4.97x prior (lowest bid-to-cover since March)
Equities notable movers
Australia/New Zealand
OEL.AU Gives independent reserves report for the SM 71 project; +17.5%
SHJ.AU Receives statement of claim for class action; -13.5%
Japan
9064.JP Amazon has agreed to pay Yamato at least 40% more for shipping services in Japan – Nikkei; +4%
8028.JP Raises H1 guidance Net ¥23B from ¥14B; Op ¥33.5B from ¥24.6B; Rev ¥633B from ¥628.1B, +8.8%
Hong Kong/China
Hong Kong property sector weaker on additional city adding cooling measures: 884.HK -3.8%, 1030.HK -3.3%
Currencies: Higher US Yields Support USD Comeback
Sunrise Market Commentary
- Rates: Reflation trade back in the driver's seat
Investors fell back under the spell of reflationary spirits after US President Trump announced details of his tax reform proposal. Core bond yield curves bear steepened and the US Note future loses more ground overnight. We expect more bond losses today, especially in case of higher than expected German inflation data. - Currencies: Higher US yields support USD comeback
The reflation trade supported the dollar yesterday. There are plenty of eco data today, but they probably won't change the broader picture. The USD rebound might take a breather, but higher US yields should provide a solid floor for the US currency.
The Sunrise Headlines
- US stock markets gained around 0.4% yesterday with Nasdaq outperforming (+1.15%). Equities benefit together with the dollar from revived reflationary bets. Overnight, Asian risk sentiment is more mixed.
- US President Trump presented Republican's proposition for tax reforms including lower taxes on corporate profits, incentives for business investment, fewer and lower individual income tax brackets and the end of estate taxes.
- Bank of England Chief Economist Haldane said he saw encouraging signs of pay growth and any increase in interest rates should be seen as a "good news story" for Britain's economy.
- St. Louis Fed Bullard said "the current level of the policy rate is appropriate" given the economy and the fact that inflation "has surprised to the downside." But Boston's Fed Rosengren said the central bank should raise rates in a "regular and gradual" way despite low inflation.
- New Zealand's central bank kept its policy rate at 1.75% and hinted at a lower growth outlook as a long construction boom loses momentum and against the backdrop of political uncertainty from an inconclusive national election.
- The Canadian loonie extended its losses against the US dollar after Bank of Canada governor Poloz said the central bank that will proceed “cautiously” with any additional rate rises.
- The eco calendar contains EMU EC confidence data, German inflation, US weekly claims and the final US Q2 GDP reading. Several central bankers speak and Italy & the US tap the bond market.
Currencies: Higher US Yields Support USD Comeback
Dollar rebound gains momentum
European investors kick-started an new phase in the reflation trade yesterday. Yellen's confirming the Fed's intention to normalize policy, the prospect of a US tax reform and good eco data added to the overall positive sentiment. The dollar also profited. The break of EUR/USD below 1.1823 is confirmed. EUR/USD finished the session at 1.1745. USD/JPY temporary regained the 113 big figure, but closed at 112.84.
Asian equities show again a mixed picture. Japanese equities profit from the rise of the dollar/decline of the yen. USD/JPY trades again in the 113 area. A further rise of US bond yields overnight suggests that the dollar might continue to enjoy interest rate support. The impact of a rising dollar and higher US yields on other Asian/EM markets is mixed. EUR/USD (1.1735 area) holds within reach of yesterday's correction low. The rise of the oil price has halted, but with no direct impact on the dollar.
Today, the EC economic confidence survey is expected to show minor gains (112 versus 111.9). We put the risks to the downside, but the decline shouldn't be dramatized. The German September HICP inflation is probably more important for markets. The consensus expects a 0.1% M/M rise. The Y/Y reading is expected at 1.9% from 1.8%. We join the consensus, but any deviation, especially on the upside, might affect core bonds. The US eco data are less in interesting. The final Q2 GDP is expected unrevised at 3%, jobless claims might still be distorted by the hurricanes. The trade deficit is expected to have widened, but Q3 trade is still likely to add positively to Q3 GDP. There are lots of ECB and Fed speakers, but we don't expect them to rock the boat. Recent Fed talk indicated that the Fed wants to hike rates again in December en in 2018, unless data surprise.
Yesterday, the dollar rebound continued, making the overall picture for the US currency more solid. The Trump administration indeed announced a ‘bold' tax plan, but plenty of details (including the financing) have still to be worked out. So, the positive impact from this theme might gradually fade. Today's US data won't be than important, but a further trend-rise in US yields might keep the downside of the dollar protected. Higher German inflation might support the overall reflation trade and shouldn't be that negative for the overall USD performance. The dollar rebound might slow/take a breather today, but we expect the trend to persist.
From a technical point of view EUR/USD hovered in a consolidation pattern between 1.1823 and 1.2070. It took time for the pair to break below the 1.1823 range bottom, but the break occurred earlier this week yesterday. The rise in US yields looks more solid and so does the rebound of the dollar. This week's price action is growing more encouraging for USD bulls. Next support in EUR/USD comes in 1.1662.
The day-to-day momentum in USD/JPY was constructive recently, but it was primarily due to yen weakness. USD/JPY regained the 110.67/95 previous resistance, a short-term positive. The 114.49 correction top is the next important reference. The cross rate remains sensitive to changes in overall risk sentiment.
EUR/USD correction continues as break below 1.1823 is confirmed
EUR/GBP
Sterling rebound against the euro slows.
There are tentative signs that the sterling rebound is losing momentum. EUR/GBP yesterday still touched a minor new correction low in the mid 0.87 area, but this move was due to the EUR/USD decline. The overall rise of the dollar also kept cable under pressure. The sterling support from very strong CBI retail data proved temporary. EUR/GBP closed at 08774, off the intraday lows. Cable closed the session at 1.3387. In an interview, BoE's Haldane said that a rate hike would be good news as it shows that the economy is healing.
There are no important eco data on the UK agenda today. Markets will keep an eye on the BoE Independence conference in London. On Brexit, there are rumours that the EU is considering small concessions and start talking on the transition period. This might be slightly sterling supportive, but we don't expect a big impact on sterling. It already made a nice rebound of late. We have to impression that the decline of EUR/GBP is losing momentum. The rise of the dollar sent cable in downward correction.
EUR/GBP made an impressive uptrend from April to set a MT top at 0.9307 late August. UK price data amended the dynamics and hawkish BoE comments reinforced a sterling rebound. Medium term, we maintain a EUR/GBP buy-on-dips approach as we expect the mix of euro strength and sterling softness to persist. However, the prospect of (limited) withdrawal of BOE stimulus put a solid floor for sterling ST term. We look how far the current correction goes. EUR/GBP is nearing support at 0.8743 and 0.8652, which we consider difficult to break. We gradually look to by EUR/GBP on dips.
EUR/GBP: downtrend show tentative signs of slowing.
US: Still A Long Way To Go For Tax Reform
Yesterday, the 'Big 6' Republicans published the tax framework for tax reform. For a quick overview, see the table to the right. The release is nothing more than a blueprint in the sense that we have not got any details about estimated costs, for instance. However, the Committee for a Responsible Federal Budget (CRFB, a non-partisan organisation analysing US fiscal policy) estimates the proposal will cost around USD2,200bn over 10 years (i.e. approximately 1% of GDP per year over 10 years) although this is based on a number of assumptions as the blueprint is missing a lot of details. For more, see 'Big 6 Tax Frameworkd Could Cost $2.2 Trillion', 27 September. However, easier fiscal policy may not increase growth, as it would most likely be offset by tighter monetary policy, although uncertainty remains high about which direction the Fed will go in next year due to the vacant seats in the Board of Governor (see also FOMC preview, 15 September).
A headache for the Republicans is that USD2,200bn is more than there is room for in the Senate draft budget (reportedly USD1,500bn over 10 years), which also by the way is not aligned with the House yet. So, unless changes are made, Republicans cannot pass all of the elements in the framework via budget reconciliation (which the Republicans need to in order to pass tax legislation with only 51 votes and avoid Senate filibusters by Democrats, see page 2 for more details), as it will become too expensive. Two other problems are that tax reform may not add to deficits after 10 years ('sunset provisions').
Although the troublesome House Freedom Caucus (conservative Republicans, usually fiscal hawks) has supported the tax framework in a statement, the question is whether the caucus remains supportive if tax reform increases government deficits and hence government debt. While the Republicans agree on the goal, they disagree on the means. We still think the two most likely scenarios are a smaller tax reform or no deal at all, not least given that Congress is in session for less than 50 days this year, meaning that the Republicans are running out of time. As we might face a new government shutdown in December when the short-term government funding deal ends, Trump also has other topics on his agenda and the mid-term election is coming up in November next year, the Republicans need to act fast and the Republicans' attempt to repeal and replace Obamacare indicates this is easier said than done.
It is worth noting that Trump and the White House are still working on a bipartisan tax reform with moderate Democrats (something for example House Speaker Paul Ryan has rejected completely) in order to side-line Republican 'troublemakers'. After the debt limit deal with the Democrats, this scenario has become more likely, not least given that one reason why Trump struck the deal was because he has become increasingly frustrated with the Republicans' inability to govern. Previously, the Democrats sent a letter to Trump writing that they will not participate in tax reform cutting taxes for the wealthiest, which is something Trump can live with, at least according to his recent tax speeches. The Democrats also want a revenue-neutral tax reform, which means it is still very difficult. One advantage though is that tax reform would become more permanent, as Trump can avoid sunset provisions if he is able to find 60 votes in Senate.
Aussie Dollar Trading On A Weaker Footing This Morning
For the 24 hours to 23:00 GMT, the AUD declined 0.37% against the USD and closed at 0.7854.
LME Copper prices rose 0.05% or $3.0/MT to $6426.0/MT. Aluminium prices rose 0.05% or $1.0/MT to $2117.0/MT.
In the Asian session, at GMT0300, the pair is trading at 0.7826, with the AUD trading 0.36% lower against the USD from yesterday’s close.
The pair is expected to find support at 0.7806, and a fall through could take it to the next support level of 0.7787. The pair is expected to find its first resistance at 0.7865, and a rise through could take it to the next resistance level of 0.7905.
Looking ahead, traders will look forward to Australia’s private sector credit data for August, slated to release in the early hours tomorrow.
The currency pair is trading below its 20 Hr and 50 Hr moving averages.

Euro Trading A Tad Lower, Ahead Of Germany’s Inflation Data
For the 24 hours to 23:00 GMT, the EUR declined 0.36% against the USD and closed at 1.1745.
On the macro front, French consumer confidence index unexpectedly dropped to a level of 101.0 in September, hitting a five-month low level. Market participants had anticipated the index to remain steady at 103.0.
On the other hand, Italy's consumer confidence index surprisingly climbed to a twenty-month high level of 115.5 in September, defying market expectation for a decline to a level of 110.6 and following a revised level of 111.2 in the previous month.
The greenback gained ground against its major counterparts, after data showed that flash durable goods orders in the US rebounded more-than-expected by 1.7% MoM in August, pointing to a continued upswing in the nation's business investment. Durable goods orders had registered a drop of 6.8% in the prior month, while markets were anticipating for a rise of 1.0%.
On the contrary, the nation's pending home sales slid more-than-anticipated by 2.6% on a monthly basis in August, hitting its lowest level in nearly two years, amid a tighter supply of homes and rising prices. Pending home sales had recorded a drop of 0.8% in the prior month, while market participants had envisaged for a drop of 0.5%.
Gains in the US Dollar were boosted further, after the US President, Donald Trump, proposed the biggest US tax overhaul in three decades.
The US President offered to slash corporate income tax rates to 20.0% from 35.0%, cut taxes for small businesses and reducing the highest individual income tax rate to 35.0% from 39.6%.
In the Asian session, at GMT0300, the pair is trading at 1.1740, with the EUR trading slightly lower against the USD from yesterday's close.
The pair is expected to find support at 1.1707, and a fall through could take it to the next support level of 1.1675. The pair is expected to find its first resistance at 1.1782, and a rise through could take it to the next resistance level of 1.1825.
Moving ahead, investors will look forward to the Euro-zone's final consumer confidence index as well as Germany's flash inflation numbers, both for September, slated to release in a few hours. Moreover, the US 2Q GDP, advance goods trade balance for August and initial jobless claims data, all slated to release later in the day, will pique significant amount of investor attention.
The currency pair is showing convergence with its 20 Hr moving average and trading below its 50 Hr moving average.

Pound Trading On A Weaker Footing This Morning
For the 24 hours to 23:00 GMT, the GBP declined 0.4% against the USD and closed at 1.3398.
In the Asian session, at GMT0300, the pair is trading at 1.3387, with the GBP trading 0.08% lower against the USD from yesterday’s close.
The pair is expected to find support at 1.3352, and a fall through could take it to the next support level of 1.3316. The pair is expected to find its first resistance at 1.3435, and a rise through could take it to the next resistance level of 1.3482.
Moving ahead, a speech by the Bank of England’s Governor, Mark Carney, due in a few hours, will garner a lot of market attention.
The currency pair is showing convergence with its 20 Hr moving average and trading below its 50 Hr moving average.

Japanese Yen Trading Flat In The Morning Session
For the 24 hours to 23:00 GMT, the USD rose 0.52% against the JPY and closed at 112.86.
In economic news, Japan’s final machine tool orders registered a rise of 36.2% YoY in August, while the preliminary figures had recorded a rise of 36.3%. Machine tool orders had recorded a rise of 28.0% in the previous month.
In the Asian session, at GMT0300, the pair is trading at 112.86, with the USD trading flat against the JPY from yesterday’s close.
The pair is expected to find support at 112.35, and a fall through could take it to the next support level of 111.83. The pair is expected to find its first resistance at 113.32, and a rise through could take it to the next resistance level of 113.77.
Moving forward, market participants will focus on the Bank of Japan’s summary of opinions report along with Japan’s inflation and jobless rate data, both for August, all due to release overnight.
The currency pair is showing convergence with its 20 Hr moving average and trading above its 50 Hr moving average.

Switzerland’s ZEW Economic Expectations Index Advanced In September
For the 24 hours to 23:00 GMT, the USD rose 0.29% against the CHF and closed at 0.9721.
Macroeconomic data indicated that Switzerland's ZEW economic expectations index rose to a level of 28.0 in September, compared to a reading of 25.0 in the previous month. Further, the nation's UBS consumption indicator climbed to a level of 1.53 in August, after recording a revised reading of 1.46 in the prior month.
In the Asian session, at GMT0300, the pair is trading at 0.9731, with the USD trading 0.1% higher against the CHF from yesterday's close.
The pair is expected to find support at 0.9695, and a fall through could take it to the next support level of 0.9658. The pair is expected to find its first resistance at 0.9769, and a rise through could take it to the next resistance level of 0.9806.
With no macroeconomic releases in Switzerland today, investor sentiment will be determined by global macroeconomic factors.
The currency pair is showing convergence with its 20 Hr moving average and trading above its 50 Hr moving average.

BoC Poloz Signals Caution In Further Interest Rate Hikes
For the 24 hours to 23:00 GMT, the USD rose 0.96% against the CAD and closed at 1.2477.
The Canadian Dollar lost ground against the USD after the Bank of Canada (BoC) Governor, Stephen Poloz, diminished hopes of further interest rate hikes this year.
The BoC Governor indicated that the central bank will be cautious in its approach to monetary policy and stressed that there is no predetermined path for interest rate hikes while adding that any move will be data-dependent.
In the Asian session, at GMT0300, the pair is trading at 1.2493, with the USD trading 0.13% higher against the CAD from yesterday’s close.
The pair is expected to find support at 1.2388, and a fall through could take it to the next support level of 1.2284. The pair is expected to find its first resistance at 1.2545, and a rise through could take it to the next resistance level of 1.2598.
The currency pair is trading above its 20 Hr and 50 Hr moving averages.

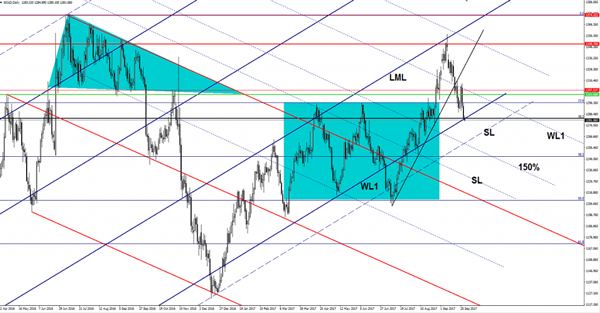
Gold Crucial Breakdown
The yellow metal drops further on the short term and is almost to take out the major support from the confluence area formed at the intersection between the WL1 with the 38.2% retracement level. A valid breakdown below this confluence will accelerate the sell-off, the next target will be at the sliding parallel line (SL).