Sample Category Title
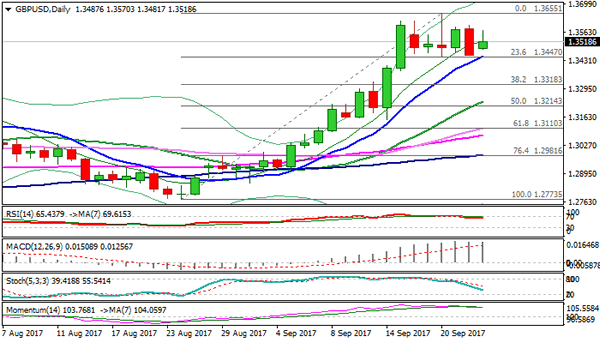
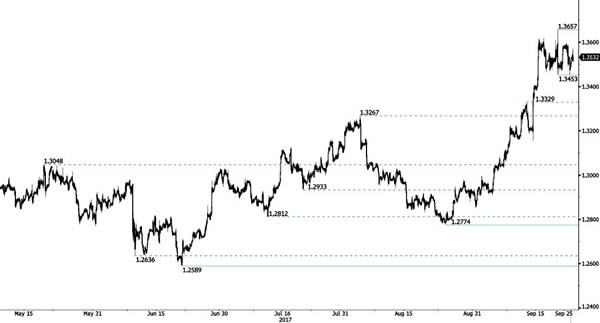
GBP/USD Consolidating
GBP/USD is pushing higher after recent surge. Hourly resistance is given at 1.3657 (20/09/2017 high). Strong support is given at 1.2774 (24/08/2017 low). Expected to show continued bullish consolidation.
The long-term technical pattern is reversing. The Brexit vote had paved the way for further decline. Long-term support can be found at 1.1841 (07/10/2017 low). Long-term resistance given around 1.35 is at stake and indicates a long-term reversal in the negative trend. Yet, it is very unlikely at the moment.
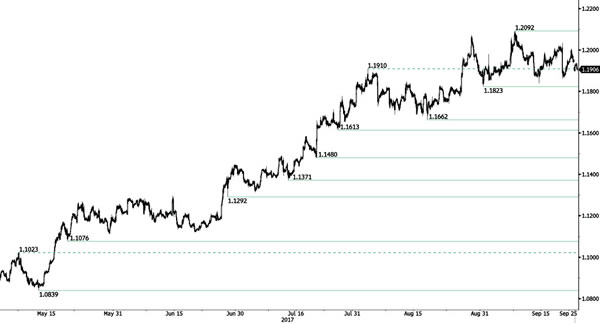
EUR/USD Sideways Price Action
EUR/USD lies in a bullish trend despite ongoing consolidation. Hourly resistance can be found at 1.2092 (08/09/2017 high) while hourly support lies at 1.1823 (31/08/2017 low). Stronger support is given at a distance at 1.1662 (17/08/2017 low). Expected to show continued bullish pressures.
In the longer term, the momentum is now turning largely positive. We favour a continued bullish bias. Key resistance is holding at 1.2252 (25/12/2014 high) while strong support lies at 1.0341 (03/01/2017 low).
Merkel’s Win Will Boost Euro
Pro-EU view on Merkel Win
The primary headline of Angela Merkel winning a historic 4th term is the one that will likely drive market activity. Despite disappointment over lost votes from CDU/CSU and SPD, the rise of right wing populist AfD and questions over the exact government make-up, the outcome of yesterday Bundestag elections will be pro-Europe, centrist, coalition government. Yes, there are granular uncertainties which will delay Germany's role in great EU integration, but Merkel has indicated that a coalition agreement should be reached by Christmas. EURUSD reacting calmly, with marginal USD strength, but trading well within its recent ranges. EURCHF move higher indicates that the overall result of the German election is broadly pro-Euro.
Moving forward, given the decline of popularity in the SPD the most likely coalition under Merkel would be CDU/FDP/Greens. Already we are hearing a reversal of FDP language post-elections sounding pro-Europe. While the Greens in the past have call for Euro-bonds, which would solve many of the uncertainty around EU funding. If you take the results of yesterday German elections and combine with French President Macron EU reform vision positive political backdrop for European investors. For the first time in a long while, European politics is likely to drive the Euro higher. There are risk in the horizon with Macron falling popularity rating and weakness of party in Senate elections, Italy elections and Spain/Catalonia (significant risk escalation, in our view, as Madrid moved to take over local policing), but in the near term, we would manifest our strong Europe view through long EURCHF on any pullbacks.
Markets is showing a risk-on stance
The sentiment seems to be back to bullish. Gold keeps on declining and is now below $1300. North Korea tensions are still there but markets seems not to worry much on a possible escalation. The dollar has been recently strengthened after weakening since the start of the year.
At the moment, we consider that asset pricing are more sensitive to central banks than geopolitical risks. Markets are buying the Fed balance sheet reduction and this explains the current sell-off in Gold. Within the short-term, we should see the EURUSD pair consolidating below 1.20. It is going to be very difficult to put an end to the Quantitative Easing without provoking further turmoil on the market.
We believe that current levels are good to reload gold positions. Optimism is, according to us, way too strong regarding central bank especially knowing the number of times it has disappointed over the last few years. Central banks need to guarantee price stability and we assume it is going to be very difficult. Debts are way too important. Gold is definitely selling at a discount right now.
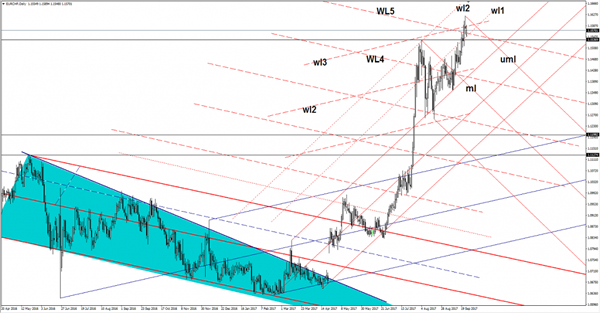
EUR/CHF Breakout Or Fake Out?
The EUR/CHF opened with a huge gap down in the morning, but now is trying to close it. Price is trading in the green and struggles to stay in the green territory. You can see that has failed to stay above the third warning line (WL3) of the blue ascending pitchfork. Has found temporary support at the first warning line (wl1) of the minor ascending pitchfork. A valid breakdown below the WL5 and below the wl1 will confirm a corrective phase.
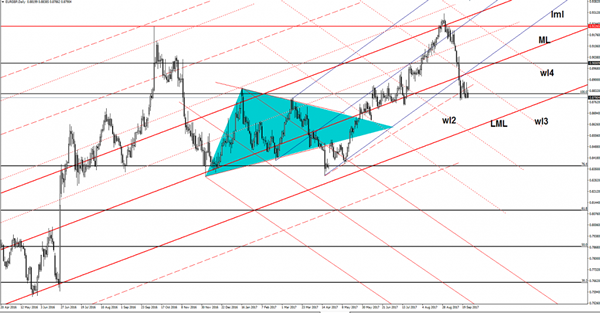
EUR/GBP Downside Prevails
The EUR/GBP failed to stabilize above the 100% Fibonacci level and above the short uptrend line (dotted line) and now it seems motivated to drop much deeper in the upcoming days. The next downside target will be at the lower median line (LML) of the major ascending pitchfork.
Price failed to reach and retest the median line (ML) and the third warning line (wl3) of the descending pitchfork, signaling a further drop.
GBP/USD Minor Retreat Favored
The currency pair has dropped sharply on Thursday, but now is fighting hard to recover and to stay higher on the daily chart. Is trading in the green and tries to retest some important resistance levels, a rejection will announce another minor decrease. GBP/USD is moving sideways on the short term, but remains to see if this will be an accumulation or a distribution movement.
I want to remind you that the perspective remains bullish despite a minor decrease, could come down only if the USDX will jump higher on the short term. The dollar index move in range on the short term as well, but a valid breakout above the 92.49 static resistance will open the door for more buyers.
Technically, the USDX is still trapped under some very important resistance levels, so is premature to say that we’ll have a reversal.
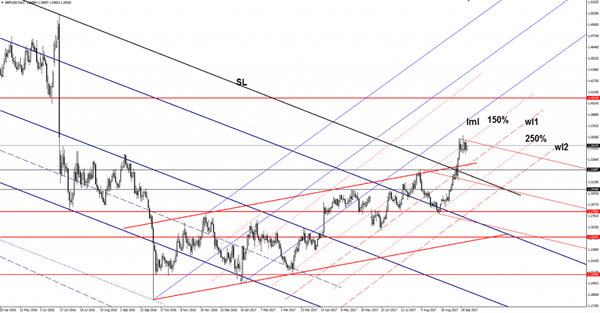
Price failed to stay above the 150% Fibonacci line (ascending dotted line) and could drop in the upcoming days. Has increased today and tries to retest the 150% line, actually, it could be attracted by the confluence area formed between the 150% Fibonacci line with the upper median line (uml) of the minor red descending pitchfork.
GBP/USD could come down to retest the warning line (wl1) of the ascending pitchfork. A rejection from the confluence area will bring more sellers in the game, while a valid breakout will accelerate the upside movement.
EUR/USD Elliott Wave Analysis
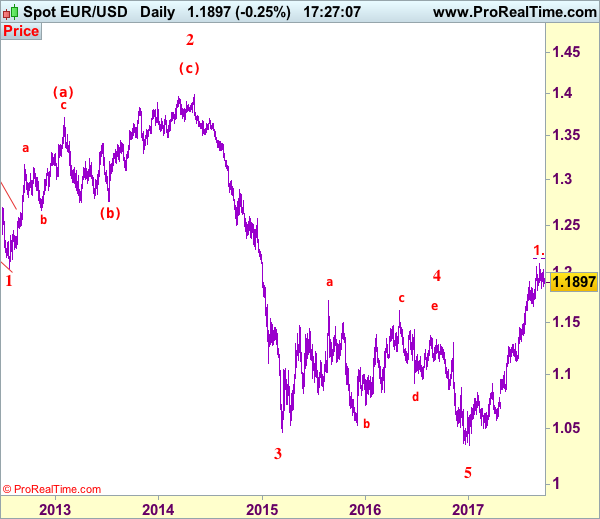
EUR/USD – 1.1894
EUR/USD: Wave (c) of 2 ended at 1.3993 and wave 3 of III has commenced for weakness to 1.0411 (1.236 of wave 1), then 1.0000.
Although the single currency found support at 1.1838 earlier and rebounded last week to 1.2034, as renewed selling interest emerged there and euro has retreated again, suggesting recent upmove is not ready to resume yet and further consolidation below recent high at 1.2093 would take place and another corrective fall to said support at 1.1838 cannot be ruled out, however, a daily close below this level is needed to signal a temporary top has been formed, bring retracement of recent upmove to 1.1770-75, then 1.1700 but previous support at 1.1662 (previous 4th of a lesser degree) should hold from here, bring rebound later.
Our preferred count on the daily chart remains that a wave (II) from 1.2329 ended at 1.5145 with A-leg ended at 1.4720, followed by wave B at 1.2457, the wave C from there was also a 3 legged move and is labeled as (a): 1.3739, (b): 1.2885, the wave iii of the 5-waver (c) from 1.2885 has ended at 1.4339 and wave iv is a triangle ended at 1.3878 and wave v formed a top at 1.5145. The decline from there is a 5-waver (C) with minor wave (i) of I of (C) ended at 1.4218 with wave (ii) ended at 1.4580, wave (iii) ended at 1.3267 and wave (iv) ended at 1.3692 and wave (v) ended at 1.1876, this is also the low of wave I of (C) and wave II ended at 1.4940, hence wave III is now in progress with a diagonal wave 1 ended at 1.2042, the breach of previous support at 1.1876 (wave I trough) adds credence to our view that the wave 2 has ended at 1.3993, wave 3 has commenced for further weakness to 1.0411, then towards 1.0000.
On the upside, expect recovery to be limited to 1.1950-55 and reckon 1.2000-05 should hold, bring another retreat later. Only break of said resistance at 1.2034 would signal the pullback from 1.2093 has ended and recent upmove from 1.0340 low has resumed for retest of 1.2093, then towards 1.2150-55 (61.8% projection of 1.1119-1.1910 measuring from 1.1662), however, loss of upward momentum should prevent sharp move beyond 1.2200-10 and price should falter below 1.2255-60, risk from there remains for a much-needed correction to take place later.
Recommendation: Stand aside for this week.
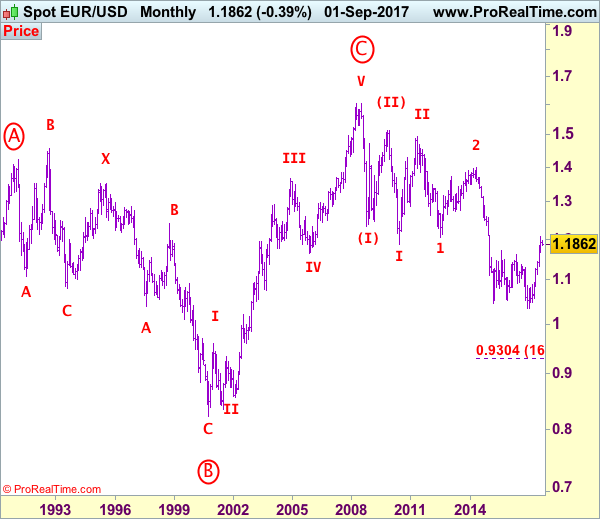
Euro's long-term uptrend started from 0.8228 (26 Oct 2000) with an impulsive structure. The rise from 0.8228 to 0.9593 (5 Jan 2001) is labeled as wave I, the retreat to 0.8352 (6 Jul 2001) is wave II and the rally to 1.3670 (31 Dec 2004) is wave III. Wave IV from there ended at 1.1640 (15 Nov 2005), the subsequent upmove to 1.6040 (July 15, 2008) is treated as wave V, the major selloff from the record high of 1.6040 to 1.2329 (October 27, 2008) signals a reversal has taken place with (I) leg ended at 1.2329 and once (II) ended at 1.5145, wave (III) itself is an extended move with I: 1.1876 and complex wave II ended at 1.4902, wave III has commenced with wave 1 and 2 ended at 1.2042 and 1.3993 respectively, wave 3 of III is now unfolding for weakness towards parity.
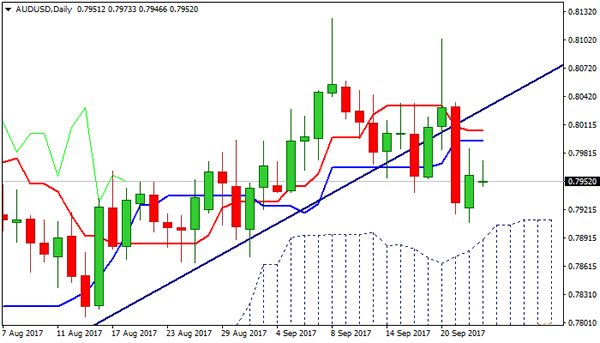
Technical Outlook: AUDUSD – Limited Recovery Attempts Keep The Downside At Risk
The AUDUSD pair is trading within narrow range in early Monday, holding in thick hourly cloud, with neutral near-term studies, showing no clear near-term direction. The bigger picture shows that bulls on daily chart might be running out of steam, following strong fall last Thursday and limited subsequent recovery attempts. Friday's bounce was capped by 20SMA and failed to sustain break above bull-trendline, drawn off 0.7807 (15 Aug trough). Similar action was seen in early Monday, with upside attempts stalling below 20SMA, with 10/20SMA bear-cross forming and raising downside pressure. This keeps the downside vulnerable for another probe below cracked 0.7929 support (Fibo 61.8% of 0.7807/0.8124 upleg) and 0.7907 pivot (last Friday's low/daily cloud top) break of which would risk test of 0.7870 higher base and possible extension towards key short-term support at 0.7807. Conversely, firm break above pivotal resistance zone at 0.7985/0.8000 (10/20SMA's/converged daily Kijun-sen/Tenkan-sen) would shift focus higher.
Res: 0.7985, 0.8000, 0.8028, 0.8035
Sup: 0.7946, 0.7929, 0.7907, 0.7865
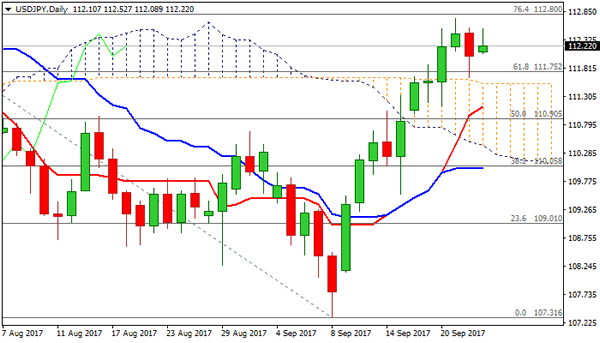
Technical Outlook: USDJPY – Thick Daily Cloud Continues To Underpin Near-Term Action
The pair stands above 200SMA (112.13) in early Monday's trading and turning near-term focus higher, following Friday's close in red. Thickening daily cloud (111.54/110.43) continues to provide strong support (Friday's fall was contained just above cloud top) and underpin near-term action, as daily studies remain in firm bullish setup. Close above 200SMA will be bullish signal for retest of last week's high at 122.71 and attack at 112.80 target (Fibo 76.4% of 114.49/107.31 fall). Buying dips remains favored while daily cloud top holds. Alternative scenario sees risk of deeper pullback on firm break below daily cloud top and extension towards next support at 111.11 (rising daily Tenkan-sen/100SMA).
Res: 112.55, 112.80, 113.00, 113.55
Sup: 112.13, 111.65, 111.54, 111.11
Technical Outlook: GBPUSD – Monday’s Bounce Sidelines Downside Risk, Overall Picture Bullish
Cable bounces back to 1.3550 zone in early Monday's trading, sidelining downside risk, signaled by Friday's strong fall that formed bearish Outside Day.
The price remains within one-week congestion between 1.3451 and 1.3655 and showing no clear direction while within the range.
Near-term action regained momentum on today's bullish acceleration, eyeing initial barriers at 1.3585/95 (last Thu/Fri tops) firm break of which would trigger final push towards 1.3655 pivot (20 Sep spike high).
Daily studies remain in firm bullish setup and supportive for further upside. Sustained break above 1.3655 would open way towards next target at 1.3837 (Fibo 61.8% of 1.5016/1.1930 descend).
Short-term action remains also underpinned by thick weekly cloud (spanned between 1.3473 and 1.2371).
Conversely, bearish action through 1.3450 pivot (congestion low/Fibo 23.6% of 1.2773/1.3655 rally/rising 10SMA) would signal deeper pullback.
Res: 1.3570, 1.3595, 1.3618, 1.3655
Sup: 1.3471, 1.3450, 1.3402, 1.3318