Sample Category Title
GBPUSD Intraday Analysis
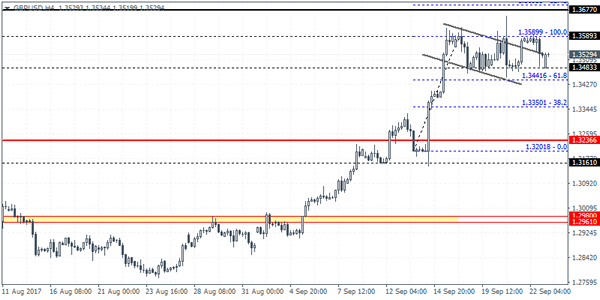
GBPUSD (1.3529): GBPUSD is seen posting a lower open today, but price action has quickly recovered to fill Friday's close. GBPUSD remains in a consolidation phase near the top end of the rally. The bullish flag pattern remains in play as GBPUSD was seen testing the support at 1.3483. Price needs to continue to the upside and preferably clear the resistance formed at 1.3589. A breach of this resistance is essential for the bullish flag to be validated. The current bias in GBPUSD remains to the upside unless we see a failure in the bull flag pattern. Resistance at 1.3677 will be initial target followed by 1.3829.
EURUSD Intraday Analysis
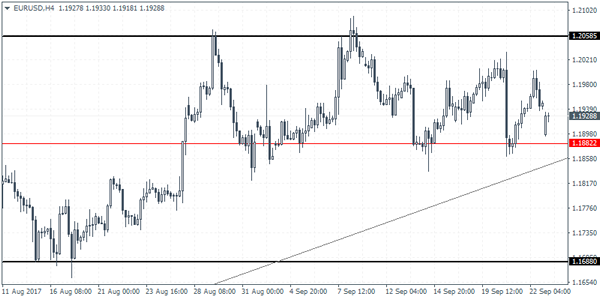
EURUSD (1.1928): EURUSD gapped lower on the open this morning, but theprice is currently looking to fill the gap from Friday's close. The resistance level at 1.1954 is currently the main level of interest. A breakout above this level could see further upside in price. On the 4-hour time frame, however, EURUSD is seen maintaining the ranging price action within 1.2085 and 1.1882 levels of resistance and support. This range is likely to persist until further breakout from this range will determine the future trend in prices.
Euro Gaps Lower But Recovers On German Elections
The markets were little changed this morning after the weekend elections from Germany and New Zealand. The German election results saw Angela Merkel winning another term as widely expected, but the fringe parties were seen making some inroads. This prompted Ms. Merkel to comment that she expected a better result but said that the good thing was that the status quo remains unchanged.
New Zealand also held elections over the weekend, and exit polls showed no clear winner. The election results are expected to be announced later in the week.
On the economic front, calendar today is marked mostly be speeches from central bankers. BoJ's Kuroda will be the first to speak, followed by a number of FOMC member speeches. The ECB President Draghi will also be speaking later today.
Currencies: German Election Outcome To Erode Euro Positive Momentum
Sunrise Market Commentary
- Rates: Short term Bund gains after German elections?
German elections ended with a Pyrrhic victory for Merkel's CDU/CSU and create some uncertainty. The SPD's voluntary move to the opposition paves the way for a coalition with Liberals and Greens, but is maybe less “European friendly”. Peripheral spread widening could be the result today, while the Bund could eke out some short term gains. - Currencies: German election outcome to erode euro positive momentum
Last week, USD softness prevailed. The German election outcome dominates headlines this morning and is considered as less EU friendly. This weighs on the single currency. Sterling was sold after a Moody's downgrade late on Friday', but the UK currency shows resilience as the dollar and the euro trade soft this morning.
The Sunrise Headlines
- US equities ended Friday's dull sideways session virtually unchanged. Asian equities, excluding Japanese ones, trade down in the opening session.
- German chancellor Merkel gained a 4th term but her party's result was the worst since 1949. A far-right party entered parliament in a sign of the growing polarization. Social democrats refuse to hold coalition talks, so Merkel will have to forge an agreement with the Liberals and Greens, creating uncertainty.
- A Republican attempt to repeal and replace Obamacare appeared headed for defeat after senator Collins said she doesn't see herself backing the plan and Senator Cruz said he's currently “not a yes.” However, uncertainty remains.
- Moody's cut the UK Aa1 rating to Aa2, outlook stable. The outlook for public finances has "weakened significantly," with fiscal consolidation plans in question and debt burden expected to continue to rise, Moody's justified. It may hit sterling, as Fitch and S&P have a negative outlook on their UK rating.
- Republican tax negotiators are targeting a corporate tax rate of 20%, according to people familiar with the matter. That would be higher than President Donald Trump wants -- setting up a key decision for the president.
- New Zealand PM English has claimed a mandate to form the next government after winning the biggest slice of the vote in Saturday's election, even as opposition leader Ardern refuses to concede defeat. NZD/USD trades lower.
- The Republicans cemented control over the French Senate, a setback for president Macron. However, it has only limited powers and its composition reflects the 2015 municipal elections (municipal councillors elect Senate).
- Today, attention goes to the IFO survey and manifold central bank speakers.
Currencies: German Election Outcome To Erode Euro Positive Momentum
German election to weigh on the euro ?
Sentiment on the dollar remained fragile on Friday as (geopolitical) uncertainty and a cautious risk-off mood deprived the dollar of highly needed interest rate support. The euro was supported by strong EMU PMI's. However, at the end of the day, the moves were modest. EUR/USD closed the day at 1.1951. USD/JPY finished the week at 111.99.
There are several stories to guide trading at the start of the new week. Japanese equities outperform as markets look out for new pro-growth measures as PM Abe is considering snap elections for next month. USD/JPY trades again in the 112.25 area, but is off the intraday top as global sentiment in the region is risk-off.
Chinese markets underperform, especially the property sector, on the announcement of measures to ease speculation. EUR/USD dropped temporary to the 1.19 area on the outcome of the German election. For now, the loss of euro is modest (currently around 1.11930/35). The New-Zealand election brought also a diffuse outcome as the ruling National party didn't get a majority. NZD/USD declined from the mid 0.73 area to the mid 0.72 area.
Today, the German IFO business Climate is expected virtually unchanged at the highest level ever. We don't have strong evidence to take a different view from the consensus. There also plenty of ECB and Fed governors scheduled to speak, including ECB Constancio, Mersch, President Draghi and Coeuré. From the Fed side, NY Fed Dudley and Chicago Evans are the speakers on duty. Dudley's speech probably won't address monetary policy. Evans is a dove and was probably one of the governors who don't see a rate hike anymore in 2017.
Last week, the dollar remained soft even as the Fed reiterated its intention to continue policy normalization. The euro profited slightly from strong PMI's. Today, the focus might be on the consequences of the German election outcome. The IFO will have to bring a big surprise to have impact on euro trading. The German election outcome is less positive for the EU and intra-EMU cooperation. This might widen intra-EMU spreads and cause some euro softness. At the same time, the sources of uncertainty that weigh on the dollar have still not gone. We start the week with a slightly euro negative bias. However, it is far from sure that the outcome of the German election will start a real sustained euro down-leg. EUR/USD 1.1823 remains to first reference
From a technical point of view EUR/USD hovers in a consolidation pattern between 1.1823 and 1.2070. It was disappointing for EUR/USD bears that the recent correction didn't reach the range bottom. More confirmation is needed that the bottoming out process in US yields and in the dollar might be the start of more sustained USD gains (against the euro). In case of a break, next support in EUR/USD comes in at 1.1774 and 1.1662
The day-to-day momentum in USD/JPY remains more constructive. However, this in the first place due to yen weakness. USD/JPY regained the 110.67/95 previous resistance, a short-term positive. Unless an unexpected risk-off event, the yen might remain in the defensive. The 114. 49 correction top is the next important reference.
EUR/USD: Will German election cause a euro negative repositioning?
EUR/GBP
No lasting sterling damage from Moody's downgrade
On Friday, sterling was at the mercy of the broader swings in the euro and the dollar as markets awaited UK PM May's Brexit speech in Florence. UK PM May brought some general considerations on the relationship between the EU and the UK, but stressed that the UK intends to maintain the best relations with the EU. The UK PM also advocated a transition period. Sterling initially declined, but soon regained most of the lost territory as the tone of the speech was reconciliatory. The reactions from Europe were mildly positive. Later in the session, the sterling faced another headwind as Moody's cut the rating of the UK from Aa1 to Aa2. This downgrade hammered sterling. EUR/GBP closed the session at 0.8850. Cable finished the day at 1.3504
Today, the euro is slightly in the defensive after the German election result. EUR/GBP dropped again to 0.88 barrier. Sterling profits from both underlying euro and USD softness and this may still go somewhat further. The recent lows in EUR/GBP (0.8775 area) are within reach.
EUR/GBP made an impressive uptrend since April and set a MT top at 0.9307 late August. Recent UK price data amended the dynamics and the reversal of sterling was reinforced by hawkish BoE comments. Medium term, we maintain a EUR/GBP buy-on-dips approach as we expect the mix of relative euro strength and sterling softness to persist. However, the prospect of (limited) withdrawal of BOE stimulus put a solid floor for sterling ST term. We look how far the current correction has to go. EUR/GBP is nearing support at 0.8743 and 0.8652, which we consider difficult to break. We start looking to buy EUR/GBP on dips
EUR/GBP: near recent lows
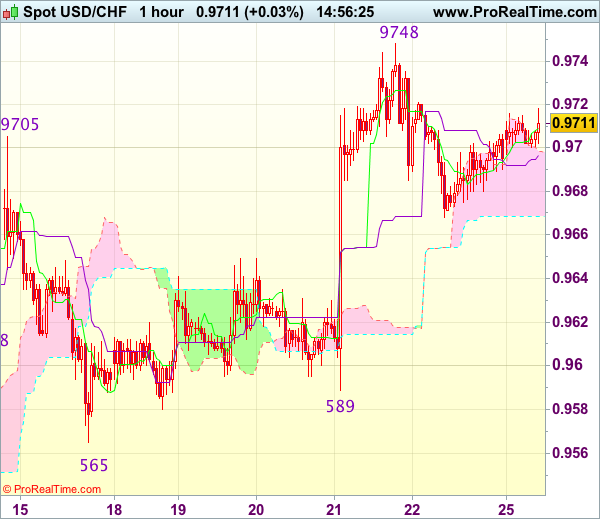
Trade Idea : USD/CHF – Stand aside
USD/CHF - 0.9704
Most recent candlesticks pattern : N/A
Trend : Near term up
Tenkan-Sen level : 0.9712
Kijun-Sen level : 0.9699
Ichimoku cloud top : 0.9699
Ichimoku cloud bottom : 0.9669
New strategy :
Stand aside
Position : -
Target : -
Stop : -
Although the greenback has edged higher after rebound from Friday’s low of 0.9668 and marginal gain from here cannot be ruled out, break of last week’s high at 0.9748 is needed to signal recent rise from 0.9421 low has resumed and extend gain to 0.9761-66 (50% Fibonacci retracement of 1.0100-0.9421 and previous resistance), then test of another previous resistance at 0.9773.
On the downside, below said support at 0.9668 would extend weakness to previous minor resistance at 0.9649 but break there is needed to signal top has been formed, bring further fall to 0.9620, however, price should stay well above indicated support at 0.9589, bring rebound later. As near term outlook is still mixed, would be prudent to stand aside for now.
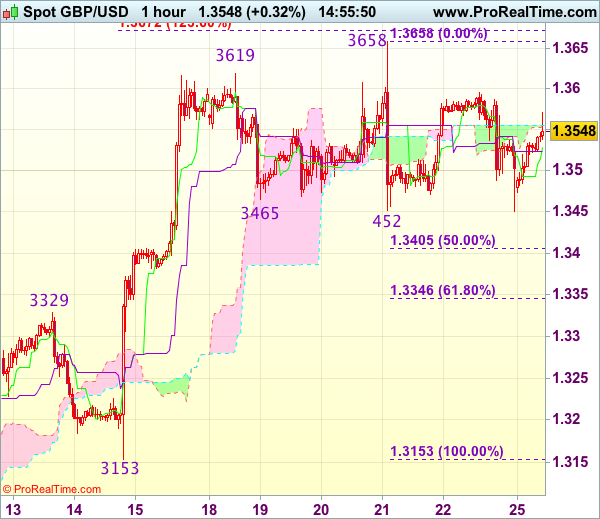
Trade Idea : GBP/USD – Stand aside
GBP/USD - 1.3551
Most recent candlesticks pattern : N/A
Trend : Up
Tenkan-Sen level : 1.3535
Kijun-Sen level : 1.3521
Ichimoku cloud top : 1.3557
Ichimoku cloud bottom : 1.3555
New strategy :
Stand aside
Position : -
Target : -
Stop : -
Despite falling to 1.3450 late Friday, lack of follow through selling on break of previous support at 1.3452 and the subsequent rebound suggest further consolidation would take place and recovery to 1.3585-90 cannot be ruled out, however, still reckon upside would be limited to 1.3615-20 and price should falter below last week’s high at 1.3658, bring another retreat later.
On the downside, below 1.3500-10 would bring another fall towards 1.3450 support but a firm break below there is needed to retain bearishness and signal top has been formed at 1.3658, bring retracement of recent rise towards 1.3400-05 (50% Fibonacci retracement of 1.3153-1.3658). As near term outlook is still mixed, would be prudent to stand aside for now.
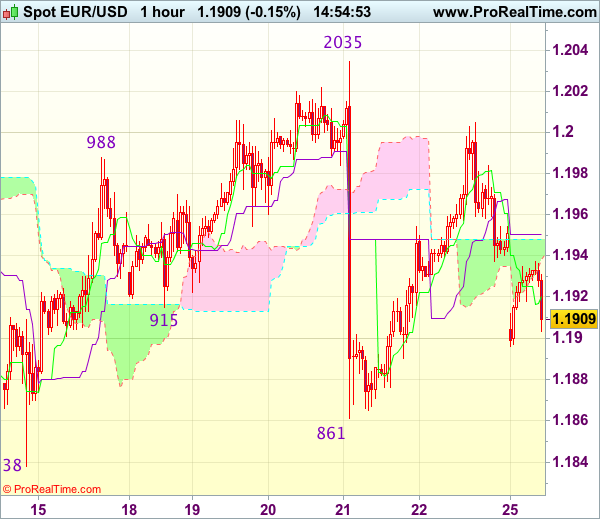
Trade Idea : EUR/USD – Hold short entered at 1.1970
EUR/USD - 1.1916
Most recent candlesticks pattern : N/A
Trend : Sideways
Tenkan-Sen level : 1.1920
Kijun-Sen level : 1.1951
Ichimoku cloud top : 1.1948
Ichimoku cloud bottom : 1.1940
Original strategy :
Sold at 1.1970, Target: 1.1870, Stop: 1.1970
Position : - Short at 1.1970
Target : - 1.1870
Stop : - 1.1970
New strategy :
Hold short entered at 1.1970, Target: 1.1870, Stop: 1.1970
Position : - Short at 1.1970
Target : - 1.1870
Stop : - 1.1970
Although the single currency rebounded after finding good support at 1.1861 last week, the subsequent retreat after meeting renewed selling interest just above 1.2000 level has retained our bearishness and consolidation with mild downside bias remains for another decline, below 1.1890 would bring test of said support at 1.1861 but break there is needed to extend the fall from 1.2035 to previous support at 1.1838 which is likely to hold on first testing.
In view of this, we are holding on to our short position entered at 1.1970. Only above resistance at 1.2005 would dampen our bearishness and risk test of last week’s high at 1.2035 but only break there would shift risk back to upside and extend the rebound from 1.1838 to 1.2060-70 first.
Daily Technical Analysis: EURUSD, GBPUSD, USDJPY, USDCHF
EURUSD
The EURUSD was indecisive last week. Price gapped lower earlier today opened at 1.1899. Overall I remain bullish but price is still trapped between 1.2090 – 1.1823 range area as you can see on my daily chart below. The bias is neutral in nearest term. Immediate resistance is seen around 1.1950. A clear break above that area could trigger further bullish pressure testing 1.2000 region. Immediate support is seen around 1.1865. A clear break below that area could trigger further bearish pressure testing 1.1823 key support which remains a good place to buy with a tight stop loss as a clear break below that area would take price to a bearish correction zone testing 1.1700 – 1.1600 region.
GBPUSD
The GBPUSD attempted to push higher last week slipped above 1.3615 key resistance but whipsawed to the downside and closed lower at 1.3484. Overall I remain bullish but the bias is bearish in nearest term testing 1.3400 – 1.3330 support area which is a good place to buy. Immediate resistance is seen around 1.3550. A clear break above that area could lead price to neutral zone in nearest term retesting 1.3615 key resistance which need to be clearly broken to the upside to continue the bullish scenario targeting 1.3700 – 1.3750 area as nearest bullish target. On the downside, a clear break below 1.3330 support area would take price to a bearish correction zone testing 1.3150 key support.
USDJPY
The USDJPY continued its bullish momentum last week topped at 112.71 but closed lower at 111.97. The bias is neutral in nearest term but as long as stay above 111.00 my H1 chart bias remains bullish targeting 113.50 as nearest bullish target. Immediate resistance is seen around 112.71. A clear break and daily close above that area could trigger further bullish pressure testing 113.50 or higher. Immediate support is seen around 111.65 followed by 111.00 key support. Overall I remain neutral.
USDCHF
The USDCHF had a bullish momentum last week topped at 0.9747 but closed a little bit lower at 0.9695. The bias is neutral in nearest term. Key resistance is seen around 0.9765 – 0.9807 area which is a good place to sell. Immediate support is seen around 0.9650. A clear break and daily close below that area could trigger further bearish pressure testing 0.9525 support area buy key support remains at 0.9450 which remains a good place to buy. Overall I am neutral on this pair.
Euro, New Zealand Dollar Fall On Election Results, Moody’s Cut The Rating On Brexit
Euro Slips After German Election Tests Angela Merkel's Coalition Building Skills. The Euro has climbed up from $1.1865 neckline support where it slipped in early Asian trading on Monday after Germany's election. Chancellor Angela Merkel won a fourth term in office on Sunday but will have to build an uneasy coalition to form a government after her conservatives haemorrhaged support in the face of a surge by the far-right. The Euro still remains stuck below the $1.2000 round number which it needs to retake to call off a head and shoulders top that has been forming.
Kiwi Took a Knock Early on Monday After Election. Political uncertainty also took a toll on the New Zealand dollar that slid down to its support at $0.7280 and is expected to be volatile today. The ruling National Party won the largest number votes in the election, but neither of the major parties won enough seats to gain a majority in parliament, leaving investors facing likely weeks of political horse-trading before a government is formed.
Moody's Cut the Rating on Brexit, Underscoring The Economic Risks. Sterling was steady after falling on Friday when a few hours after Prime Minister Theresa May set out plans for new ties with the European Union, ratings agency Moody's downgraded Britain's credit rating to Aa2, saying government plans to bring down debt had been knocked off course and Brexit would weigh on the economy. In her speech, May failed to give any concrete details for how Britain might retain preferential access to Europe's single market.
Aussie Starts to Roll Over Against Its Peers. The Australian dollar was a fraction softer on its U.S. counterpart at $0.7949 but gained on the euro after a German election also proved inconclusive. The Australian dollar also gained on the kiwi, edging up to NZ$1.0880 and off a six-week low around NZ$1.0774.
Gold Falls on Firmer Dollar. Gold prices eased early on Monday, after registering a second consecutive weekly fall last week, as the U.S. dollar firmed and as the euro edged lower on political uncertainty in Germany. Spot gold dipped 0.4 percent to $1,292.40 per ounce after falling about 1.7 percent last week in what was its second straight weekly fall.
Crude Oil Remains in Position to Extend the Rally. Despite the disappointing news from OPEC and WTI, that failed to reach a decision on extending its production cuts and may wait until January before deciding whether to extend their output curbs beyond the first quarter, markets continued to be underpinned by a bullish outlook for demand. Crude inventories rose for a third straight week, building by 4.6 million barrels. Traders had priced in a 2.8-million-barrel build.
Watch Out Today for:
07:35 am GMT: Bank of Japan Governor Kuroda Speech
15:00 pm GMT: ECB President Draghi's Speech
Forex Technical Analysis: EUR/USD, USD/JPY, GBP/USD
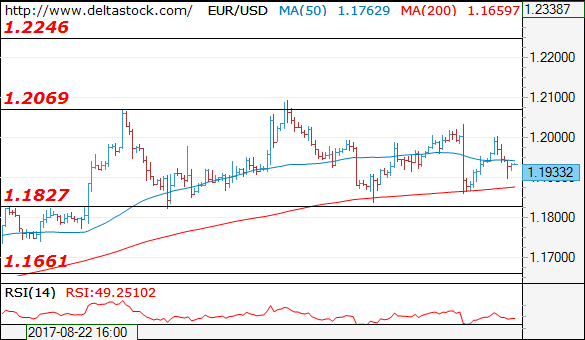
EUR/USD
Current level - 1.1933
The intraday bias is neutral as the pair is trading in the middle of 1.1830-1.2070 range. I favor a break on the upside to target 1.2070, en route to 1.2240.
| Resistance | Support | ||
| intraday | intraweek | intraday | intraweek |
| 1.2030 | 1.2160 | 1.1860 | 1.1830 |
| 1.2070 | 1.2500 | 1.1830 | 1.1660 |
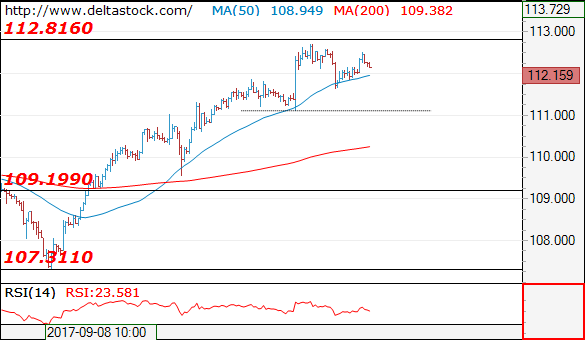
USD/JPY
Current level - 112.15
My outlook here is bearish below 112.80, for a slide towards 111.10 hurdle.
| Resistance | Support | ||
| intraday | intraweek | intraday | intraweek |
| 112.80 | 112.80 | 111.10 | 108.12 |
| 112.80 | 114.50 | 109.30 | 107.30 |
GBP/USD
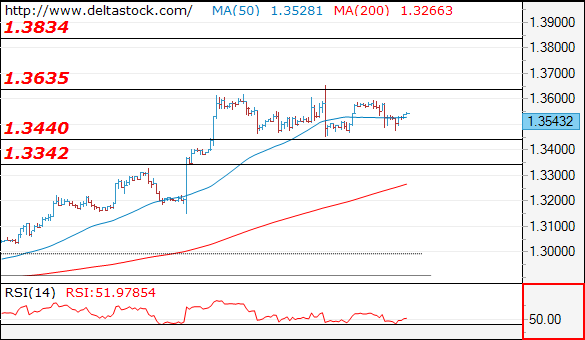
Current level - 1.3543
The support at 1.3440 is still intact and the bias is positive above that area, for a break through 1.3635, towards 1.3830 zone.
| Resistance | Support | ||
| intraday | intraweek | intraday | intraweek |
| 1.3630 | 1.3650 | 1.3440 | 1.3340 |
| 1.3650 | 1.3830 | 1.3340 | 1.3150 |