Sample Category Title
Dollar Eases Ahead Of FOMC Decision, Oil Up After Iraq Says To Cut Oil Supply
While geopolitical tensions escalated after the US President used stronger language against North Korea at his first speech in front of global leaders at the UN on Tuesday, the dollar showed relatively little reaction slipping near its two-year lows. Markets instead were more cautious about the FOMC decision to be announced later today, while they were also looking forward to the BOJ policy meeting scheduled for Thursday. Meanwhile, oil prices headed higher after OPEC member Iraq said it would take further action to limit its supply.
The dollar index was 0.10% down on the day at 91.70, showing a moderate reaction to Trump's debut speech at the UN General Assembly yesterday. Trump commenting on North Korea's nuclear programs warned to “totally destroy” the regime if it continued threatening the US or its allies.
Despite the fact that Trump's words heightened uncertainties over US-North Korea relations, the market reaction was less severe compared to previous instances, as investors were focused to hear the outcome of the two-day FOMC meeting concluding later today. Investors expect the Fed to hold rates steady and announce the reduction of its approximately $4.2 trillion balance sheet starting in October, while they are also eager to hear the Fed's rate projections. The policy statement will be released at 1800GMT before Fed Chair Janet Yellen holds a press conference half an hour later.
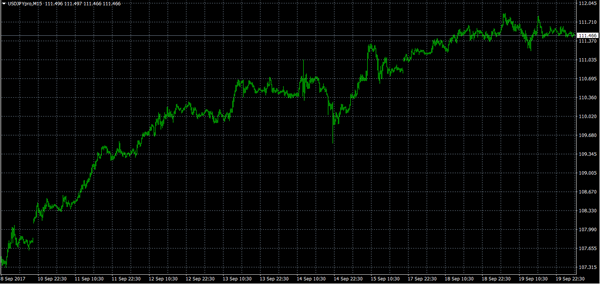
Dollar/yen weakened to 111.42 after approaching a two-month high of 111.82 on Tuesday. A factor contributing to the yen's strength was the lead of the Japanese Prime Minister, Shinzo Abe, in recent polls after reports that Abe will call a snap election as soon as next month. Market watchers will also keep a close eye on the BOJ policy meeting tomorrow, where they forecast policymakers to maintain their ultra-easy monetary strategy as inflation remains subdued.
In terms of data, Japanese exports increased unexpectedly by 18.1%, reaching the fastest growth since November 2013, while analysts projected exports to rise by 14.7%.
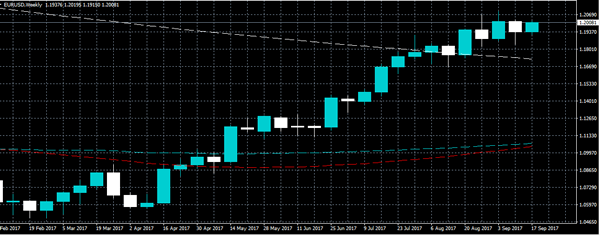
The euro continued its uptrend for the fifth day, rising to $1.2002 before the Asian close.
In other currencies, the aussie was trading 0.40% higher on Wednesday near a 1 ½ -week high at 0.8037, finding support on increasing government bond yields which rose to the highest level since late 2015. Meanwhile, the RBA's head of economics, Luci Ellis, said on Wednesday that the central bank is “comfortable” with the inflation path and the period needed for it to approach the target, adding that wages and inflation will remain low for some time as there is still room for employment to improve.
Its New Zealand cousin hit a one month-high of $0.7373 after the current account readings out of the country came in better than expected in the second quarter. The dairy price auction conducted the previous day also helped the kiwi.
Regarding oil prices, WTI crude jumped by almost 1% to $49.97 per barrel while London-based Brent surged by 0.51% to $55.42 after Iraq's energy minister, Jabar al-Luaibi, said on Tuesday at an energy conference in the United Arab Emirates that OPEC members. as well as other oil producers, are considering the option to extend or widen supply cuts a day after the API weekly report indicated a smaller than expected rise in US inventories.
Gold climbed by 0.10% to $1,312.71 per ounce.
Euro Might Correct Lower Vs Japanese Yen
Key Highlights
- The Euro surged higher this week and traded as high as 134.17 against the Japanese Yen.
- There is an important ascending channel forming with support at 133.65 on the 4-hours chart of EUR/JPY.
- Germany's Producer Price Index in August 2017 rose 0.2% (MoM), more than the forecast of 0.1%.
- Japan's Total Merchandise Trade Balance in August 2017 posted a trade surplus of ¥113.6B, more than the forecast of ¥93.9B.
EURJPY Technical Analysis
The Euro made good ground this week and moved above the 134.00 level against the Japanese Yen. The EUR/JPY pair traded as high as 134.17 and is currently correcting lower.
The current uptrend is supported by an important ascending channel with support at 133.65 on the 4-hours chart. Below the channel support at 133.65, the 23.6% Fib retracement level of the last wave from the 130.60 low to 134.17 high is a crucial support at 133.33.
If the pair breaks the channel support, it could test the 133.30 support area. Should there be a break below 133.30, the pair could test the 50% Fib retracement level of the last wave from the 130.60 low to 134.17 high at 132.40.
On the upside, the channel resistance is at 134.30. A push above the recent high at 134.17 is needed for further gains towards 134.50 in the near term. Alternatively, if the pair fails to hold 133.65, there can be an extended correction.
Germany's Producer Price Index
Today in the Euro Zone, the Producer Price Index for August 2017 was released by the Statistisches Bundesamt Deutschland. The forecast was slated for a rise of 0.1% in the PPI compared with the previous month.
However, the actual result was above the forecast, as the PPI in August 2017 increased 0.2%. Looking at the yearly change, there was an increase of 2.6%, more than the forecast of 2.5% and higher than the last +2.3%.
The report added:
In August 2017 the price indices of all main industrial groups increased compared with August 2016: Prices of non-durable consumer goods rose by 3.6%, prices of intermediate goods by 3.3%. Energy prices rose by 2.7%, though the development of prices of the different energy carriers diverged.
Overall, the market sentiment is positive for EUR/JPY, but it has to stay above 133.30 to remain in the bullish zone.
Euro Approaching Former Weekly High
.
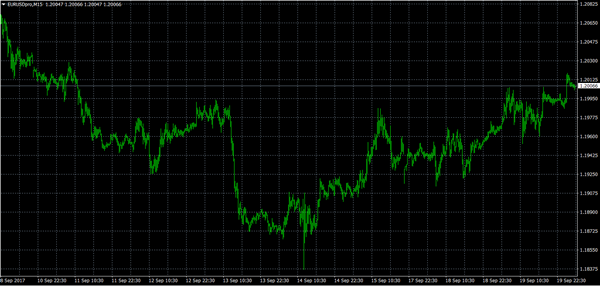
The euro has reclaimed the 1.2000 handle against the U.S dollar, ahead of today's Federal Reserve interest rate decision. The EURUSD pair has so far reached 1.2019, with price-action falling just short of the former weekly high, at 1.2029.
Price-action on the EURUSD is currently strongly bullish, with the pair threatening to break higher to new 2017 trading high's, if the Federal Reserve disappoint market participants later today.
Going forward, a series of higher time-frame price close above the 1.2038 level should signal further strong gains for the euro. To the downside, a break below the 1.1937 level should signal a deeper price correction lower in the euro.
Key intraday resistance for the EURUSD above the 1.2038 level is found at 1.2069, 1.2092, 1.2131 and 1.2160.
Key intraday technical support for EURUSD pair is found at the daily pivot at 1.1985, the 1.1957 level, and the weekly pivot point, at 1.1938.
Below the 1.1937 level, further support is located at the 1.1915, 1.1889, and the monthly time-frame 50-period moving average, at 1.1871.
Sterling Neutral Ahead Of UK Retail Sales
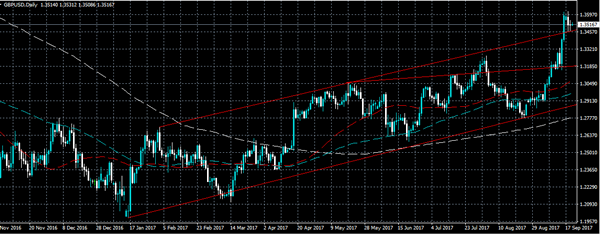
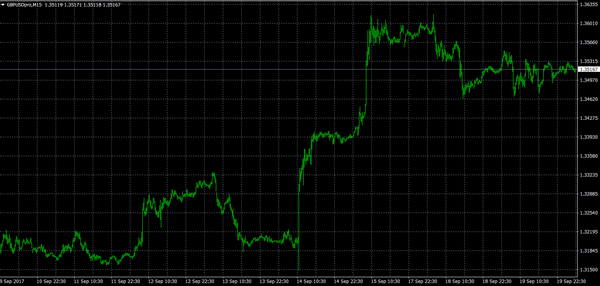
The GBPUSD pair has recovered above the 1.3500 handle, after yesterday's brief dip to 1.3469, ahead of the release of key United Kingdom retail sales data today, for the month of September.
Sterling is currently range-bound, with a neutral intraday trading bias, as the pair trades above its daily pivot point, at 1.3509, but is seemingly unable to close price above the weekly pivot point, located at 1.3553.

Despite sterling's neutral intraday bias, the GBPUSD pair remains bullish in the medium and long-term. Any corrections below the 1.3400 handle are likely to be met with strong buying interest.
Key intraday GBPUSD support is found at the 1.3492 level, and the current weekly price low, at 1.3465. Further support is found at the 1.3420 level, and the key 1.3388 level.
Key intraday GBPUSD resistance is found at 1.3532 and the pairs weekly pivot point, at 1.3553, and the recent swing price-high, at 1.3569.
Above the 1.3569 level, further upside resistance is found at the 1.3618,1.3630,1.3670 and 1.3711.
Wednesday Is Fed Day
All eyes are on monetary policy Wednesday, as the Federal Reserve gets set to deliver its first interest rate decision since July. The official statement and accompanying press release could provide vital information about the Fed’s plan to begin normalizing its inflated balance sheet.
On the data docket, Germany will release the monthly producer price index (PPI) at 06:00 GMT. Producer inflation is expected to rise 2.5% annually in August, up from 2.3% the previous month.
A British report on retail sales will also make headlines Wednesday, providing investors with the latest reading on consumer spending. Receipts at retail stores are forecast to rise 0.2% in August, after gaining 0.3% the month before. That translates into a year-over-year gain of 1.1%. Excluding fuel, sales are expected to climb 0.2% on month and 1.4% annually.
Shifting gears to North America, the National Association of Realtors will release its closely watched existing home sales report. The sale of previously-owned homes is forecast to edge up 0.3% in August after tumbling 1.3% the month before.
The Federal Open Market Committee (FOMC) will wrap up its meeting at 18:00 GMT, with a press conference scheduled 30 minutes later. Although no change to the benchmark interest rate is expected, policymakers could announce plans for unwinding their $4.5 trillion balance sheet.
The official statement will also be accompanied by quarterly projections covering GDP, unemployment and inflation.
Earlier in the day, the Japanese government reported a smaller than expected drop in the August trade surplus. The merchandise trade surplus came in at ¥113.6 billion yen, down from ¥418.8 billion the month before. Exports surged 18.1% year-over-year, while imports expanded 15.2%.
EUR/USD
The euro regained its footing on Tuesday, and was last seen trading above 1.2000 US. The EUR/USD pulled ahead as the dollar weakened in anticipation of the Federal Reserve’s policy decision. The common currency’s technical picture remains favourable, with prices eyeing resistance at the multi-year high of 1.2101. On the flipside, immediate support extends toward 1.1910.
GBP/USD
Pound sterling caught a major tailwind last week after the Bank of England (BOE) sent its strongest signal yet that interest rates are headed higher. Cable has since backtracked from its highs near 1.3600, but remains well supported in a bullish range north of 1.3500. The GBP/USD is consolidating at the 23.6% Fibonacci retracement of its latest bullish run. The pair faces immediate support at the 38.2% Fibonacci retracement of 1.3440.
USD/JPY
Despite recent volatility, the dollar continues to trade at two-month highs against the yen. The USD/JPY has consolidated in the mid-111.00 range, as the return of risk sentiment undermined the yen. The pair remains well supported on the short-term charts, with immediate resistance located at 111.76.
EUR/CHF Elliott Wave Analysis
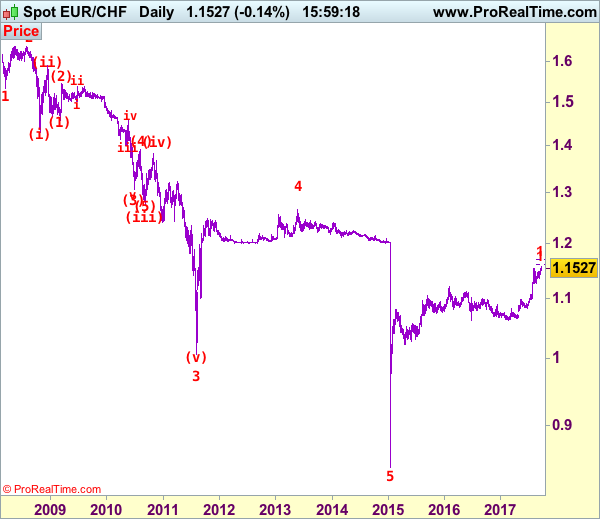
EUR/CHF : 1.1527
The single currency only retreated to 1.1345 (we recommended in our previous update to buy at 1.1330 and just missed our long entry) before finding renewed buying interest, the subsequent anticipated rally together with the breach of previous resistance at 1.1538 (wave iii top) add credence to our bullish view that medium term upmove has resumed and upside bias remains for further gain in wave v to 1.1600, then towards 1.1695-00 (61.8% projection of 1.0833-1.1538 measuring from 1.1259), however, this wave v is likely to be limited to1.1800 and price should falter well below 1.2000, bring correction later.
To recap our preferred count, the decline from 1.6828 (end wave (B)) is labeled as the beginning of wave (C) which should unfold as an impulsive move with 1: 1.5326, 2: 1.6377 and wave 3 is sub-divided into (i): 1.4300, (ii): 1.5880 and wave (iii) is still unfolding with (1): 1.4577, (2): 1.5448 and wave (3) is an extended 3rd with i: 1.5006, ii: 1.5383, wave iii: 1.3073, then wave iv ended at 1.3925 and wave v at 1.3073, wave (4) ended at 1.3925 and wave (5) has ended at 1.2765 which also marked the low of wave (iii) and wave (iv) has ended at 1.3835 and wave (v) as well as larger degree wave 3 has ended at 1.0075. The selloff from 1.2650 signals wave 4 has ended there and we are taking a view that the wave 5 could also have ended 0.8426, hence consolidation is seen with mild upside bias for rebound to 1.1400 (already met), then towards 1.1600.
On the downside, whilst initial pullback to 1.1490-00 is likely, reckon 1.1450 would limit downside and bring another rise later. Only a drop below said support at 1.1345 would abort and suggest top is possibly formed, bring subsequent weakness towards another previous support at 1.1259, a daily close below this level would indicate wave v has ended instead, bring major correction to 1.1200, then 1.1150-55.
Recommendation: Buy at 1.1455 for 1.1655 with stop below 1.1355.
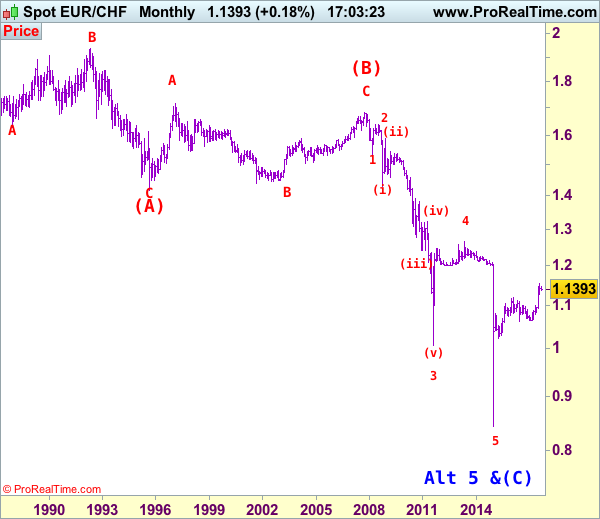
The long-term downtrend started from 1.9626 (Apr 1985) to 1.4166 (Sep 1995) is treated as wave (A) with A:1.6285 (Dec 1987), B: 1.9342 (May 1992) and C: 1.4166, then wave (B) ended at 1.6828 with A: 1.7147 (Feb 1997), B: 1.4398 (Sep 2001), C: 1.6828 (Nov 2007), therefore, wave (C) is now in progress with the breakdown indicated as above. This wave (C) already met indicated downside target at 1.1455/60 and 1.1300, it could have ended at 0.8426, consolidation with mild upside bias is seen for gain to 1.1000 and later towards 1.2000.
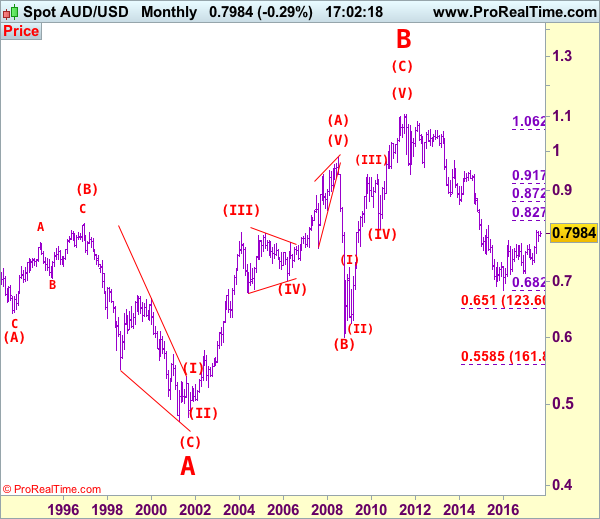
AUD/USD Elliott Wave Analysis
AUD/USD – 0.8009
Although aussie extended recent rise to as high as 0.8125, the subsequent retreat suggests consolidation would be seen and weakness to 0.7900 and possibly support at 0.7867-71 cannot be ruled out, however, break there is needed to signal a temporary top is formed, bring retracement of recent upmove to 0.7808 support which is likely to hold on first testing, bring rebound later.
We are keeping our count that top has been formed at 1.1081 (wave 5 of V) and major correction (A-B-C-X-A-B-C) has commenced, indicated downside targets at 0.7945 (61.8% Fibonacci retracement of entire rise from 0.6007-1.1081) and 0.7750 had been met and downside bias is seen for further weakness to 0.6800, then 0.6700 but reckon 0.6500 would hold from here.
Our preferred count is that the rally from 0.6007 to 0.7270 (7 Jan 2009) is marked as wave A, the retreat to 0.6248 (2 Feb 2009) is wave B and the subsequent upmove is labeled as wave C with wave (iii) and wave (iv) ended at 0.8265 and 0.7700 respectively and wave (v) as well as 3 ended at 0.9407, then wave 4 ended at 0.8066 (instead of 0.8578). The wave 5 has met our indicated projection target of 1.1060 and could ended at 1.1081, this level is now treated as the peak of wave (C) as well as larger degree wave B, hence major fall in wave C has commenced, our initial downside target at psychological support at 0.7000 has just been met and further weakness to 0.6500 would be seen later.
On the upside, expect recovery to be limited to 0.8060-70 and said resistance at 0.8126 should hold, bring retreat later. A break of 0.8126 would signal recent erratic rise is still in progress and may extend further gain to previous resistance at 0.8163, then 0.8200, however, loss of upward momentum should prevent sharp move beyond 0.8260-65 (61.8% projection of 0.7329-0.8066 measuring from 0.7808), risk from there is seen for a retreat later.
Recommendation: Venture short at 0.8070 for 0.7870 with top above 0.8170.
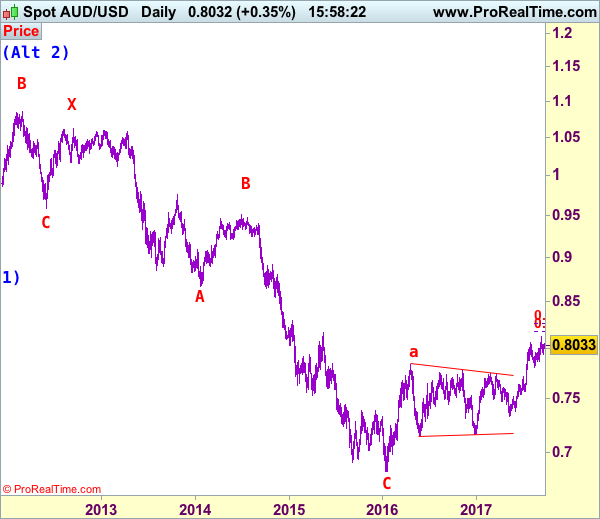
Our alternate count on the daily chart treated the top formed in 2008 at 0.9851 could be a larger degree wave I and was followed by a deep and sharp correction in wave II to 0.6007 and wave III is unfolding from there.
The long-term uptrend started from 0.4775 (2 Apr 2001) with an impulsive structure. Wave I is labeled as 0.4775 to 0.9851 (15 Jul 2008), wave II has ended at 0.6007 (Oct 2008) and wave III is still in progress which may extend further gain to 1.1265.
Daily Technical Analysis: EURUSD, GBPUSD, USDJPY, USDCHF
EURUSD
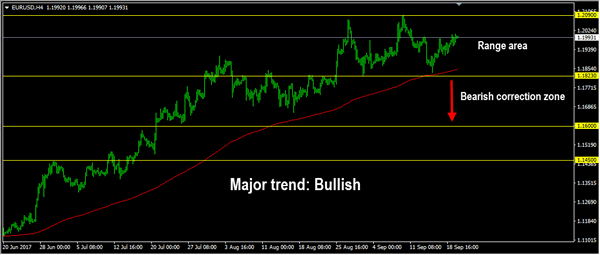
The EURUSD had a moderate bullish momentum yesterday topped at 1.2006. The bias is bullish in nearest term testing 1.2090 key resistance which need to be clearly broken to the upside to continue the bullish scenario targeting 1.2175 area. Immediate support is seen around 1.1950. A clear break below that area could lead price to neutral zone in nearest term but key support remains around 1.1823 area, which remains a good place to buy with a tight stop loss as a clear break below that area would take the pair to a bearish correction zone.
GBPUSD
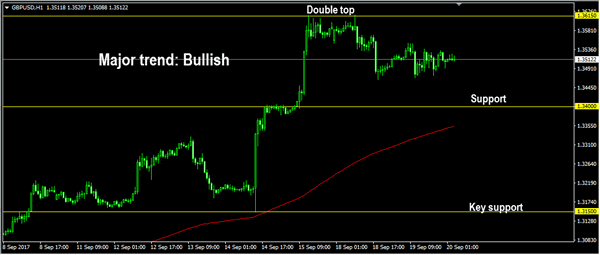
The GBPUSD was indecisive yesterday. The bias is neutral in nearest term. Overall I remain bullish but price is still in a bearish correction/consolidation phase after formed a double top formation as you can see on my H1 chart below. Immediate support is seen around 1.3465 followed by 1.3400 region. Immediate resistance is seen around 1.3550. A clear break above that area could trigger further bullish pressure retesting 1.3615 key resistance which need to be clearly broken to the upside to continue the bullish scenario targeting 1.3700 – 1.3750 area.
USDJPY
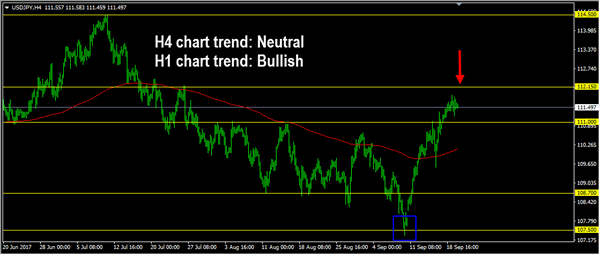
The USDJPY was indecisive yesterday. The bias is neutral in nearest term but overall price is still in a bullish phase since bounced-off 107.50 support area. Immediate support is seen around 111.00. A clear break below that area could trigger further bearish pressure testing 110.50 or lower. Immediate resistance is seen around 112.15. A clear break and daily close above that area could trigger further bullish pressure testing 113.10/50 area. Overall I remain neutral.
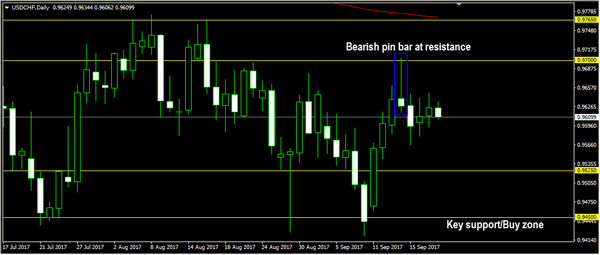
USDCHF
The USDCHF had another indecisive movement yesterday. There are no changes in my technical outlook. The bias remains neutral in nearest term probably with a little bearish bias testing 0.9565 – 0.9525 support area as a part of the bearish scenario after the appearance of the bearish pin bar on daily chart last week. Immediate resistance remains around 0.9650. A clear break and daily close above that area could trigger further bullish pressure testing 0.9700 region or higher. On the downside, a clear break and daily close below 0.9525 would expose 0.9450 key support which remains a good place to buy.
Trade Idea: GBP/USD – Buy at 1.3380
GBP/USD – 1.3519
Original strategy :
Buy at 1.3400, Target:1.3600, Stop: 1.3340
Position: -
Target: -
Stop: -
New strategy :
Buy at 1.3380, Target:1.3580, Stop: 1.3320
Position: -
Target: -
Stop:-
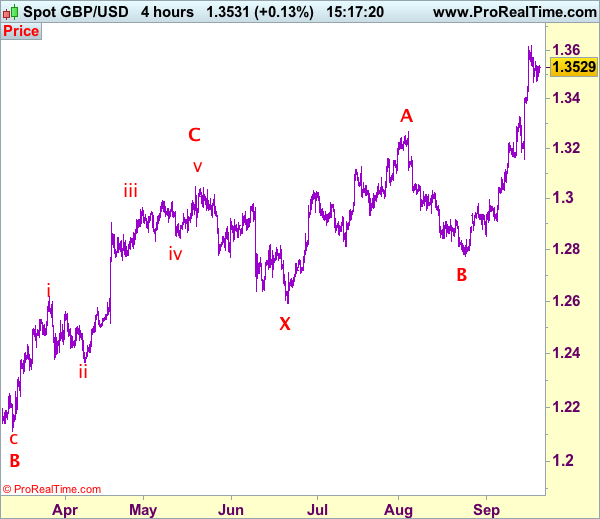
Cable’s retreat after meeting resistance at 1.3619 has retained our view that consolidation below this level would be seen and retracement to 1.3440-50 is likely, however, reckon 1.3380-85 would limit downside and bring another rise later, above resistance at 1.3552 would signal the retreat from 1.3619 has ended, bring retest of this level first. Looking ahead, a break of 1.3619 would extend recent upmove to 1.3650-60, then towards 1.3700. We have re-labeled our preferred count (pls see the attached chart) that the wave IV is unfolding as a complex double three (ABC-X-ABC) correction with 2nd wave B ended at 1.2774, hence 2nd wave C is unfolding and may extend further gain to 1.3650, then 1.3700, however, near term overbought condition should limit upside to 1.3770-75 and reckon 1.3800-10 would hold from here, bring retreat later.
In view of this, would not chase this rise here and would be prudent to buy sterling on subsequent pullback as 1.3380-85 should limit downside. Only below previous resistance at 1.3329 (now support) would abort and signal a temporary top is formed instead, bring deeper correction to 1.3290-00 and possibly towards 1.3250-60.
Our preferred count on the daily chart is that cable's rebound from 1.3500 (wave (A) trough) is unfolding as a wave (B) with A ended at 1.7043, followed by triangle wave B and wave C as well as wave (B) has ended at 1.7192, the subsequent selloff is the larger degree wave (C) which is still unfolding with minor wave (III) of larger degree wave 3 ended at 1.1986, hence wave (IV) correction is in progress which could either be a triangle wave (IV) of a complex formation but upside should be limited to 1.3500 and price should falter well below 1.4000, bring another decline in wave (V) of 3 for weakness to 1.1500, then 1.1200.
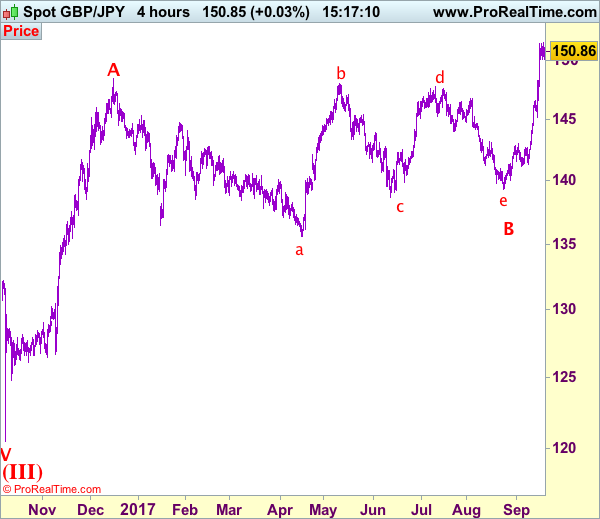
Trade Idea: GBP/JPY – Hold short entered at 151.00
GBP/JPY - 150.60
Original strategy:
Sold at 151.00, Target: 149.00, Stop: 151.60
Position: - Short at 151.00
Target: - 149.00
Stop: - 151.60
New strategy :
Hold short entered at 151.00, Target: 149.00, Stop: 151.05
Position: - Short at 151.00
Target: - 149.00
Stop:- 151.60
Sterling has remained confined within near term established range and further consolidation would be seen, however, reckon upside would be limited to 151.00 and bring retreat later, below 150.00-10 would suggest a temporary top is possibly formed, bring retracement of recent rise to 149.50, then 149.00, however, reckon previous resistance at 148.35 (now support) would hold and bring rebound later.
In view of this, we are holding on to our short position entered at 151.00. A firm break above 151.00-05 would suggest the pullback from 151.55 has ended, bring retest of this resistance, break there would extend recent rise to 152.00, then 153.00, however, overbought condition should limit upside to 154.00-10 and price should falter below 155.00. Our latest preferred count is that triangle wave B correction ended at 139.35 (the final e leg of triangle), hence wave C has commenced and may extend further gain to 153.00 and later 154.00.
Our preferred count is that larger degree wave V with circle is unfolding from 251.12 with wave (I) 219.34, (II): 241.38 and wave (III) is subdivided into 1: 192.60, 2: 215.89 (23 Jul 2008) and wave 3 ended at 118.87 earlier in 2009. The correction from there to 162.60 is wave 4 which itself is a double three and is labeled as first a-b-c ended at 151.53, followed by wave x at 139.03, 2nd a ended at 162.60, 2nd b at 146.75 and 2nd c leg of wave 4 ended at 163.00. Therefore, the decline from 163.00 to 116.85 is now treated as wave 5 which also marked the end of larger degree wave (III), hence wave (IV) major correction has commenced for retracement of the wave (III) from 241.38 and upside target at 183.95-00 (50% Fibonacci retracement of the wave (II) from 241.38) had been met, a drop below 160.00 would suggest wave (IV) has ended at 195.85, bring decline in wave (V) for initial weakness to 130 (already met) and 120.