Sample Category Title
XAUUSD Analysis: Makes Premature Rebound
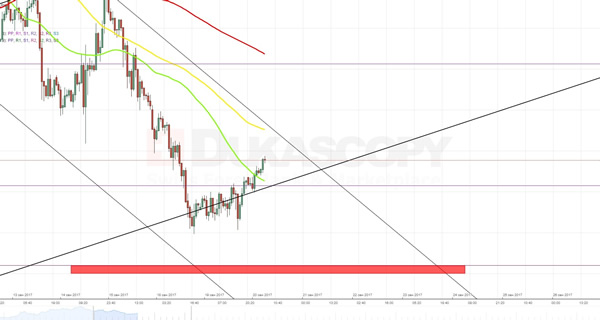
Contrary to expectations, the pair did not try to test a strong support level near the 1,300.00 mark. In contrast, it made a premature turn-around and bypassed the weekly S1 at 1,310.77 as well as the 55-hour SMA. Such outcome suggests that at least first half of this trading day the gold might spend in further advance against the buck. However, it is unlikely that the pair will manage to break through the upper trend-line of a guiding descending channel that is additionally backed up by the 100-hour SMA. This assumption is also supported by the general picture on a daily chart. However, there is a need to notice that the eventual outcome will greatly depend on decision and comments made by the Federal Reserve later this day.
USDJPY Analysis: Tries To Break Below 111.26
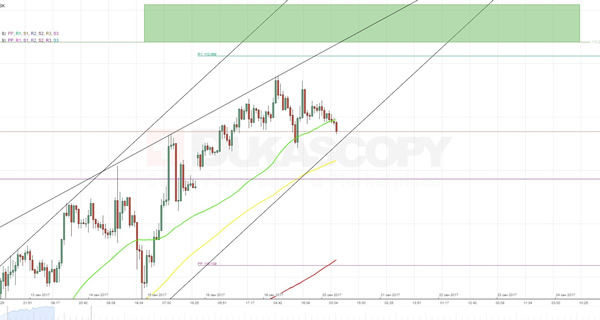
Even though in the early Tuesday morning the pair moved quite confidently towards the weekly R1, which is located at the 112.07 level, in second half of the day it made a rebound and did not go above the 111.90 mark anymore. Surprisingly, but a release of better than expected American housing data did not led to appreciation of the Greenback against the Yen. Such outcome suggests considering a possibility of transformation of a dominant ascending channel into a rising wedge. However, even if the new pattern will take the lead this fact should not change the general yesterday's scenario. On the other hand, the relevance of this pattern will greatly depend on the Fed's decision that will be made later this day.
GBPUSD Analysis: Forms Minor Symmetrical Triangle
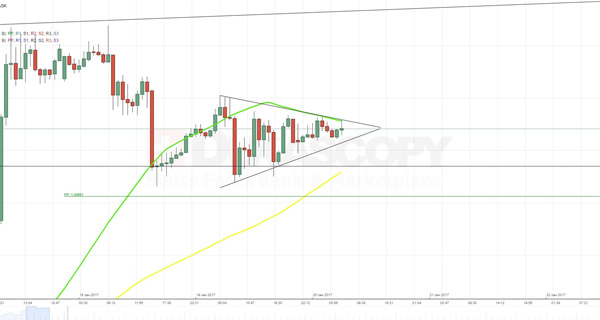
Unfortunately for the Pound, previous trading session signified the end of an upside momentum that guided movement of the pair over the last four days. On hourly chart it is easy to note how the 55-hour SMA managed to neutralize multiple attempts to break to the top. However, from the opposite direction the fall of the rate was similarly constrained by the monthly R2 at 1.3485. In result of this consolidation the currency pair is now fluctuating in a minor symmetrical triangle whose breakout point in terms of time coincides with announcement of the Federal Funds Rate. On the other hand, there is a need to take into account that the above pattern is likely to broken a little bit earlier due to reaction on release of data on the UK Retail Sales.
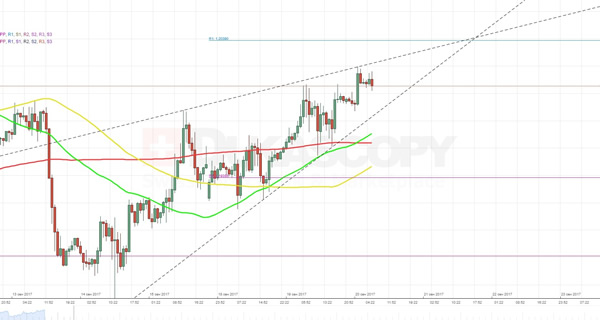
EURUSD Analysis: Waits For Fed’s Decision
In line with expectations, a pressure from the 55- and 200-hour SMAs, better than expected German release as well as general informational background helped to pair to make a breakout from an ascending triangle pattern yesterday. From technical point of view, the currency rate is continuing to feel pressure from the bottom from the before-mentioned moving averages. Hence, an area between 1.2030 and the weekly R1, which is located at the 1.2039 level, represents the next likely target to be reached by the pair. By the way, the moment of approaching to this resistance level practically coincides with the announcement of the Federal Funds Rate. In addition, that area also represents a breakout point from the recently formed rising wedge pattern.
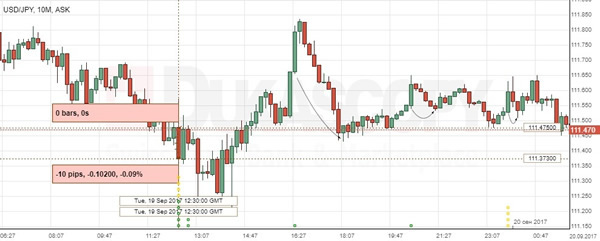
USD/JPY: US Building Permits
The US economic reports caused a temporary depreciation of USD/JPY during the Tuesday session. The Greenback lost against the Japanese Yen 10 base points or 0.09% to be seen trading near the 111.37 mark, though the decrease was not sustained as figures failed to impress the market.
The Commerce Department revealed that the US building permits rose to the strongest level in seven months over the course of August with the total number of 1.30M permits issued. The property market was moving ahead before an expected transitory hit from Hurricanes Irma and Harvey. Though, the number of permits in damaged areas was not significantly weaker, housing could stay a drag on the US economy in the third quarter.
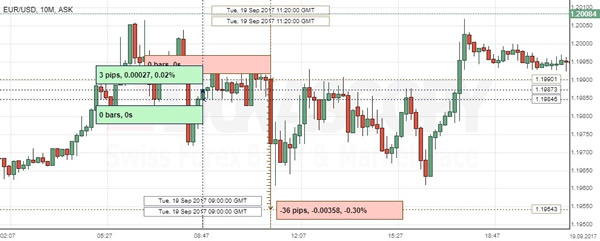
EUR/USD: German ZEW Economic Sentiment
The EUR/USD exchange rate was slightly affected by the German economic figures to rise modestly to the 1.1987 mark. However, some hours later the pair showed a 0.30% volatility finishing in the 1.197 area, as news agencies' posted reports suggested that the European Central Bank could postpone its decisions on tapering of its QE towards December due to the strength of the European single currency.
An upbeat figures coming from Germany managed to sustain relatively strong position of the Euro. The ZEW survey revealed that the country's business sentiment improved more than anticipated to 17 points this month. Meanwhile, the evaluation of the current situation was also more optimistic with the index edging up to 87.9.
Technical Outlook: GBPUSD Eyes UK Retail Sales For Fresh Signal
Cable is standing at the front foot in early Wednesday's trading but the action so far holds within hourly cloud, top of which continues to limit upside attempts. Trading on Tuesday ended in long-legged candle and failed to provide firmer direction signals after the price pulled back from fresh high at 1.3618 but dip was so far limited at 1.3464. Bullish daily studies are generating negative signal as overbought RSI and slow stochastic are turning lower, but without reaction so far. UK retail sales are in focus today, with forecasts for August being below previous month's reading (retail sales m/m Aug f/c 0.2% vs 0.3% in July; core retail sales m/m Aug f/c 0.2% vs 0.5% in July). Release above forecasted levels would generate fresh support for sterling with upbeat numbers in Aug seen as support for hawks advocating BoE rate hike in coming months. Bullish scenario would result in retest of 1.3618 high and possible extension above on stronger bullish acceleration, while miss (release at/below forecast) would put pound under pressure and risk probes below 1.3464 (18 Sep correction low) towards pivot at 1.3439 (Fibo 38.2% of 1.3148/1.3618 upleg). Loss of the latter would spark further weakness towards rising daily Tenkan-sen at 1.3355.
Res: 1.3551; 1.3582; 1.3618; 1.3646
Sup: 1.3535; 1.3464; 1.3439; 1.3383
Technical Outlook: EURUSD Is Holding In Tight Range Around 1.2000 Ahead Of Fed’s Verdict
The Euro remains supported and hit new recovery high at 1.2019 in early Wednesday's trading, in extension of past four days recovery rally from 1.1737 low.
Tuesday's eventual close above daily Tenkan-sen line (1.1964) was a bullish signal as bulls look for close above another pivot at 1.1994 (Fibo 61.8% of 1.2092/1.1737 pullback) for confirmation.
Bullish daily techs are supportive for further advance with sustained break above 1.2000 barrier to open way towards recent peak at 1.2092, as there are no further obstacles en-route.
Rising 10SMA and broken daily Tenkan-sen offer solid supports at 1.1967/64, followed by ascending 20SMA at 1.1936.
On the other side, slow stochastic is entering overbought territory on daily chart and signals corrective easing in the near term.
Today's focus in on Fed, as two-day policy meeting ends today and the US central bank is expected to give more clues about the possibility of another rate hike this year, which is widely expected in December.
The Fed is facing difficult decision on whether to raise interest rates for the third time this year or to stay on hold until inflation improves. Stubbornly low inflation makes the big obstacle for the policymakers, as the Fed is caught between low inflation and strong signals of improvement in global economy.
Along with interest rate hike signals, markets also expect Fed to signal the beginning of reduction of its massive $4.2 trillion holding in bonds and mortgage-backed securities, which were accumulated in response to global crisis and recession.
The dollar is expected to receive significant boost if Fed provides stronger signals about interest rates and balance sheet reduction, which could send the single currency significantly lower, while opposite scenario on dovish signals from Fed would inflate the Euro for rally towards next target at 1.2166.
Quiet trading is seen likely on Wednesday ahead of Fed's announcement, due at 18:00 GMT.
Res: 1.2096, 1.2032, 1.2070, 1.2092
Sup: 1.1964, 1.1935, 1.1900, 1.1877
AUDUSD Neutral To Bullish, Rally Stalls Around Key 0.8000 Level
AUDUSD is neutral to bullish and is pivoting around the key psychological level at 0.8000 after hitting its highest level since May 2015 at 0.8124. The RSI and MACD oscillators are flat, indicating a loss in upside momentum. This suggests that the market has put in a short-term top after the subsequent slide from this September 8 high.
Sideways trading is expected in the near term within a range of 0.7934 and 0.8057. Strong support is expected at 0.7934 as this is the 23.6% Fibonacci retracement level of the uptrend from 0.7328 to 0.8124. A move below the current range would shift the focus to the downside.
Loss of support at the next Fibonacci level at 0.7818 would open up the downside for a move towards the 50% Fibonacci at 0.7724. Another leg lower would start reversing the recent uptrend and shift the bias to a more bearish one with scope to target the 0.7328 low.
There is little immediate risk of a downturn right now. A move further away from 0.8000 to the upside could see a re-test of the 0.8124 peak. Clearing this high would see a resumption of the uptrend for a push towards the next major high of 0.8162 from May 2015.
Overall, AUDUSD retains a technically bullish picture for the medium term. The 50-day and 200-day moving averages are positively aligned after a bullish crossover on July 14. Additionally, both moving average lines are pointing up. Momentum oscillators (RSI and MACD) are in bullish territory although they are flat and suggesting a neutral bias for AUDUSD in the short-term.
EURJPY Is Neutral But Broader Bullish Technical Picture Intact
EURJPY has turned neutral in the short-term after the rally to 134.16 stalled. This was the highest level since December 2015. The momentum oscillators on the 4-hour chart are flat and are pointing to range trading for now in the upper 133.00 handle. Meanwhile, the RSI reached 70 which is indicative of an overbought market.
The Ichimoku cloud analysis shows that the broader bullish trend in EURJPY remains intact and is well-supported by a bullish alignment of the Tenkan-sen and Kijun-sen lines. Immediate support is being provided by the Tenkan-sen at around 133.70. Failure of support here would result in a corrective move of the pair's recent gains.
Another support is expected at yesterday's low of 133.26 ahead of the key 133.00 level. Below this the Kijun-sen line could be seen as a possible support level at 132.38. Another leg lower would target the round level at 132.00. More weakness in the market and a deeper correction in EURJPY would indicate the current bullish phase has ended.
A break above the 134.16 high would act as a catalyst for a move higher towards the next major top at 134.58 (from November 2015).
Based on the momentum indicators, more range trading seems the most likely prospect for EURJPY in the near term. As long as the market remains above 133.00 the outlook will stay bullish