
Sample Category Title
GBP/USD Continued Short-Term Consolidation
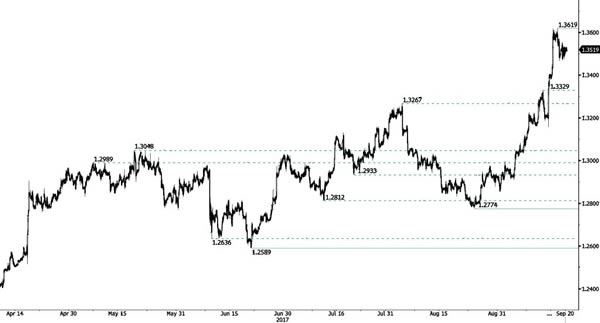
GBP/USD is consolidating lower after recent surge. Hourly resistance is given at 1.3619 (18/09/2017 high). Strong support is given at 1.2774 (24/08/2017 low). Expected to show continued bearish consolidation.
The long-term technical pattern is reversing. The Brexit vote had paved the way for further decline. Long-term support can be found at 1.1841 (07/10/2017 low). Long-term resistance given around 1.35 is at stake and indicates a long-term reversal in the negative trend. Yet, it is very unlikely at the moment.
EUR/USD Pushing Towards 1.21
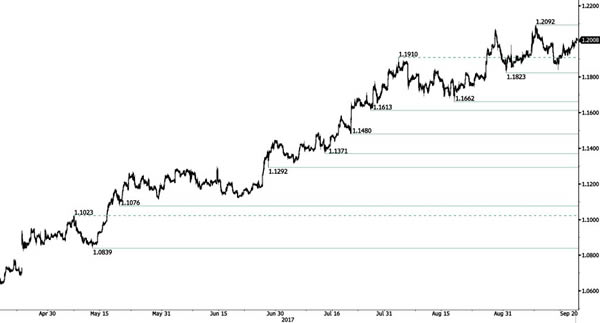
EUR/USD lies in a bullish trend. Hourly resistance can be found at 1.2092 (08/09/2017 high) while hourly support lies at 1.1823 (31/08/2017 low). Stronger support is given at a distance at 1.1662 (17/08/2017 low). Expected to show renewed bullish pressures.
In the longer term, the momentum is now turning largely positive. We favour a continued bullish bias. Key resistance is holding at 1.2252 (25/12/2014 high) while strong support lies at 1.0341 (03/01/2017 low).
Technical Outlook: AUDUSD – Strong Recovery Dents Fibo Barrier At 0.8054 Ahead Of Fed
The Aussie rallies further on Wednesday after Outside Day pattern was formed on Tuesday, signaling reversal. Extended bullish acceleration today broke above pivotal barrier at 0.8032 (daily Tenkan-sen) which repeatedly capped upside attempts and dented next important resistance at 0.8054 (Fibo 61.8% of 0.8124/0.7939 pullback. With daily studies returning to full bullish setup, near-term focus turns higher and close above broken Tenkan-sen is needed for stronger bullish signal, while close above Fibo 61.8% barrier would confirm scenario and re-expose recent peak at 0.8124. Fed's tone however, is expected to have the key influence on pair's near-term action.
Res: 0.8057, 0.8081, 0.8124, 0.8164
Sup: 0.8032, 0.8010, 0.7995, 0.7970
Sterling Boosted By Solid UK Retail Sales Data
Sterling bulls were instilled with fresh inspiration during Wednesday’s trading session, after U.K retail sales smashed market expectations by rising 1.0% in August.
Retail sales remain resilient and have risen for three months in a row despite inflationary pressures, which are likely to fuel speculation of the BoE raising interest rates in November. The growth rate for July was also revised higher by the ONS, from 0.3% to 0.6% which added to the overall positivity of the report. With expectations mounting over the BoE raising rates sooner than expected, Sterling which remains sensitive to monetary policy speculation, is likely to venture higher.
Sterling/Dollar climbed higher following the release, with prices clipping 1.3600. Bulls remain in control above 1.3500 with 1.3700 on the cards, if the current upside momentum holds.
Fed Balance Sheet And Interest Rates In Focus
- Economic projections and Yellen speech eyed for rate hike clues;
- Will balance sheet reduction plans finally impact yields?
- UK retail sales exceed expectations but GBP rally short-lived.
Markets have been relatively steady ahead of the US open on Wednesday, as traders await the latest monetary policy decision from the Federal Reserve.
With the probability of a rate hike today only 1% priced in, according to Fed funds futures, we can be quite confident that there won't be any surprises here from the central bank, with policy makers having previously been very careful to adequately prepare markets for such moves. That said, policy makers have become less hawkish over recent months as inflation has failed to graduate towards target as anticipated, leaving market watchers seeking further clarity on the path that interest rates are now on.
The economic projections that accompany the statement should provide further clarity on this, as will Chair Janet Yellen's views in the press conference shortly after. With there now being an element of doubt around the path of inflation, not to mention Yellen's position once her current term ends early next year, it's possible that the Fed Chair may be very vague on the subject of interest rates beyond the end of the year and instead focus on the job of balance sheet reduction.
The Fed is expected to announce plans to start reducing its $4.5 trillion balance sheet today, having alluded to such an move repeatedly in recent months. As of yet, markets have been relatively unresponsive to such talk which would suggest it won't have much impact following the announcement but there is a chance that either the scale exceeds expectations, triggering a rise in market rates or that traders were just waiting for details before reacting. With information on both this and interest rates expected, I imagine there'll be plenty of movement, regardless.
We'll get existing home sales data prior to the release, which could trigger some movement in the dollar prior to the Fed announcement. The dollar has softened a little in the lead up to the decision which suggests traders are expecting the Fed to err on the dovish side today rather than stubbornly stick to the tightening message. With the dollar having weakened significantly already this year, it is showing signs of bottoming and today could signal whether this is the case or whether further pain lies ahead in the final months.
The pound tested 1.36 against the dollar earlier after retail sales data from the UK in August easily exceeded expectations, triggering a pop higher in sterling. The pair fell slightly short of its previous high though before falling back close to the levels it traded at prior to the release. Perhaps this is a sign that after a very strong rally over the last month, the pair is a little stretched, or maybe the BoE agents report that followed that mentioned future impacts of sterling weakness on consumer goods inflation having peaked, among other things, was perceived as a little dovish.
All On FOMC Meeting
The Fed finally will reduce bonds, the pound to stall, China might deleverage
The big news event on 20 September will be the report of the US Federal Reserve’s Open Market Committee – we believe the central bank will finally announce plans to start selling its massive holding of bonds. This is likely to begin in October. Meanwhile, the Fed is unlikely to move interest rates.
What does this mean for the US dollar? Possibly a shock. Markets are calm – too calm, really, like those western films where the sheriff rides into an empty town. Despite the tensions in North Korea and the Middle East, despite a see-sawing US president, despite implied volatility, willingness to take risks is historically unprecedented, which we know could end in tears. Markets continue to rationalize this, by seeing low inflation, solid growth and gradual central bank normalization. We’re not so sure. A balance-sheet unloading could end the ‘feel good’ environment, sending both bond and stock markets southward.
Markets base scenario is that markets will fade the Fed announcement, instead pricing in gradual tightening and shallow interest rate cycle. This will keep the USD on weak footing. And it will keep rolling the current uptrend of high-beta currencies. However, we suspect markets are underpricing fed risk given the strong labor markets and desire for the fed to reach normal conditions. We have penciled in a near term USD strength. The real x-factor will be the extent of the rally.
As for the pound sterling, we believe it will tread water for a while. Markets are cross-eyed between the Bank of England’s hawkish words and the tumult of Brexit. Prime Minister Theresa May might clarify matters a bit with a speech on Friday (expected £20bn to the EU). Yet Foreign Minister Boris Johnson has signaled that her vision of Brexit will not go unchallenged. So far, the pound’s post-Brexit-election plunge has supported the UK economy, yet headwinds are increasing. A rate hike might be needed, but it is unlikely as domestic outlook is softening and real wages are falling.
And what about China? Growth is back, along with capital inflows and rising forex reserves. So, the People’s Bank of China is likely to let interest drift higher. This would also help contain China’s credit boom, or should we say bubble. Medium term, China’s central bank aims to deleverage. Rumours continue that China will liberalise capital flows – we are not yet convinced this is coming soon.
Wild cards? Catalonia’s independence referendum, China’s 19th national congress and the probability of snap elections in japan. The trigger will be today’s Fed announcement. If the markets shrug it off, they just might keep the good times rolling.
USD/JPY – Yen Steady Ahead Of Federal Reserve, BoJ Rate Statements
USD/JPY has edged lower in the Wednesday session, erasing small gains recorded on Tuesday. Currently, the pair is trading at 111.29, down 0.26%. On the release front, central banks will be in focus, as the Federal Reserve and the Bank of Japan publish rate statements.
There is growing speculation that the Japanese government may call a snap election on Monday, with the vote to be held on October 22. Abe has seen his ratings improve over the North Korean crisis and with a weak opposition, he is gambling that the move will pay big dividends. The Japanese economy has improved in 2017, as stronger global demand has boosted the manufacturing and export sectors. However, the country’s radical stimulus program, known as ‘Abenomics’, has failed to push inflation levels anywhere near the BoJ’s target of just below 2.0%. The Bank of Japan releases a rate statement later on Wednesday, and a hawkish message from the BoJ could send the yen to higher ground.
All eyes will be on the Federal Reserve, as the central bank releases its September rate statement. The FOMC is expected to hold the benchmark rate at 1.25%, so analysts will be looking for details about the the Fed balance sheet and a possible rate hike in December. Earlier in the year, the Fed outlined plans to begin reducing its bloated balance sheet of $4.2 trillion, and the markets are expecting more details, such as a start date for the tapering. The Fed is expected to reduce the balance sheet by not replacing some maturing bonds, starting at $10 billion/month, and gradually moving higher. This move can be viewed as a mini-rate hike, and could provide a boost for the US dollar against major rivals. However, if the Fed does not address its balance sheet, the markets could get nervous and the US dollar could lose ground. As for inflation, persistently low levels remains well below the Fed target of 2% and this has hampered plans for a third rate hike in 2017. Janet Yellen has not discussed a December move, but in recent weeks, some FOMC members have come out against another rate hike before inflation moves higher, even if this means waiting until 2018. If the rate statement addresses the timing of another rate hike, we could see substantial movement from the US dollar.
Forex Technical Analysis: EUR/USD, USD/JPY, GBP/USD
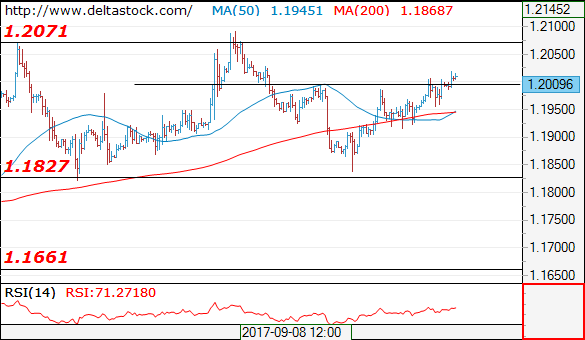
EUR/USD
Current level - 1.2009
The intraday bias is still positive, for a test of 1.2070 resistance area. On the senior frame the outlook is counter-trend, for a break through 1.1915 crucial low, towards 1.1830 support.
| Resistance | Support | ||
| intraday | intraweek | intraday | intraweek |
| 1.2070 | 1.2160 | 1.1915 | 1.1830 |
| 1.2070 | 1.2500 | 1.1830 | 1.1660 |
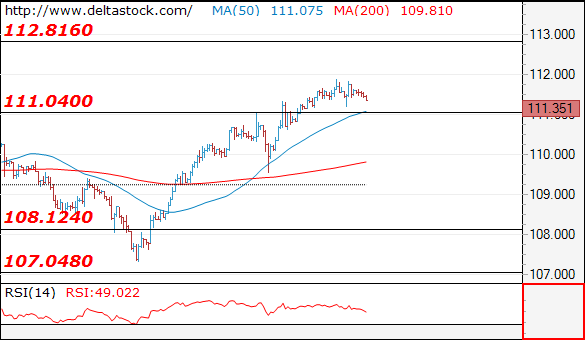
USD/JPY
Current level - 111.35
Current pullback has intraday potential for a short-lived dip to 110.70 before another rise towards 112.80 target mark.
| Resistance | Support | ||
| intraday | intraweek | intraday | intraweek |
| 112.00 | 111.00 | 110.70 | 108.12 |
| 112.80 | 112.80 | 109.15 | 107.30 |
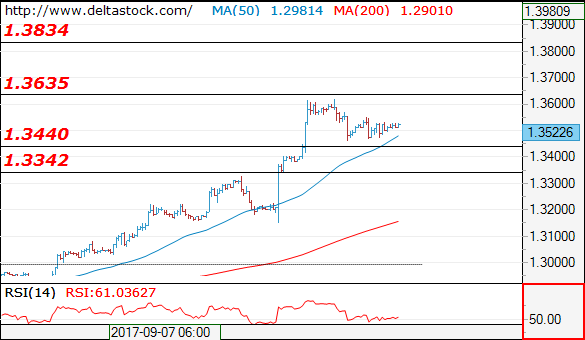
GBP/USD
Current level - 1.3522
The intraday bias is neutral and only a break through 1.3440 will challenge 1.3340 zone. On the senior frames the uptrend is still intact, for a rise towards 1.3830.
| Resistance | Support | ||
| intraday | intraweek | intraday | intraweek |
| 1.3635 | 1.3635 | 1.3440 | 1.3340 |
| 1.3830 | 1.3830 | 1.3340 | 1.3150 |
CAC Subdued, Markets Eye German Election
The CAC index has ticked higher in the Wednesday session. Currently, the index is at 5,244.70, up 0.13% on the day. On the release front, it’s a quiet day, with no eurozone or French indicators on the schedule. On Thursday, ECB President Mario Draghi will deliver remarks at the European Systemic Risk Board conference in Frankfurt.
Emmanuel Macron has enjoyed somewhat of a honeymoon period in his new job as president of the republic, but it’s crunch time for Macron and his government. Macron ran an election campaign which promised to overhaul the economy, and the government plans to take a big first step later this week, with a labor reform that will make it easier for employers to hire and dismiss workers. The labor reform comes into effect on September 22, but France’s largest unions have pledged to fight the move tooth-and-nail. A mass demonstration brought more than 200,000 to the streets, and another demonstration is scheduled for September 23. The government has promised further reforms to the country’s generous benefits system, specifically unemployment benefits and pensions. In the past, mass strikes and demonstrations by unions have managed to stave off major reforms. However, the government appears determined to move full speed ahead, and the markets will be watching closely to see who prevails in this round, the unions or the government.
Germany, the juggernaut of the eurozone, is holding a national election on Sunday, and Chancellor Angela Merkel is seeking a fourth term from an electorate of some 60 million voters. Merkel has seen some erosion in her popularity ratings, but is holding a comfortable lead over the opposition and is favored to win the election. Merkel is essentially the de facto leader of the European Union, so the extent of her success in the election could have a strong impact on European stock markets. Merkel’s center-right CDU party will likely have to enter into a coalition with another party, and historically this process can be quite lengthy. The current junior coalition party is the center-left Social Democratic Party (SDU), but the pro-business Free Democratic Party (FDU) also remains in the running. The FDU has insisted on the finance portfolio in any coalition agreement, and wants Germany to stop funding struggling EU members, such as Greece. The party has also taken a hard line on immigration, a hot election topic which could boost its performance in the election.
DAX Edges Higher As All Eyes On Fed Rate Statement
The DAX index has posted small gains in the Wednesday session. Currently, the DAX is trading at 12,581.50, up 0.18% on the day. On the release front, there are no major eurozone indicators on the schedule. German PPI remained unchanged at 0.2%, edging above the forecast of 0.1%. In the US, the Federal Reserve winds up its policy meeting and will release a rate statement. On Thursday, ECB President Mario Draghi will deliver remarks at the European Systemic Risk Board conference in Frankfurt.
The eurozone is enjoying solid growth, with much of the credit going to Germany, the largest and strongest economy in the bloc. The German economy continues to perform well, with low unemployment, strong consumer demand, and a robust export sector. Institutional investors and analysts like what they see, as German ZEW Economic Sentiment Sentiment rebounded in September and climbed to 17.3 points, following a disappointing reading in August of 10.0 points. The ZEW report was very positive, noting that German growth in the second quarter remained strong, and both the public and private sectors were marked by increased investment. The report added that the stronger euro had not had a negative impact on the German economy, and the upcoming German election had not caused any uncertainty in the markets.
Germany is holding a federal election on Sunday, and Chancellor Angela Merkel holds a comfortable lead over the opposition. Merkel has seen some erosion in her popularity ratings, but is still widely favored to win a fourth term as president. Merkel is essentially the de facto leader of the European Union, so her success in the election could have a strong impact on the movement of the euro. Merkel’s center-right CDU party will likely have to enter into a coalition with another party, and historically this process can be quite lengthy. The current junior coalition party is the center-left Social Democratic Party (SDU), but the pro-business Free Democratic Party (FDU) also remains in the running. The FDU has insisted on the finance portfolio in any coalition agreement, and wants Germany to stop funding struggling EU members, such as Greece. The party has also taken a hard line on immigration, a hot election topic which could boost its performance in the election.