Sample Category Title
Pound Touches 1.36 as British Retail Sales Sparkles
The British pound has posted slight gains in the Wednesday session. Currently, GBP/USD is trading at 1.3529, up 0.16% on the day. On the release front, British Retail Sales was unexpectedly strong, gaining 1.0%. This easily beat the forecast of 0.2%. The US also releases Existing Home Sales, which is expected to improve to 5.46 million. On Thursday, the US will release unemployment claims and the Philly Fed Manufacturing Index.
British Retail Sales sparked in August with a gain of 1.0%, its strongest reading since April. This easily beat the forecast of 0.2%, and pushed sterling to 1.3607 before it dipped lower. On Monday, GBP/USD climbed to 1.3618, its highest level since the Brexit vote in June 2016. Despite a lack of wage growth, British consumers kept their pocket books open in August. The sharp reading will increase pressure on the Bank of England to raise interest rates, which hasn't happened in a decade.
BoE Mark Carney has often warned about the toll that Brexit will take on the British economy, and he repeated these concerns in a speech at the International Monetary Fund in Washington in Monday. Carney said that Britain's loss of its trade relationship with the European Union would push inflation higher and slow growth, and labeled Brexit as "an example of de-globalisation, not globalisation." Pro-Brexit supporters have been unhappy with Carney's stance on Brexit, arguing that high inflation is a result of the BoE's stimulus program and ultra- low interest rate policy, rather than Brexit. Carney also hinted at a rate hike, saying that monetary policy "would have to move". The pound jumped 3.0% last week, after the minutes of the BoE's policy meeting strongly hinted at a rate hike before the end of the year. Will the BoE raise rates at the November policy meeting?
All eyes are on the Federal Reserve, as the central bank releases its September rate statement. The FOMC is expected to hold the benchmark rate at 1.25%, so analysts will be looking for details about the the Fed balance sheet and a possible rate hike in December. Earlier in the year, the Fed outlined plans to begin reducing its bloated balance sheet of $4.2 trillion, and the markets are expecting more details, such as a start date for the tapering. The Fed is expected to reduce the balance sheet by not replacing some maturing bonds, starting at $10 billion/month, and gradually moving higher. This move can be viewed as a mini-rate hike, and could provide a boost for the US dollar against major rivals. However, if the Fed does not address its balance sheet, the markets could get nervous and the US dollar could lose ground. As for inflation, persistently low levels remains well below the Fed target of 2% and this has hampered plans for a third rate hike in 2017. Janet Yellen has not discussed a December move, but in recent weeks, some FOMC members have come out against another rate hike before inflation moves higher, even if this means waiting until 2018. If the rate statement addresses the timing of another rate hike, we could see substantial movement from the US dollar.
USDJPY Drifts Lower ahead of Fed Meeting
The USDJPY pair is starting to correct lower as the U.S dollar index weakens, with price-action drifting towards the 111.20 region, ahead of today's U.S Federal Reserve interest rate decision and monetary policy statement.
In early Wednesday trading, the USDJPY was again rejected from the pairs monthly pivot point, at 111.65, creating a bearish lower daily time-frame price candle, and encouraging intraday selling as the pairs medium-term bearish bias remains intact.
Today's Federal Reserve interest rate decision and monetary policy statement is likely to generate tremendous volatility in the USDJPY pair.
A hawkish monetary policy statement, with the FED tapering stimulus and announcing an upcoming rate hike, should be U.S dollar supportive. Anything less, may disappoint investors and spark another round of selling in the U.S dollar index.
Key intraday technical support below the 111.13 level is located at 110.68 and 110.10. Below the 110.10 level, further support is seen at 109.79 and 109.40.
To the upside, key technical resistance above the 111.65 level is seen at 112.19, 112.86 and 113.57.
GBPUSD Hits 1.3607 after UK Retail Sales
The British pound spiked to 1.3607 against the U.S dollar following much better than expected monthly and annual UK retail sales figures, further increasing the chances of the BOE hiking rates in October.
Price-action has however pulled back dramatically from 1.3600 level after the sharp uptick on the news, with the pair retracing down to 1.3517, finding support from the pairs key 50-hour moving average.
The GBPUSD pair is currently trading back below the weekly pivot point, found at 1.3553, and has also created a bearish double-top pattern formation on the price-charts.
Key technical support below the 1.3500 level is found at 1.3463, 1.3420, with further support below the 1.3400 level coming from the pairs 100-week moving average, at 1.3380, and 61.8 Fibonacci retracement level, at 1.3340.
Once above the 1.3553 level, intraday GBPUSD resistance is found at 1.3573, 1.3607 and 1.3618. A break above the current yearly high should provoke buying interest towards the 1.3650, 1.3680 and 1.3710 technical levels.
Daily Technical Analysis: USD/CAD Leaned Inverted Head And Shoulders For Bullish Continuation
Despite the excellent data for CAD currency, the USD economy also showed good numbers on Friday. While unemployment is still at 4.7% and wages are going up, we might assume that the economy is very strong and that may lead to another rate hike. I personally believe the US Fed will continue to gradually raise rates in the US leading to gradual USD strength in the medium term.
Technically the USD/CAD is showing bullish SHS pattern (inverted head and shoulders) and is supported at 1.3230. 4h close or strong 1h momentum above 1.3270 could spike the pair up to 1.3312 (ATR target) and 1.3330 (H5), USD/CAD bullish outlook is also supported by bullish divergence, so we could see buying into dips towards 1.3312-30 targets
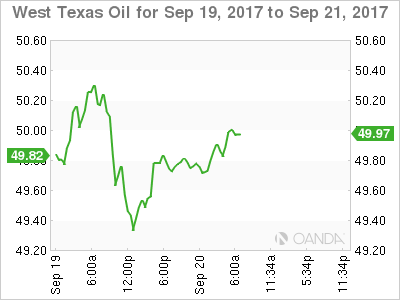
Technical Outlook: WTI Oil Establishes Above $50, Boosted By Signals Of Possible Output Cut Extension By OPEC
WTI oil price stands firm on Thursday and establishes above $50.00 handle, following several unsuccessful attempts above the mark in past four days. Oil price was boosted by comments from Iraq's oil minister who said OPEC and oil producers outside the cartel are considering extension or even stronger oil supply cut . In addition, mush lower than expected build of crude inventories, showed by API report on Tuesday (build of 1.44 million barrels last week vs forecasted build of 6.18 million barrels) added to support to oil prices. Weekly crude inventories report from EIA is in focus today, with forecasted build of 3.49 million barrels vs 5.88 million barrels build last week, could further boost oil price if today's release undershoots forecast. Today's fresh bullish acceleration probes above recent highs at $50.41/48 and hits the highest levels since end of May. Bulls may extend above round-figure barrier at $51.98 on stronger acceleration higher and turn focus towards 25 May peak at $51.98. Repeated daily close above $50 today will be additional bullish signal. Initial support lies at $50, followed by broken 200SMA at $49.56, which should ideally contain corrective dips.
Res: 50.83, 51.00, 51.55, 51.74
Sup: 50.00, 49.56, 49.25, 49.00
Market Update – European Session: Strong UK Retail Sales Adds To Bets Of A UK Rate Rise
Notes/Observations
UK Retail sales beats estimates, Sterling spikes as Gilts fall on increased rate hike bets
Over 200 killed by Mexico Earthquake
Markets trade in narrow range ahead of FOMC rate decision
Overnight
Asia:
Japan trade surplus ahead of consensus, US exports grew at fastest pace in 33 months
RBNZ announced new regulations in order to ensure that a bank can continue to operate in a situation where a key service provider fails
RBA's Ellis noted that Global wage growth and inflation may take awhile to pick up; Household debt an exacerbating factor is shock occurred
Europe:
UK August Retail sales shows strong growth handily beating expectations, back month revisions were also higher; Cable spikes while Gilts plunge
BoE Agents Summary notes impact of Sterling drop on goods inflation may have peaked
UK PM May reportedly intends to offer a €20B Brexit payment to fill post Brexit EU budget hole
UK Foreign Sec Johnson reigns back threat to resign if PM May goes against his Brexit demands
ThyssenKrupp signs MOU with Tata Steel on JV
Americas:
President Trump vowed to destroy North Korea if forced to defend itself or its allies in remarks made at the UN
(US) Sen Corker (R-TN): Republicans have reached a tentative agreement on tax reform and budget
(MX) 7.4 magnitude earthquake reported in southern Mexico, including reported shaking in Mexico City, at least 248 killed
Energy:
API date showed build in Crude inventories while Gasoline and Distillate showed drawdowns
Economic data
(UK) AUG RETAIL SALES (EX AUTO/FUEL) M/M: 1.0% V 0.1%E; Y/Y: 2.8% V 1.4%E
Retail Sales (includes Auto/fuel) M/M: 1.0% v 0.2%e; Y/Y: 2.4% v 1.1%e
(DE) Germany Aug PPI M/M: 0.2%e v 0.1%e; Y/Y: 2.6% v 2.5%e
Fixed Income Issuance:
(DK) Denmark sells total DKK2.77B in 2020 and 2027 Bonds
SPEAKERS/FIXED INCOME/FX/COMMODITIES/ERRATUM
Equities
Indices [Stoxx600 flat at 382.3, FTSE -0.1% at 7270, DAX +0.1% at 12573, CAC-40 +0.1% at 5243, IBEX-35 -0.5% at 10327, FTSE MIB -0.1% at 22408, SMI +0.2% at 9110, S&P 500 Futures flat]
Market Focal Points/Key Themes: European Indices trade mixed in a quiet session ahead of todays FOMC rate decision. The FTSE reversed earlier slight gains on the back of a strong Retail Sales report in the UK, with strength in Sterling impacting the index. Retailer Inditex reported results slightly below expectations, impacting the shares while Kingfisher outperforms as results came in ahead of views, elsewhere Diageo trades lower following their trading update. Thyssenkrupp shares trade higher as an MOU is signed regarding a JV with Tata Steel, whilst Uniper and EON trade higher on reports Fortum nearing a bid for EON's stake in Uniper. Looking ahead to the US morning, General Mills is the one notable earner.
Equities
Consumer discretionary [ Inditex [ITX.ES] -1.7% (Earnings), Kingfisher [KGF.UK] +6% (Earnings), Diageo [DGE.UK] -2.2% (Trading update)]
Materials: [Babcock [BAB.UK] +4.2% (Earnings)]
Industrials: [Thyssenkrupp [TKA.DE] +3.2% (Signs MOU for JV with Tata Steel)]
Healthcare:[Kiadis Pharma [KDS.NL] +7.8% (Receives FDA Regenerative Medicine Advanced Therapy (RMAT) Designation for ATIR101), Bone Therapeutics [BOTHE.FR] +4.0% (All patients meet primary endpoint in ALLOB® Phase I/IIA delayed-union study interim analysis)] Energy [Uniper [UN01.DE] +3.4% (EOAN.DE] +1.8% (Fortum reportedly nearing a bid for EON's stake valued at $9B - press)]
Speakers
Sweden Fin Min Andersson: risks to domestic economy include developments in China, Brexit and political uncertainty in the US
Currencies
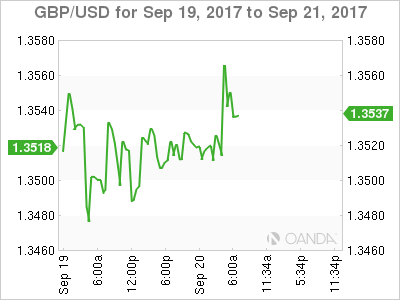
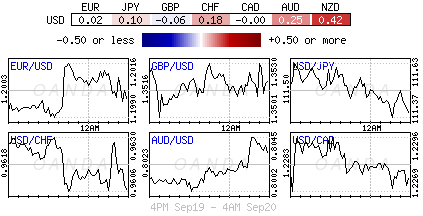
GBP/USD surges on strong retail sales beat, tentatively testing the 1.36 level, the move however may have been exacerbated as dealers noted orderbooks were thin ahead of the Fed meeting
Major currency pairs trade in tight ranges as markets await how the Fed will provide details about trimming its balance sheet. Euro hovers around 1.20 and dollar yen above the 111 level.
USD/ZAR (rand) maintains slight gain following cooler inflation data. Expectations are for SARB to cut rates by 25bps at tomorrow's rate decision
Fixed Income
Bund futures trade at 161.24 up 18 ticks as markets await the Fed Meeting and ECB speakers. Continued downside targets 161.03 while upside resistance stands initially at 162.07, followed by 163.27.
Gilt futures trade little changed at 125.03 giving up its earlier gains after retail sales for August top expectations. Continued downside eyeing 124.91. Upside targets 127.90 then 128.24.
Wednesday's liquidity report showed Tuesday's excess liquidity fell to €1.747T from €1.752T and use of the marginal lending facility fell to €86M from €102M.
Corporate issuance saw $6.9B come to market via 7 issuers headlined by Sunoco Logistics $2.25B 2-part senior unsecured note offering and AEP Texas Inc $0.7B 2-part senior unsecured note offering
Looking Ahead
07:00 (US) MBA Mortgage Applications w/e Sept 15th: No est v 9.9% prior
08:05 (UK) Baltic Dry Bulk Index
10:00 (US) Aug Existing Home Sales: 5.46Me v 5.44M prior
10:30 (US) Weekly DOE Crude Oil Inventories
14:00 (US) FOMC Interest Rate Decision: Expected to hold Target Rate Range at 1.00-1.25% - 15:00
(MX) Mexico Citibanamex Survey of Economists
Jump In UK Retail Sales Adds To Rate Hike Expectations, Pound Tests $1.36 Again
After a notable slowdown at the end of 2016 and start of 2017, British retail sales are showing some signs of recovery, even as consumers continue to feel the pinch from falling real incomes. The volume of retail sales jumped by 1% month-on-month in August, the most in four months and surpassing expectations of 0.2%. On a 12-month basis, retail sales rose by 2.4%, beating expectations of 1.1%.
Adding to the upbeat data were an upward revision to the prior month’s numbers. July’s month-on-month figure of 0.3% was doubled to 0.6% and the annual rate was revised up from 1.3% to 1.4%. Excluding fuel, retail sales were up by a similar 1% m/m.
The growth was driven by sales from non-food stores and online retailers. Food sales were flat year-on-year in August even though the value spent rose by 2.6%, underlining the increase in prices generated by sterling’s depreciation. The biggest price gains were recorded by clothing and fuel stores. Clothing stores enjoyed increased sales of 3.4% despite the higher prices but fuel sales declined by 1.1% over the year.
The data will likely allay fears for Bank of England policymakers that consumer spending is heading for a sharp slowdown and may even be rebounding following three straight months of gains. Until recently, investors were not convinced by the Bank of England’s more hawkish tone since June due to declining consumer and business confidence. With the Brexit negotiations not getting off to a strong start and lingering uncertainty about Theresa May’s premiership, many analysts had expected the Bank to hold off from raising rates until more clarity emerged on Britain’s post-Brexit relationship with the European Union.
However, following the BoE’s September policy meeting last week, odds of a quarter-point rate hike by as early as the November meeting have surged. The Bank signalled that a majority of MPC members would be in favour of raising rates “over the coming months” if the economy and price pressures continue to grow. The pound subsequently rallied to a 15-month high of 1.3618 against the dollar and a two-month high of 0.8772 to the euro.
Sterling attempted to climb back towards those highs after today’s data, hitting session tops of $1.3607 and 0.8824 pounds per euro. Political uncertainty ahead of Friday’s big speech on Brexit by Prime Minister May in Florence, Italy, will likely prevent fresh highs for sterling, while Governor Mark Carney’s remarks on Monday that any tightening in policy would “gradual” and “limited” has also been weighing on the British currency.
Sterling And Kiwi Dollar Forge Ahead Of Dot Plot Release
Global equities remain unsettled, sovereign bonds trade mixed and G10 (ex-sterling) currencies are mostly drifting ahead of today's Federal Reserve's rate decision and press conference.
Along with the market strongly anticipating that the Fed will get more specific about balance sheet unwinding, U.S policy makers will be releasing their so-called dot plot.
The infamous dots, which forecast medium-term rates stateside, will have the most influence on the dollar rather than what the Fed may be signaling for the remainder of this year – market expectations of another hike in 2017 are at about +50%.
The key risk to the dollar is a large enough shift in the distribution of dots translating into a downgrade of median interest rate projections.
1. Stocks mixed results
In Japan, stocks traded mainly flat overnight, a day after scaling new highs in two-years, as investors stayed cautious before today's Fed announcement. The Nikkei edged up +0.1%, while the broader Topix traded flat. On Tuesday, the index soared +2.0% supported by a weaker yen (¥111.40) and hopes for a snap election.
Down-under, Australia's S&P/ASX 200 and the S. Korea's Kospi index closed slightly lower.
In Hong Kong, equities traded up, with the benchmark index hovering around 28-month highs, as shares of Chinese metal producers continued to rally. The Hang Seng index rose +0.3%, while the China Enterprises Index gained +0.4%.
In China, stocks edged higher, supported by strong gains in consumer stocks and car manufacturers. The blue-chip CSI300 index rose +0.3%, while the Shanghai Composite Index gained +0.2%.
In Europe, regional indices trade mixed in a quiet session ahead of the Fed announcement. The FTSE 100 has reversed its early losses on the back of a strong U.K retail sales report (see below).
U.S stocks are set to open little changed.
Indices: Stoxx600 flat at 382.3, FTSE -0.1% at 7270, DAX +0.1% at 12573, CAC-40 +0.1% at 5243, IBEX-35 -0.5% at 10327, FTSE MIB -0.1% at 22408, SMI +0.2% at 9110, S&P 500 Futures flat.
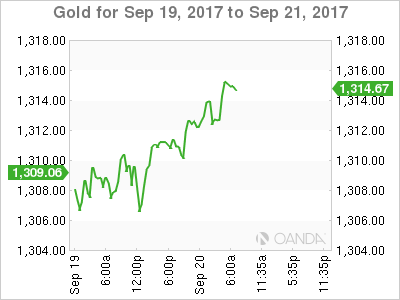
2. Oil higher on hints of OPEC extension, gold shines
Oil has rallied overnight and is set for its largest Q3 gain in a 'bakers dozen' years after the Iraqi oil minister said OPEC and its partners were considering extending or deepening supply cuts to erode an existing global surplus.
Note: OPEC's technical committee meets in Vienna today.
Brent crude futures rose +29c to +$55.43 a barrel, while U.S West Texas Intermediate (WTI) crude futures were up +42c at +$49.90 a barrel.
Note: Oil prices are on course for a rise of +15.5% this quarter, which would make this year's performance the strongest for Q3 since 2004.
OPEC and other producers are supposedly considering a range of options, including an extension of cuts, beyond next March's deadline.
API data yesterday stateside showed crude stocks rose last week while gasoline and distillate stocks decreased – crude inventories increased by +1.4m barrels in the week to Sept. 15 to +470.3m.
Note: The U.S Department of Energy will release official data on inventories and refinery activity later this morning (10:30 am EDT).
Ahead of the U.S open, gold has inched higher in range-bound trading as the 'mighty' dollar wavers ahead of today's Fed rate announcement. Spot gold is up +0.2% to +$1,313.50 an ounce.
3. U.S Treasuries bracing for disappointment
Fixed income traders have been bracing themselves for today's Fed statement and updated economic projections, with the 10-year Treasury yield backing up for seven consecutive sessions.
Higher U.S yields are not necessarily suggesting a rate hike today, but it is providing insurance for the expected rollout of details on balance-sheet shrinkage.
Note: The yield gain for 10-year product has not been huge at +18 bps – the move has basically unwound the Treasury rally which pushed the 10-year debt to fresh 2017 low of +2.06% earlier this month.
For investors, the most important thing today is whether the Fed will signal another rate hike this year and three more in 2018.
The yield on 10-year Treasuries fell less than -1 bps to +2.24%. In Germany, 10-year Bund yields fell less than -1 bps to +0.45%, while U.K 10-year Gilt yield were unchanged at +1.329%, the highest in more than seven months.
4. Sterling and Kiwi dollar forge ahead
Major currency pairs, ex-sterling and Kiwi dollar, are trading in a relatively tight range as investors wait for the Fed to provide details about trimming its balance sheet. The EUR (€1.2002) hovers atop of the psychological €1.20 threshold, and yen (¥111.33) trades within sight of this week's lows.
Ahead of the open, sterling trades stronger after U.K retail sales (see below) came in much better than expected. GBP/USD trades up +0.7% at £1.3593 after the data, up from £1.3516 before the announcement. EUR/GBP is down -0.5% at €0.8843.
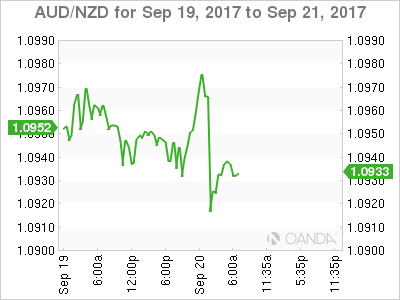
Elsewhere, the New Zealand dollar (NZ$0.7364) has surged after a poll put the ruling National Party back in the lead ahead of the main opposition Labour Party ahead of this weekend's election (Sept. 23).
5. U.K. retail sales post strong August
Data this morning showed that U.K. retail sales rose by more than expected in August as consumers splashed out in department stores and on home improvements, but sales look set to be weaker in Q3 than they were earlier in the year.
Retail sales rose +1.0% on the month in August, a faster rate of growth than the +0.6% recorded the previous month, and much faster than the +0.3% that was forecasted.
Spending in pharmacies and jewellers, and on floor coverings and gasoline, the ONS said, buoyed sales. Sales overall were +2.4% higher year on year.
Note: August's figures follow two consecutive months of weak sales as households cut back in response to rising prices. Annual inflation hit +2.9% last month, well above the BoE's target of + 2% target.
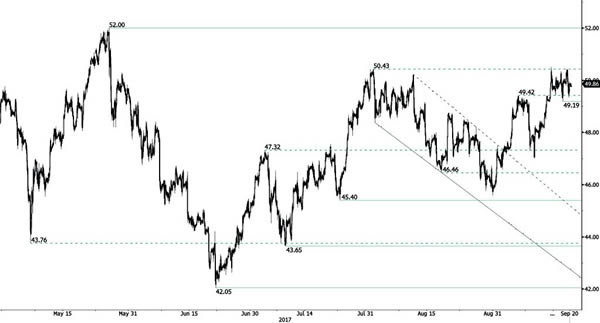
CRUDE OIL Continued Consolidation
Crude oil is pausing around the $50 level. Key support is given at 45.40 (17/08/2017 high). Strong resistance found at 50.43 (31/07/2017) has been broken. Expected to show another leg higher.
In the long-term, crude oil has recovered after its sharp decline last year. However, we consider that further weakness are very likely. Strong support lies at 35.24 (05/04/2016) while resistance can now be found at 55.24 (03/01/2017 high).
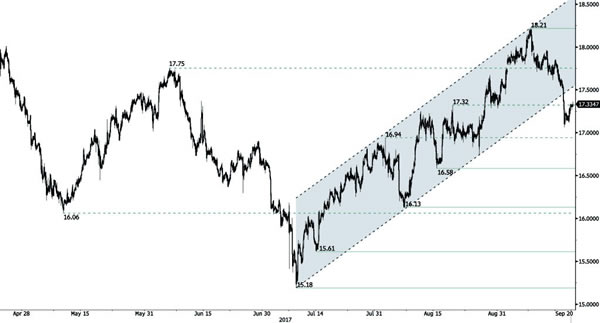
SILVER Breaking Uptrend Channel
Silver has reversed and has broken uptrend channel by breaking support implied by its lower bound. Strong resistance is given at 18.65 (17/04/2017 high) while support can be found at 16.58 (15/08/2017 high). Expected to show further bearish move.
In the long-term, the trend is rater negative. Further downsides are very likely. Resistance is located at 25.11 (28/08/2013 high). Strong support can be found at 11.75 (20/04/2009).