
Sample Category Title
USD/JPY Bloodless
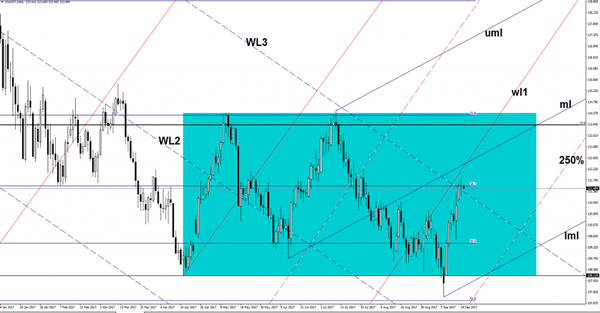
USD/JPY decreased a little in the Asian session after another failure to close above the 38.2% retracement level. It could come down to retest the WL3 before will climb much higher. Technically, it is expected to approach and reach the median line (ml) of the minor blue ascending pitchfork. However, a failure to reach the mentioned dynamic resistance will send the rate down very fast. Is trading near the 111.50 level, we have a major upside target somewhere at 114.28 level, will reach it only if the USDX will start an impressive rally.
NZD/USD Bounce Or Break?
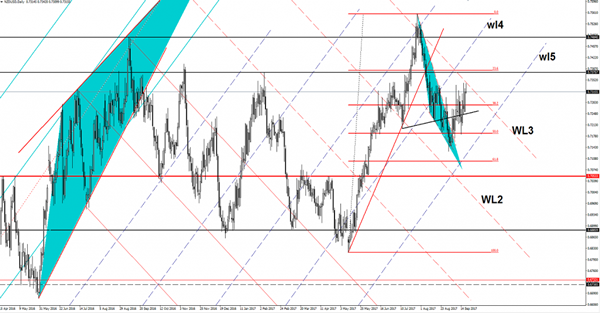
The currency pair has increased in the morning, but failed to reach the 0.7343 previous high and an important dynamic resistance. The sellers have stepped in again and have forced the rate to erase the morning gains.
NZD/USD dropped even if the USDX slides further, the index slipped below the 91.92 static support and below a dynamic support, so it could hit new lows. You should be careful today because the FOMC will shake the markets, a dovish speech will punish the USD again.
There are some rumors that said that the FED will still hike the rate in December despite the poor US data, we could have a neutral speech which could help the dollar.
The Kiwi rallied in the morning as the New Zealand Current Account has come in better than expected, was reported at -0.62B, higher versus the -0.82B estimate. The US Existing Home Sales will come out in the afternoon and are expected to increase from 5.44M to 5.46M.
Price increased and resumed the yesterday’s bullish momentum, but failed to reach and retest the third warning line (WL3) of the former descending pitchfork. A failure to reach it will signal a minor decrease, but will be better to stay away from trading today because anything could happen. The FOMC Press Conference should bring a high volatility, while the direction is uncertain. Technically, a valid breakout above the WL3 will confirm a further increase in the upcoming weeks.
Market Update – Asian Session: Markets Remain Quiet Ahead Of Fed
Asia Summary
Asian equity markets opened moderately weaker, as markets and currencies shore up ahead of Fed meeting. Internationally US President Trump’s comments to UN vowing to destroy North Korea if necessary; large earthquake in Mexico and hurricane Maria made landfall in Puerto Rico (Jose decelerates to a tropical storm) dominated the headlines. Currencies overall were muted with the USD weaker. Markets strongly anticipate that the Fed will get more specific about balance sheet unwinding. PBOC OMO had a significantly smaller injection after two consecutive large injections. The onshore yuan climbed the most in nearly two weeks as the USD gave up an early advance and the euro extended a rally to the fifth day in a row. Onshore yuan rose 0.25%, the most since Sept. 7th , halting a 2- day decline.
Japan August trade balance had some notable components; exports to the US +21.8% y/y was the fastest rate since Dec 2014. Headline exports had their fastest rise since Nov 2013 and the 9th consecutive rise. Japan MoF said exports were supported by semiconductors and autos. Australia and New Zealand banks were under pressure after RBNZ announced new regulations in order to ensure that a bank can continue to operate in a situation where a key service provider fails.
Key economic data
(NZ) NEW ZEALAND Q2 CURRENT ACCOUNT BALANCE (NZ$): -0.62B V -0.9BE
(JP) JAPAN AUG TRADE BALANCE: ¥113.6B V ¥108.7BE; ADJ ¥367.3B V ¥404.5BE
(AU) AUSTRALIA AUG SKILLED VACANCIES M/M: 0.3% V 0.7% PRIOR
Speakers and Press
China/Hong Kong
USD/CNY (CN) China Securities Journal: Yuan's one way depreciation trend has ended
(CN) PBoC supports a move by some banks to increase lending rates on mortgage loans in the Beijing market – CCTV
(CN) China corn farmers expected to hoard their crops, waiting for prices to rise - Chinese press
(CN) China considering a plan to allow foreign electric-car business in free-trade zones – press
(CN) According to John McAfee: China has banned bitcoin exchange heads from travelling overseas - speaking in HK
Korea
(KR) US President Trump: If US is forced to defend itself or its allies, we will have no choice but to totally destroy North Korea – UN speech
(KR) South Korea President Moon: Trump's comments to "totally destroy North Korea" were in line with previous remarks for pressure and sanctions
Japan
(JP) Japan PM Abe said to delay FY20 primary balance target – Nikkei
(JP) Japan Chief Cabinet Sec Suga: Trump speech was important due to its mention of abduction; nothing decided on primary balance surplus target year
Australia
(AU) RBA Assistant Gov Ellis: Household debt an exacerbating factor is shock occurred
Asian Equity Indices/Futures (00:00ET)
Nikkei +0.0%, Hang Seng +0.2%; Shanghai Composite +0.2%, ASX200 -0.1%, Kospi -0.0%
Equity Futures: S&P500 -0.0%; Nasdaq100 -0.0%, Dax +0.0%, FTSE100 +0.0%
FX ranges/Commodities/Fixed Income (00:00ET)
EUR 1.2019-1.1987; JPY 111.65-111.45; AUD 0.8022-0.7999;NZD 0.7342-0.7311
Dec Gold +0.4% at $1,315/oz; Nov Crude Oil +0.7% at $50.25/brl; Dec Copper +0.1% at $2.98/lb
GLD SPDR Gold Trust ETF daily holdings +2.07 tonnes at 846.0 metric tonnes
(AU) Australia sells A$600M in 2% 2021 bonds; avg yield 2.3225%; bid-to-cover 7.48x (went to 1 bidder)
(CN) PBoC OMO: injects CNY30B in 7 and 28-day reverse repos v injected combined CNY150B in 7 and 28 day reverse repos prior
USD/CNY (CN) China PBOC sets yuan reference rate at 6.5670 v 6.5530 prior (weakest setting since Sept 12th)
(KR) Bank of Korea (BOK) Sells KRW2.1T v KRW2.1T indicated in 2-yr bonds; avg yield 1.73% v 1.69% prior
Equities notable movers
Australia/New Zealand
SVW.AU Acquires remaining 53.3% stake in Cotes Hire for A$517M; +7.5%
WLD.AU Reports 1st shipment of beef cattle to China; +10.3% (reported yesterday)
STO.AU Australia ACCC: moves to boost local gas supply not enough to help market; -1%
Japan
6502.JP Said to have chosen to sell chip unit to Innovation INCJ group (Japan/South Korea alliance); +2%
Korea
023530.KR , Lotte Shopping, (KR) South Korea govt considering law that would raise required closed days of hypermarkets to four per month from two; -3%
Hong Kong/China
175.HK Expects to reach sales target of 2.0M units by 2019 - HK press; +3.5%
1211.HK BYD, China considering a plan to allow foreign electric-car business in free-trade zones – press; +10%
AUD/JPY Candlesticks and Ichimoku Analysis
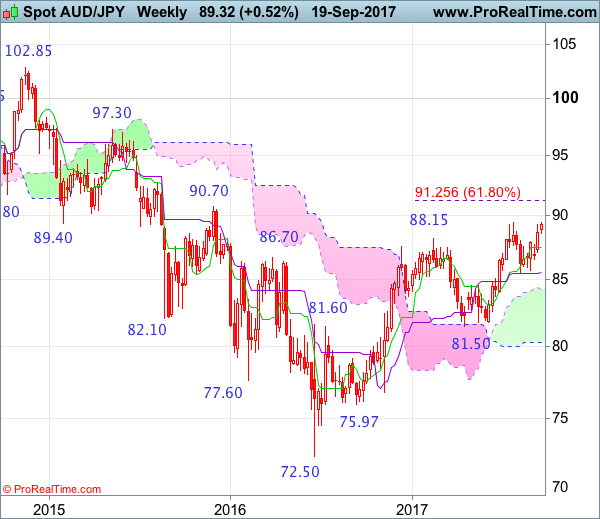
Weekly
• Last Candlesticks pattern: Shooting star
• Time of formation: 13 Mar 2017
• Trend bias: Down
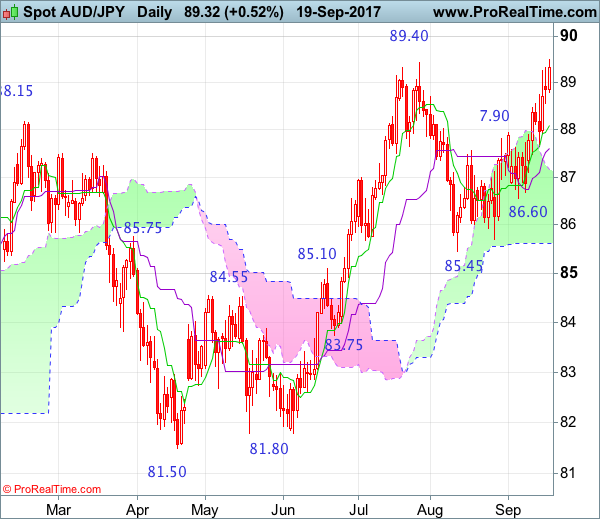
Daily
• Last Candlesticks pattern: Bearish engulfing pattern
• Time of formation: 16 Feb 2017
• Trend bias: Near term down
AUD/JPY - 89.05
As aussie has maintained a firm undertone after recent rally, suggesting a test of this year’s high at 89.40 would be seen, however, break there is needed to confirm medium term erratic upmove from 72.50 low (formed back in 2016) has resumed and extend gain to psychological resistance at 90.00, then test of previous resistance at 90.70 but near term overbought condition should limit upside to 91.00 and reckon 91.50-60 would hold, price should falter below 92.00, bring correction later.
On the downside, whilst pullback to 88.50-55 cannot be ruled out, reckon the Tenkan-Sen (now at 88.00) would limit downside and bring another rise later. A drop below the Kijun-Sen (now at 87.52) would defer and suggest a temporary top is possibly formed, bring weakness to 87.00 and possibly test of previous support at 86.60, however, a daily close below latter level is needed to add credence to this view, bring retracement of recent rise to 86.30-35 and possibly towards 86.00, having said that, support at 85.70 should remain intact, bring rebound later.
Recommendation: Buy again at 88.10 for 90.10 with stop below 87.10
On the weekly chart, aussie has staged a strong rebound after holding above support at 85.45, suggesting the erratic rise from 72.50 has possibly resumed and retest of 89.40 (this year’s high) would be seen, however, break there is needed to add credence to this view and extend gain to psychological resistance at 90.00, then test of previous resistance at 90.70 but overbought condition should limit upside to 91.50-60 and price should falter below another previous chart resistance at 92.70, bring correction later.
On the downside, expect pullback to be limited to 88.00-10 and bring further rise to aforesaid upside targets. A drop below the Tenkan-Sen (now at 87.44) would defer and risk weakness to 87.00, then towards 86.60 support, however, downside should be limited to 86.00 and said support at 85.45 should remain intact, bring another rise later. Only a drop below 85.45 support (this would also penetrate the Kijun-Sen) would signal upmove is not ready to resume yet and risk correction o recenter rise to 84.95-00, then test of the upper Kumo (now at 84.23) but reckon previous support at 83.75 would limit downside and price should stay above support at 82.55-60, bring rebound later.
The Bank Of Japan Starts Its Two-Day Monetary Policy Meeting
Market movers today
The key event today will be the FOMC meeting, with the announcement at 20:00 CET, and Janet Yellen's press conference at 20:30 CET. We expect no change to the fed funds target range, but instead expect the Fed to announce it will begin reducing its balance sheet (‘quantitative tightening') in October. We have got most details about how the Fed wants to do this and hence we do not expect the announcement itself to have a major impact on markets, although we are still missing details about what level of the balance sheet the Fed targets in the long term. With respect to the ‘dots', we expect the signal to remain unchanged at one more hike this year and three next year. We do not expect any major changes to the statement despite low inflation, as the statement already says the Fed is monitoring inflation ‘closely'. For more information, see FOMC preview: Fed to announce QT and still signal one more hike this year, 15 September 2017.
In the UK, retail sales for August are due out. Retail sales are very volatile on a monthly basis, but we will look for signs of whether private consumption growth remains weak due to the negative real wage growth and lower consumer confidence.
The Bank of Japan (BOJ) starts its two-day monetary policy meeting and is expected to announce its decision tomorrow around 05:00 CET. We expect it to keep its ‘QQE with yield curve control' policy unchanged. It is widely expected that the BoJ stands pat this time and the announcement should not have any significant impact on price action.
Selected market news
Although US President Donald Trump's speech to the United Nations General Assembly yesterday was hard on the rhetoric – in particular against North Korea – financial markets remained relatively calm. US equities ended the day slightly higher and in Asia this morning, Chinese and Japanese equity indices are also trading higher while most other regional indices trade lower. With little in the data calendar today, we are probably in for another quiet session as investors await the FOMC meeting and Janet Yellen's speech tonight.
In an interview with the Guardian, UK Foreign Secretary, Boris Johnson, last night rejected yesterday's reports saying that he could resign from the cabinet if in her speech in Florence on Friday Prime Minister Theresa May lays out a version of Brexit in which the UK pays to have access to the single market on a permanent basis – something similar to Switzerland's agreement with the EU. It remains uncertain what Theresa May will signal in her ‘update on Brexit negotiations so far' on Friday, and the event will attract a lot of attention in the financial markets, as this speech was the main reason why this week's Brexit negotiations were cancelled.
Japan recorded a higher-than-expected trade surplus in August, data released overnight showed. Both imports and exports are expanding by double-digit growth rates (15.2% y/y and 18.2% y/y, respectively) indicating that the momentum in the Japanese economy is strong and still driven by net exports.
Australia’s Westpac Leading Index Fell In August
For the 24 hours to 23:00 GMT, the AUD rose 0.54% against the USD and closed at 0.8007.
LME Copper prices rose 0.1% or $5.0/MT to $6492.0/MT. Aluminium prices rose 2.0% or $41.0/MT to $2107.5/MT.
In the Asian session, at GMT0300, the pair is trading at 0.8016, with the AUD trading 0.11% higher against the USD from yesterday's close.
Overnight data indicated that that Australia's Westpac leading index retreated 0.08% in August on a monthly basis in August, after recording a revised gain of 0.09% in the previous month.
The pair is expected to find support at 0.7978, and a fall through could take it to the next support level of 0.7940. The pair is expected to find its first resistance at 0.8038, and a rise through could take it to the next resistance level of 0.8060.
The currency pair is trading above its 20 Hr and 50 Hr moving averages.

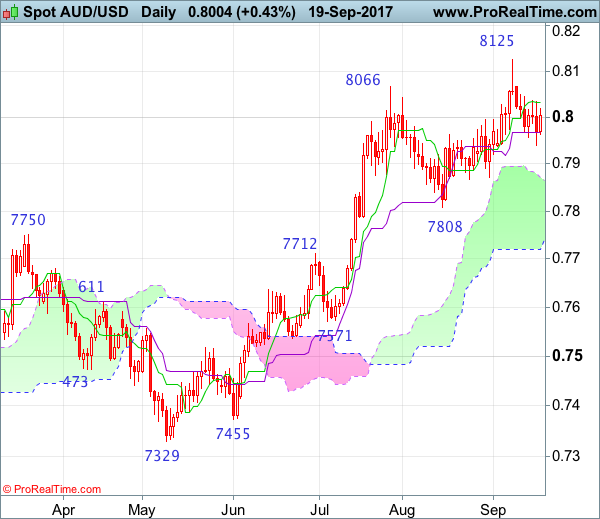
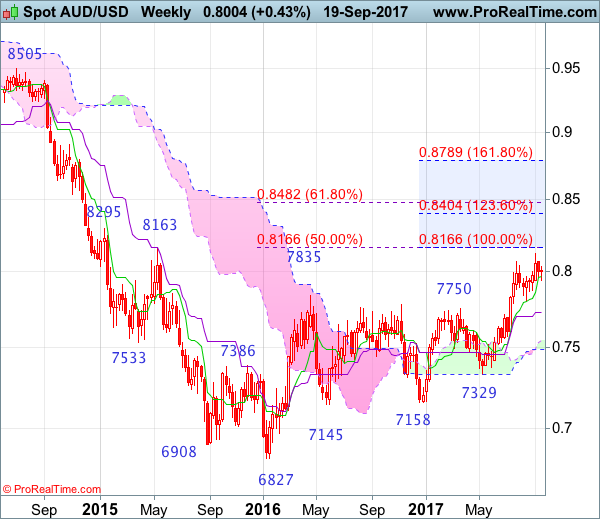
AUD/USD Candlesticks and Ichimoku Analysis
Weekly
• Last Candlesticks pattern: Long white candlestick
• Time of formation: 10 Jul 2017
• Trend bias: Up
Daily
• Last Candlesticks pattern: Long white candlestick
• Time of formation: 18 Jul 2017
• Trend bias: Up
Aussie only rose to as high as 0.8125 before retreating, a shooting star was formed on the daily chart (followed by a black candlestick), suggesting consolidation below this level would be seen and pullback towards support at 0.7867-71 is likely, however, a daily close below there is needed to signal a temporary top has been formed at 0.8125, bring retracement of recent rise to another previous support at 0.7808 which is likely to hold on first testing.
On the upside, expect recovery to be limited to 0.8050-60 and said resistance should remain intact, bring another retreat later. Above said resistance at 0.8125 would extend the medium term erratic rise from 0.6827 to 0.8163 resistance, however, loss of near term upward momentum should limit upside to 0.8200 and reckon 0.8260-65 (61.8% projection of 0.7329-0.8066 measuring from 0.7808) would hold, price should falter well below another previous resistance at 0.8295, bring retreat later.
Recommendation: Sell at 0.8060 for 0.7860 with stop above 0.8130
On the weekly chart, although aussie extended recent rise to 0.8125 earlier this month, the subsequent retreat suggests consolidation below this level would be seen and pullback to 0.7865-70 cannot be ruled out, however, break of support at 0.7808 is needed to signal a temporary top is formed, bring retracement of recent rise to 0.7727 (50% Fibonacci retracement of 0.7329-0.8125 as well as current level of the Kijun-Sen), however, reckon downside would be limited to 0.7675-80 and 0.7630-35 (61.8% Fibonacci retracement) would hold, bring rebound later.
On the upside, whilst recovery to 0.8050-60 cannot be ruled out, as long as said resistance at 0.8125 holds, prospect of another retreat remains, above said resistance at 0.8125 would extend the erratic rise from 0.6827 low to previous resistance at 0.8163, then 0.8200 but near term overbought condition should limit upside to 0.8260-65 (61.8% projection of 0.7329-0.8066 measuring from 0.7808) and another previous resistance at 0.8295 should hold, price should falter well below 0.8390-00, bring retreat later.
German Investor Confidence Sharply Picked-Up In September
For the 24 hours to 23:00 GMT, the EUR rose 0.32% against the USD and closed at 1.1995, after data showed that German investor morale sharply improved in September.
Data indicated that Germany's ZEW economic sentiment index climbed more-than-anticipated to a level of 17.0 in September, strengthening for the first time in four months, amid increased optimism among investors in the wake of strong economic growth and increased investment in the Euro-zone's largest economy. In the previous month, the index had registered a reading of 10.0, while markets had anticipated for an advance to a level of 12.0. Additionally, the nation's current situation index unexpectedly rose to a six-year high level of 87.9 in September, defying market consensus for a drop to a level of 86.2 and following a reading of 86.7 in the previous month.
Separately, the Euro-zone's ZEW economic sentiment index climbed to a level of 31.7 in September, less than market expectations for a rise to a level of 32.4 and compared to a level of 29.3 recorded in the previous month. Additionally, the region's seasonally adjusted construction output rose 0.2% on a monthly basis in July, after recording a revised similar rise in the prior month. Moreover, the region's seasonally adjusted current account surplus widened to a level of €25.1 billion in July, compared to a revised surplus of €22.8 billion in the prior month.
In the US, data revealed that housing starts surprisingly eased 0.8% on a monthly basis to an annual rate of 1180.0K in August, dropping for the second straight month, amid a notable decrease in multi-family construction. Markets had envisaged housing starts to drop to a level of 1174.0K, compared to a revised level of 1190.0K in the prior month. On the other hand, the nation's building permits unexpectedly advanced 5.7% on a monthly basis to an annual rate of 1300.0K in August, notching its highest level in seven months and confounding market consensus for a fall to a level of 1220.0K. In the previous month, building permits had registered a revised level of 1230.0K.
In the Asian session, at GMT0300, the pair is trading at 1.2009, with the EUR trading 0.12% higher against the USD from yesterday's close.
The pair is expected to find support at 1.1970, and a fall through could take it to the next support level of 1.1930. The pair is expected to find its first resistance at 1.2034, and a rise through could take it to the next resistance level of 1.2058.
Going ahead, investors will look forward to Germany's producer price index for August, slated to release in a few hours. Later in the day, market participants will keenly await the outcome of the Federal Reserve's (Fed) monetary policy meeting. The central bank is widely anticipated to announce plans on paring back its massive balance sheet. Also, the US existing home sales data for August, due to release later in the day, will be on investors' radar.
The currency pair is trading above its 20 Hr and 50 Hr moving averages.

Pound Trading Higher, Ahead Of Britain’s Retail Sales Data
For the 24 hours to 23:00 GMT, the GBP marginally declined against the USD and closed at 1.3513.
In the Asian session, at GMT0300, the pair is trading at 1.3523, with the GBP trading 0.07% higher against the USD from yesterday's close.
The pair is expected to find support at 1.3477, and a fall through could take it to the next support level of 1.3432. The pair is expected to find its first resistance at 1.3560, and a rise through could take it to the next resistance level of 1.3598.
Looking forward, traders will keep a close watch on UK's retail sales data for August, scheduled to release in a few hours.
The currency pair is trading above its 20 Hr moving average and showing convergence with its 50 Hr moving average.

Japan’s Adjusted Merchandise Trade Surplus Widened In August
For the 24 hours to 23:00 GMT, the USD slightly rose against the JPY and closed at 111.52.
In the Asian session, at GMT0300, the pair is trading at 111.52, with the USD trading flat against the JPY from yesterday's close.
Overnight data indicated that Japan's adjusted merchandise trade surplus expanded less-than-anticipated to ¥367.3 billion in August, following a revised surplus of ¥363.1 billion in the previous month, while markets were anticipating the country's adjusted merchandise trade surplus to rise to ¥404.7 billion.
Further, the nation's exports surged at its fastest pace in nearly four years, after it climbed more-than-anticipated by 18.1% on an annual basis in August, compared to a rise of 13.4% in the prior month. Also, the nation's imports rose more-than-expected by 15.2% YoY in August, after recording a rise of 16.3% in the previous month.
The pair is expected to find support at 111.19, and a fall through could take it to the next support level of 110.85. The pair is expected to find its first resistance at 111.87, and a rise through could take it to the next resistance level of 112.21.
Moving ahead, investors will focus on the Bank of Japan's (BoJ) monetary policy meeting, scheduled tomorrow.
The currency pair is showing convergence with its 20 Hr and 50 Hr moving averages.
