Sample Category Title
Loonie Reverses Its Losses In The Morning Session
For the 24 hours to 23:00 GMT, the USD rose 0.1% against the CAD and closed at 1.2291.
In the Asian session, at GMT0300, the pair is trading at 1.2281, with the USD trading 0.08% lower against the CAD from yesterday’s close.
The pair is expected to find support at 1.2254, and a fall through could take it to the next support level of 1.2228. The pair is expected to find its first resistance at 1.2308, and a rise through could take it to the next resistance level of 1.2336.
The currency pair is showing convergence with its 20 Hr moving average and trading above its 50 Hr moving average.

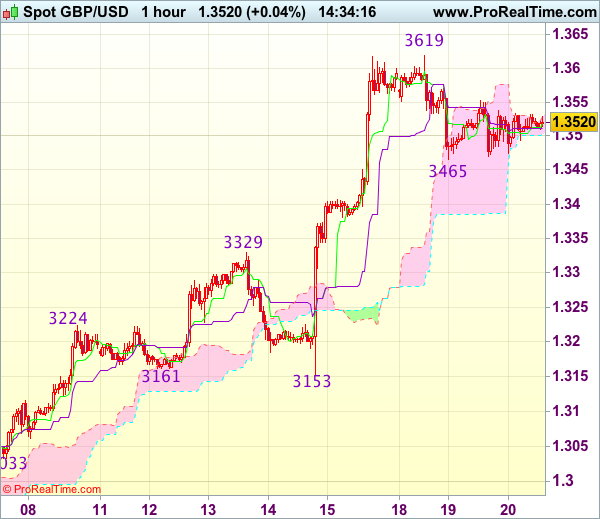
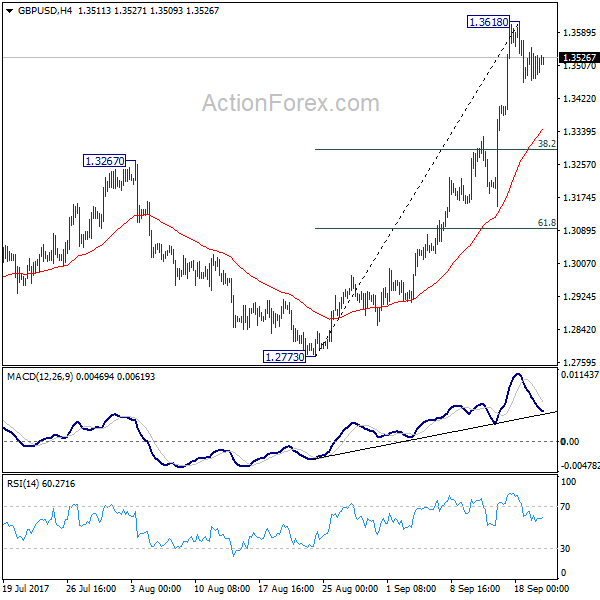
Trade Idea : GBP/USD – Stand aside
GBP/USD - 1.3517
Most recent candlesticks pattern : N/A
Trend : Up
Tenkan-Sen level : 1.3519
Kijun-Sen level : 1.3511
Ichimoku cloud top : 1.3529
Ichimoku cloud bottom : 1.3502
Original strategy :
Buy at 1.3400, Target: 1.3560, Stop: 1.3365
Position : -
Target : -
Stop : -
New strategy :
Stand aside
Position : -
Target : -
Stop : -
The British pound has remained confined within near term established range and further consolidation would take place, although risk of another corrective fall towards support at 1.3465 remains, break there is needed to signal a temporary top has been formed at 1.3619, bring retracement of recent upmove to 1.3430 and later towards 1.3400 but reckon 1.3375-80 would hold from here.
On the upside, whilst recovery to 1.3550-55 cannot be ruled out, break of 1.3575-80 is needed to signal the pullback from 1.3619 has ended, bring retest of this level first. break there would extend recent upmove towards 1.3650 later. As near term outlook has turned mixed, would be prudent to stand aside in the meantime.
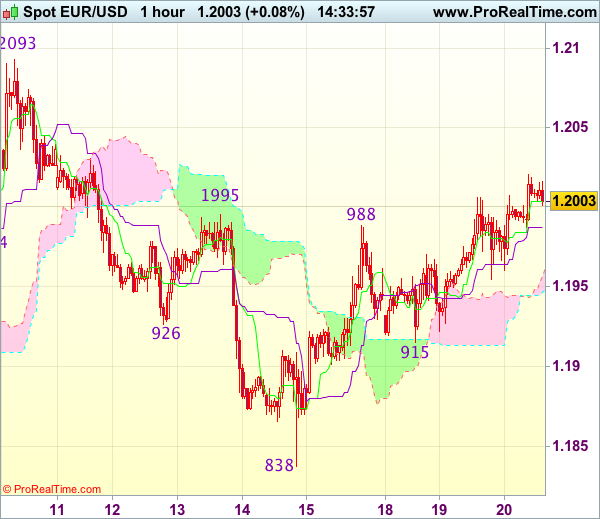
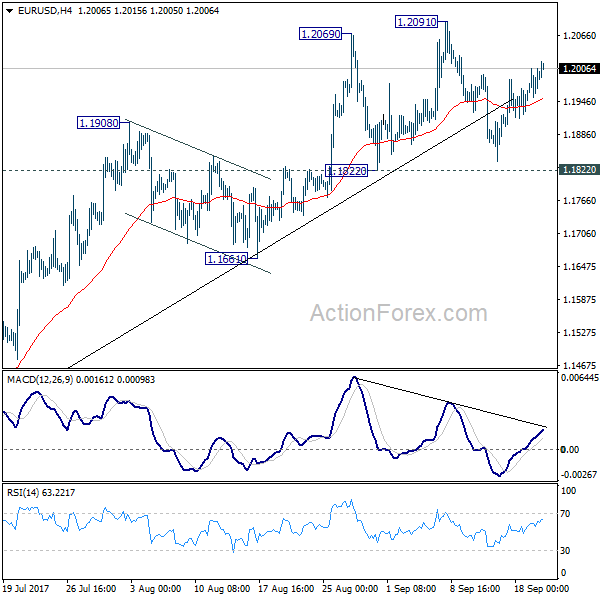
Trade Idea : EUR/USD – Hold long entered at 1.1970
EUR/USD - 1.2002
Most recent candlesticks pattern : N/A
Trend : Sideways
Tenkan-Sen level : 1.2004
Kijun-Sen level : 1.1964
Ichimoku cloud top : 1.1947
Ichimoku cloud bottom : 1.1913
Original strategy :
Bought at 1.1970, Target: 1.2070, Stop: 1.1935
Position : - Long at 1.1970
Target : - 1.2070
Stop : - 1.1935
New strategy :
Hold long entered at 1.1970, Target: 1.2070, Stop: 1.1950
Position : - Long at 1.1970
Target : - 1.2070
Stop : - 1.1950
Yesterday’s breach of indicated resistance at 1.1995-00 (previous resistance and 61.8% Fibonacci retracement of 1.2093-1.1838) adds credence to our view that the fall from 1.2093 top has ended at 1.1838 last week and consolidation with upside bias remains for further gain to 1.2030-35, then 1.2050-55, however, break of 1.2070 is needed to signal early upmove has resumed for retest of 1.2093 first.
In view of this, we are holding on to our long position entered at 1.1970. Below 1.1950-55 would defer and risk weakness towards support at 1.1915 (Monday’s low) but only break there wold signal the rebound from 1.1838 has ended instead, bring further fall to 1.1880.
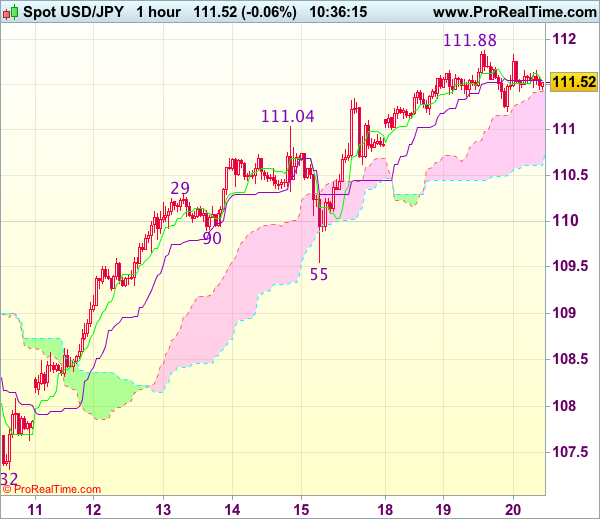
Trade Idea : USD/JPY – Buy at 110.70
USD/JPY - 111.41
Most recent candlesticks pattern : N/A
Trend : Up
Tenkan-Sen level : 111.49
Kijun-Sen level : 111.54
Ichimoku cloud top : 111.47
Ichimoku cloud bottom : 110.88
Original strategy :
Buy at 110.70, Target: 111.70, Stop: 110.35
Position : -
Target : -
Stop : -
New strategy :
Buy at 110.70, Target: 111.70, Stop: 110.35
Position : -
Target : -
Stop : -
Dollar’s retreat after rising to 111.88 yesterday has retrained our view that minor consolidation below this level would be seen and pullback to 111.00 cannot be ruled out, however, reckon 110.60-70 would limit downside and bring another rise later, above said resistance would extend recent upmove to 112.00, then 112.20 (previous resistance) but near term overbought condition should prevent sharp move beyond 112.40-45.
In view of this, would not chase this move here and would be prudent to buy dollar on subsequent pullback as 110.60-70 should limit downside. Below 110.45-50 would abort and signal a temporary top is formed instead, risk correction to 110.30, then towards 110.00 which is likely to hold from here.
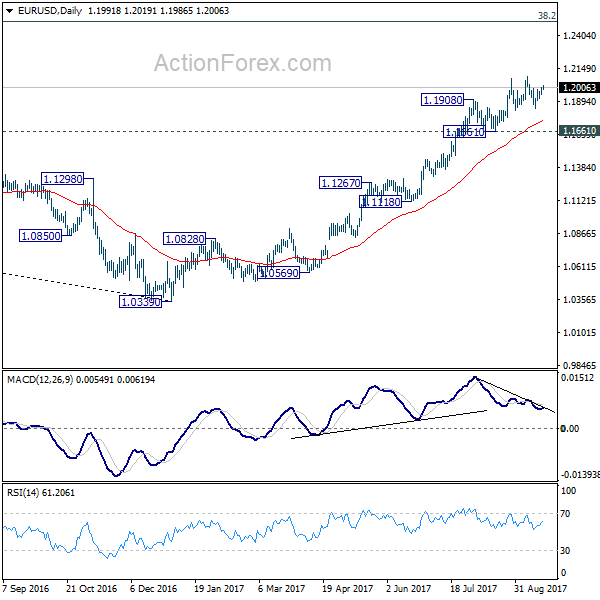
EUR/USD Daily Outlook
Daily Pivots: (S1) 1.1959; (P) 1.1983 (R1) 1.2017; More...
Intraday bias in EUR/USD is mildly on the upside for retesting 1.2091. Break will extend larger rise from 1.0339 and target next key fibonacci level at 1.2516. In any case, outlook will remain bullish as long as 1.1822 support holds. But considering bearish divergence condition in 4 hour MACD, break of 1.1822 will confirm short term topping and bring deeper fall back to 1.1661 support and below.
In the bigger picture, rise from medium term bottom at 1.0339 is still in progress for 38.2% retracement of 1.6039 (2008 high) to 1.0339 (2017 low) at 1.2516. However, it should be noted that there is no confirmation of trend reversal yet. That is, such rebound from 1.0399 could be a correction. And the long term fall fro 1.6039 (2008 high) could resume. Hence, we'd be cautious on strong resistance from 1.2516 to limit upside. But after all, break of 1.1661 is needed to indicate medium term topping. Otherwise, outlook will remain bullish in case of pull back.
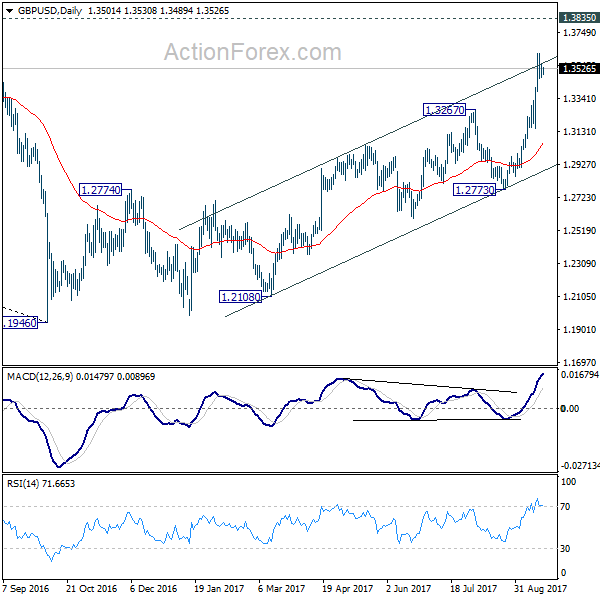
GBP/USD Daily Outlook
Daily Pivots: (S1) 1.3470; (P) 1.3510; (R1) 1.3553; More....
Intraday bias in GBP/USD remains neutral for consolidation below 1.3618 temporary top. Downside of retreat should be contained by 38.2% retracement of 1.2773 to 1.3618 at 1.3295 and bring rise resumption. Above 1.3618 will turn bias back to the upside for 1.3835 support turned resistance next. Break there will target 55 month EMA (now at 1.4405).
In the bigger picture, the strong break of 1.3444 key resistance now argues that the long term trend in GBP/USD has reversed. That is a key bottom was formed back in 1.1946 on bullish convergence condition in monthly MACD. Current rise from 1.1946 will target 38.2% retracement of 2.1161 (2007 high) to 1.1946 (2016 low) at 1.5466 next. In any case, medium term outlook will now stay bullish as long as 1.2773 support holds.
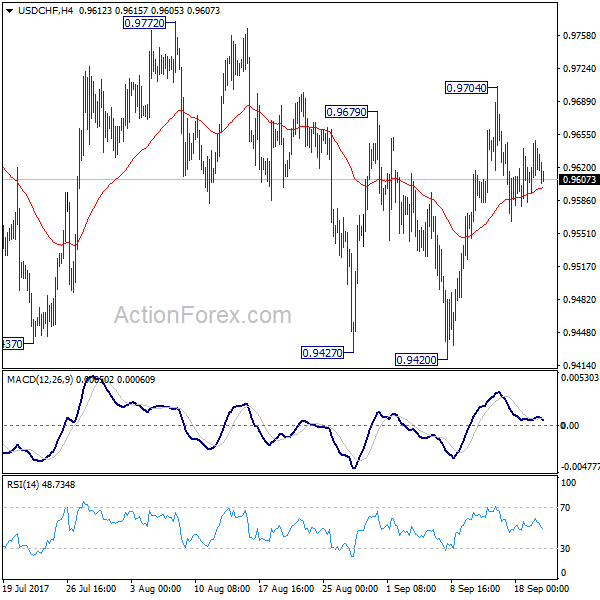
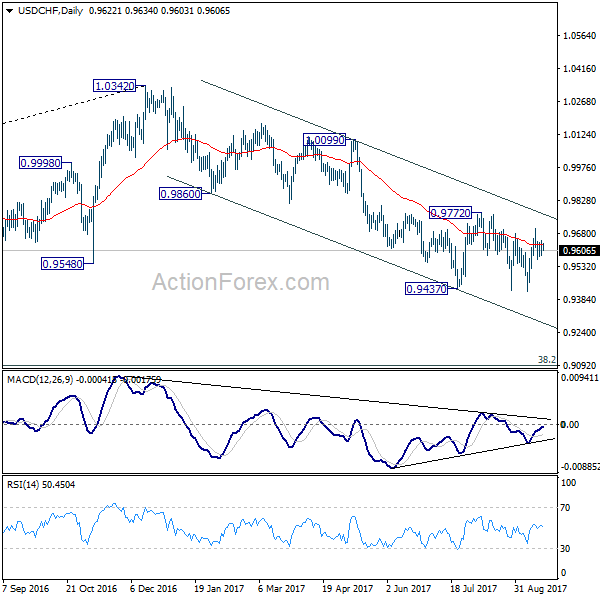
USD/CHF Daily Outlook
Daily Pivots: (S1) 0.9597; (P) 0.9622; (R1) 0.9651; More....
No change in USD/CHF's outlook. Deeper fall is still in favor to 0.9420 support. Also, with 0.9772 resistance intact, outlook remains bearish. Break of 0.9420 will resume medium term fall from 1.0342 and target next long term fibonacci level at 0.9090. However, firm break of 0.9772 will indicate trend reversal and turn outlook bullish.
In the bigger picture, current development suggests that 0.9443 key support (2016 low) could be taken out firmly as down trend form 1.0342 extends. There are various interpretation of the price actions. But in any case, medium term outlook will stay bearish as long as 0.9772 resistance holds. Current down trend could extend to 38.2% retracement of 0.7065 (2011 low) to 1.0342 (2016 high) at 0.9090. However, break of 0.9772 will indicate that USD/CHF has successfully defended 0.9443 again and turn outlook bullish for 1.0099 resistance.
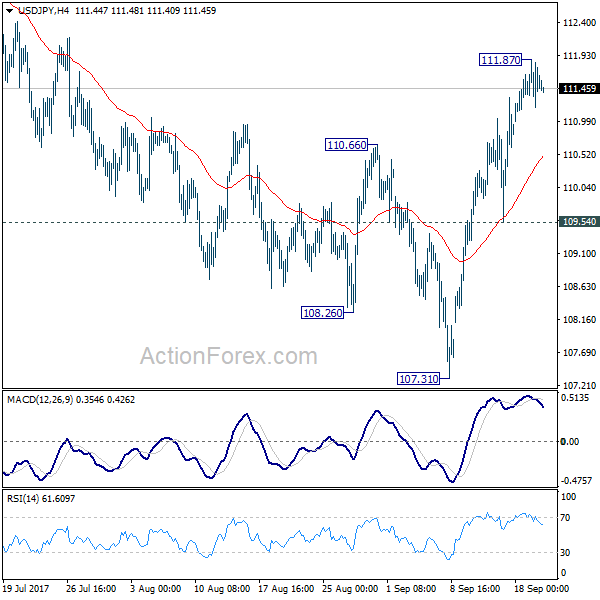
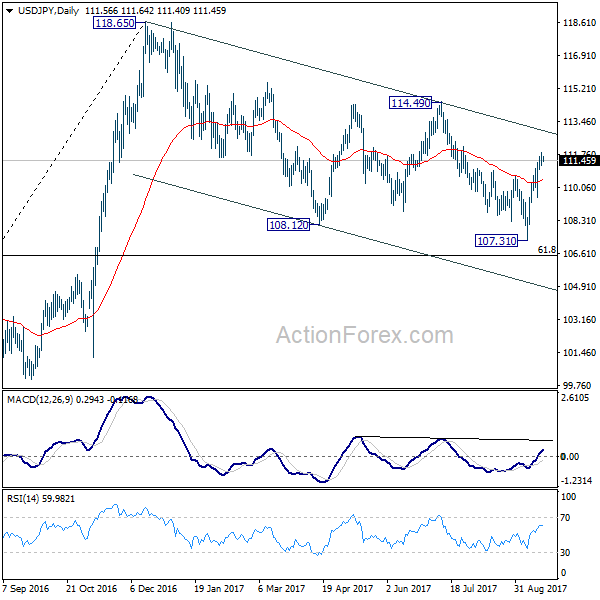
USD/JPY Daily Outlook
Daily Pivots: (S1) 111.23; (P) 111.55; (R1) 111.92; More...
A temporary top is in place at 111.87 in USD/JPY. Intraday bias is turned neutral for some consolidations first. Downside should be contained above 109.54 support to bring another rally. Above 111.87 will target medium term channel resistance (now at 112.91). Sustained break there will argue that whole correction from 118.65 has completed too. In that case, further rise should be seen to 114.49 resistance for confirmation.
In the bigger picture, rise from 98.97 (2016 low) is seen as the second leg of the corrective pattern from 125.85 (2015 high). It's unclear whether this this second leg has completed at 118.65 or not. But medium term outlook will be mildly bearish as long as 114.49 resistance holds. And, there is prospect of breaking 98.97 ahead. Meanwhile, break of 114.49 will bring retest of 125.85 high. But even in that case, we don't expect a break there on first attempt.
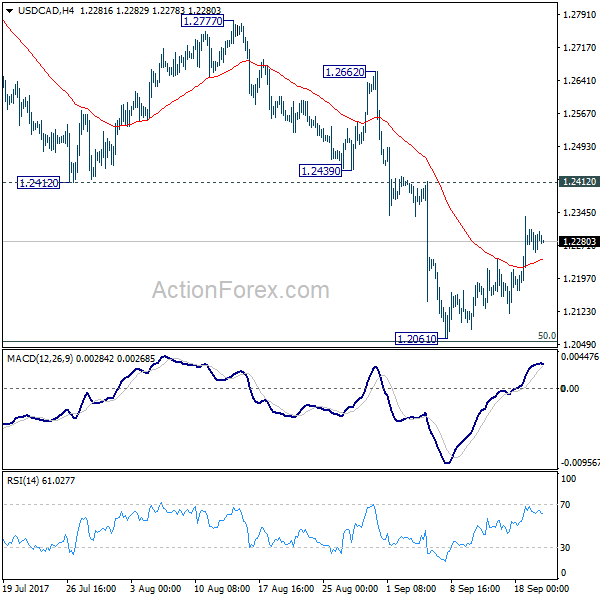
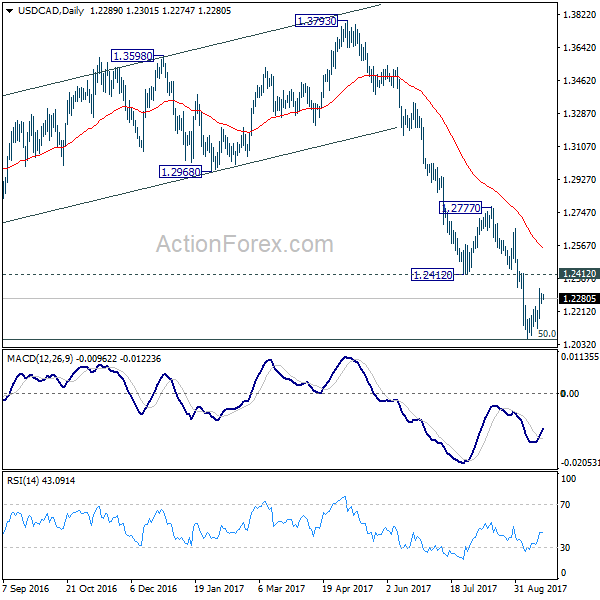
USD/CAD Daily Outlook
Daily Pivots: (S1) 1.2260; (P) 1.2284; (R1) 1.2314; More....
Intraday bias in USD/CAD remains neutral for the moment. On the one hand, we'd remain cautious on strong support from 1.2049 key fibonacci level to bring sustainable rebound. On the other hand, break of 1.2514 support turned resistance is needed to be the first sign of trend reversal. Otherwise, outlook will remain bearish. Firm break of 1.2049 key fibonacci level will pave the way to next fibonacci level at 1.1424.
In the bigger picture, current downside acceleration is raising the chance that whole long term rise from 0.9406 (2011 low), and that from 0.9056 (2007 low) is completed at 1.4689. Focus is now on 50% retracement of 0.9406 to 1.4869 at 1.2048. As long as this level holds, we'd still favor that case that fall from 1.4689 is a correction. However, firm break of 1.2048 will indicate that fall fro 1.4689 is at least a medium term down trend and should target 61.8% retracement at 1.1424 and below.
AUD/USD Daily Outlook
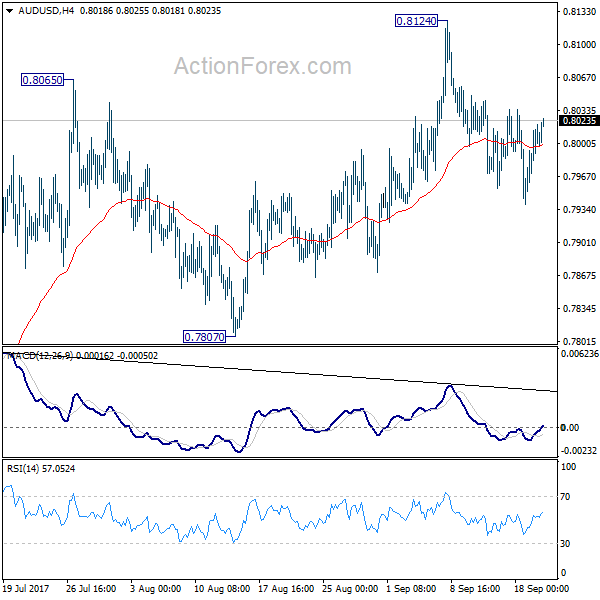
Daily Pivots: (S1) 0.7968; (P) 0.7994; (R1) 0.8033; More...
AUD/USD's recovery continues today but it's staying well below 0.8124 resistance. Intraday bias remains neutral for the moment. The consolidation from 0.8124 could extend further. Another fall cannot be ruled out. But still, with 0.7807 support intact, near term outlook stays bearish and another rise is expected. Break of 0.8124 will turn bias to the upside and target 100% projection of 0.6826 to 0.7833 from 0.7328 at 0.8335 next. However, considering bearish divergence condition in 4 hour MACD, firm break of 0.7807 will indicate near term reversal and turn bias back to the downside for 0.7328 key support.
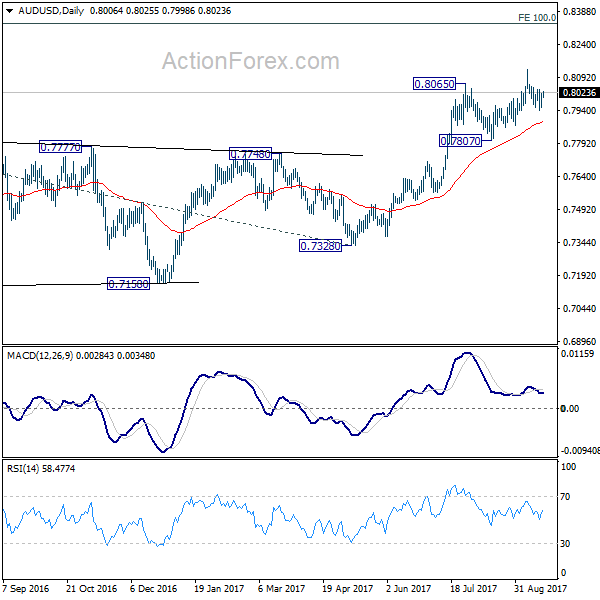
In the bigger picture, rise from 0.6826 medium term bottom is still in progress. At this point, there is no confirmation of trend reversal yet and we'll continue to treat such rebound as a corrective pattern. But in any case, break of 55 month EMA (now at 0.8090) will target 38.2% retracement of 1.1079 to 0.6826 at 0.8451. Break of 0.7807 support is needed to to be the first sign of completion of the rebound. Otherwise, further rise is now in favor.