Sample Category Title
New Zealand Election: Change in Government is NZD-Negative in Near-Term
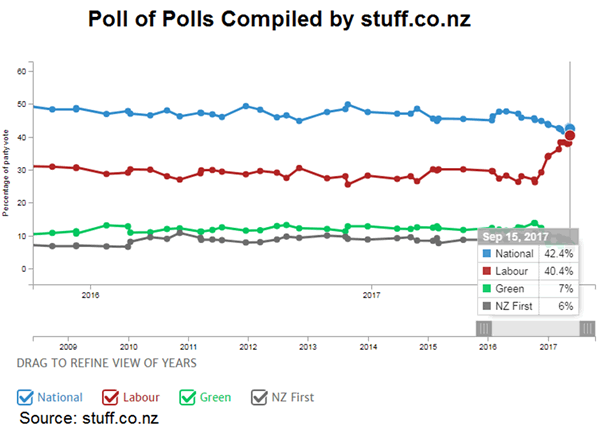
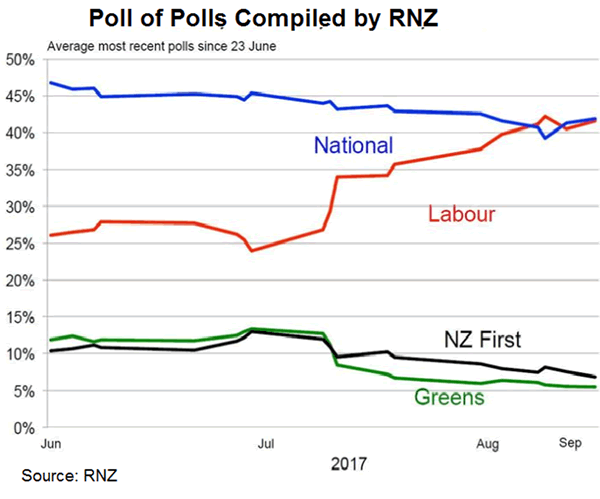
The upcoming New Zealand election would be a tight race between the incumbent National Party and Labor Party. Polls of polls compiled by both RNZ and Stuff indicate that supports for both parties are at around 40%. Moreover, opinion polls have been suggesting that neither of the parties would be able to a government without forming coalition with smaller parties. This is such uncertainty that has increased the volatility of New Zealand dollar of late. This report compares the impacts of various scenarios on the economic growth outlook and the monetary policy, hence the exchange rate. We believe that maintain the status quo - a minority government led by Nationals- would be the most NZD-favorable, while a Labor + Green+ NZ First trio would lead to an immediate, but short-term selloff in the currency.
Nationals + other small parties
The National Party has been in office since 2008. Winning 60 seats, (61 is required to form a majority government, in the last election in 2014, Nationals entered confidence and supply agreements with a number of parties including United Future, ACT and Māori. The situation replicated that of the 2011 election, when Nationals got 58 seats, 2 seats short of a majority. Therefore, this scenario signals continuation of the status quo and should be the most favorable for New Zealand dollar with the least political uncertainties.
On the policy front, a centre-right National party favors maintaining free and open markets for labor and capitals. It proposes tax reduction and less fiscal spending than Labors. This should be positive for investments, and hence GDP growth.
On housing market, the National Party proposes a NZ$1B Housing Infrastructure Fund to "accelerate new housing in the high-demand areas where it's needed most". The new fund will "focus squarely on financing infrastructure like roads and water needed to support new housing". It also seeks to continue with the first home buyer grants.
Nationals + NZ First
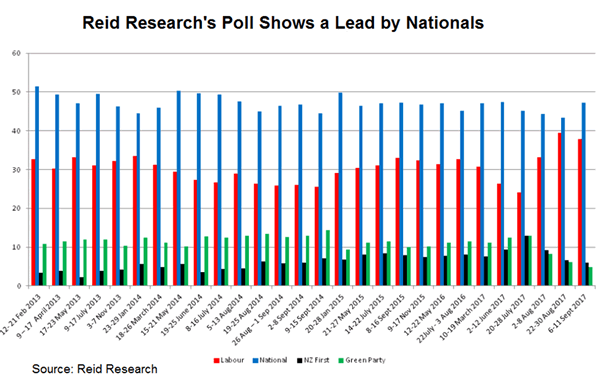
The populist NZ First Party had experiences of forming governments with both Nationals (1996 to 1998) and Labors (2005 to 2008). Its leader Winston Peters has noted that he would work with the largest party. The latest result from Newshub'sReid Research suggests that supports for Nationals rose to 47.3%, leading Labors' 37.6%. NZ First would likely ally with Nationals if that's the case.
NZ First is closer to Nationals on social policies but closer to Labors on economic policies. Contrary to Nationals, NZ First proposes to limit foreign investments, revise current FTA deals to "make sure they are real and are in our interests (such as protection of land and strategic assets) and "renegotiate existing poor-quality deals to increase their quality and benefit".
While emplacing the quality of immigrants, Nationals have not proposed a cut in the net immigration per year. However, NZ First favors the most restrictive immigration policy amongst all parties. It proposes to attract highly-skilled migrants by sharply cutting numbers to around 10K per annum, from the current 72K. It also proposes to adopt strict control over immigration under "family reunion" and "make sure that Kiwi workers are at the front of the job queue".
On the housing market, besides subsidies, NZ First "initiates the New Zealand Housing Plan to revamp the New Zealand housing market covering housing availability and affordability as well as rental homes supply and affordability". Indeed, NZ First's proposal to reduce net immigration would pressure housing prices.
NZ First requests to reform the Reserve Bank Act, aiming at achieving a "more exporter-friendly" RBNZ and "sensible exchange rate regime". This implies lower exchange rate and a more accommodative monetary policy.
Reduction in net immigration should weigh on economic growth over coming years. Lower housing prices suggest that the RBNZ would have more room to leave interest rates low for a long period of time, if needed. Together with the proposed central bank reform, NZ First's platform should be negative for New Zealand dollar. However, it is unlikely all of its plans would be taken in such a coalition government. Therefore, the actual impacts on exchange rate would depend on how many, and to what extent, of its policies are adopted.
Labor + Green/ Labor + Green+ NZ First
The centre-left Labor Party and the left-wing Green Party are natural coalition partners. The latest Colmar Brunton polls suggest that Labor (44%) and Green (7%) are capable of forming a government without NZ First. Poll of polls, however, indicated that it is only possible for Labor to lead with this trio. We believe the scenario of Labor + Green+ NZ First would create the most changes and uncertainties. This should pose the most downside risks to New Zealand dollar in the near term
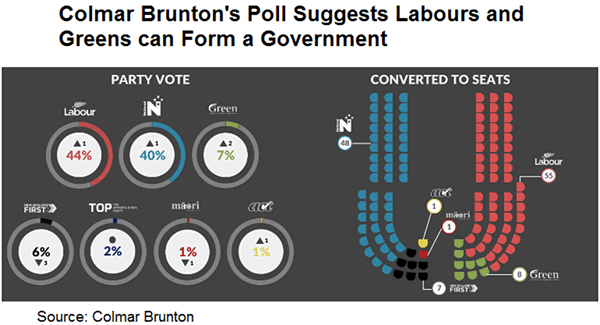
The Labor Party proposes to increase fiscal spending, mainly on health and education. On tax, it proposes capital gains tax on rental properties resold within five years (currently two), while the Green Party opts for a capital gains tax on rental properties. However, NZ First does not favor such taxes.
On the housing market, Labor's KiwiBuild program will build 100K "high quality, affordable homes over 10 years, with 50% of them in Auckland". It would also create an Affordable Housing Authority to fast-track development. We believe these do not contract the housing platforms of the other two parties.
While labors support limiting immigrants, its proposed reduction of net immigration to around 30K per year is less aggressive than NZ First's 10K per year. At an interview with Newshub, Greens also admitted that net migration would likely fall under their policy, which aims for a "sustainable net migration flow to limit effects on our environment, society and culture". The party emphasized that the policy "is not on picking a number or target" but on ensuring "good services, houses and support for people who want to make New Zealand their home". As such, a government with Labors should including a policy of immigration reduction, which is expected to shrink GDP growth in the long-term.
Same as NZ First, both Labors and Greens support reforms of the Reserve Bank Act. Back by the Greens, Labors propose a move to committee-based decision making and a dual mandate that includes employment (price stability already exists) in RBNZ's monetary policy setting. Don Brash, the RBNZ governor in 1989, warned that the change to dual mandate might "lead to some loss of confidence in the New Zealand dollar". Indeed, a dual-mandate would mark one of the biggest changes for the RBNZ. Depending how the mandate is formulated, a full employment mandate, together with the current 1-3% inflation target, would theoretically lead to looser monetary policy, or a slower pace of rate hike. As such, the scenario would result in a RBNZ reform that would skew the risk of the monetary policy to an easy side.
A government led by the National Party would be the most favorable for New Zealand dollar, as this signals less uncertainty, more open economic policy and less change in the RBNZ. A Labor-led government, with its immigration and housing market policies, as well as the proposed reform on the central bank, would weigh on New Zealand dollar. The magnitude of impacts would even increase with NZ First joining the coalition.
Dollar Retreats ahead of Fed Announcement Tomorrow
The US dollar posted modest losses during today's session as traders were fixated on tomorrow's announcement by the Federal Reserve.
The dollar made its highs towards the end of today's Asian session, but lost ground after that. Dollar/yen, in particular, saw significant profit-taking after the substantial gains of the previous days. From 111.83 the pair fell to as low as 111.23, rebounding to 111.40. Euro/dollar also peaked above 1.20 earlier in the day but was not far from that level at 1.1978. The pound was trying to hold on to the 1.35 mark against the greenback at 1.3498.
The Fed was foremost in the mind of traders as the central bank of the largest economy in the world was expected to announce the starting date of the scheduled reduction of its $4.5 trillion balance sheet of Treasury and mortgage-backed securities. The planned reduction would proceed and build up at a very slow pace so as not to cause a disruption in the markets or a sudden spike in bond yields. No change in interest rates was expected from the Fed, but some hints as to the chances of another hike this year as well as an update of the terminal rate when the hiking process finishes, are expected.
In today's economic news, the German ZEW investor survey painted an upbeat picture ahead of the German federal elections during the weekend. The ZEW did not help the euro to rally much, as the market seems to need a significant catalyst to push the single currency above 1.20 versus the dollar and make a run for 1.21. There was a Reuters report that temporarily hurt the euro as sources said the ECB would refrain from setting an end date to the asset purchase program during its October meeting, in order to keep the option of extending its QE program's duration if necessary.
In other economic news, there were a few key releases from the United States. August housing starts fell from the upwardly revised July number but managed to beat expectations, while building permits powered ahead to a 1.3 million annualized pace during the same month. Building permits jumped 5.7% on the month. The US current account deficit remained a source of weakness for the dollar during the second quarter as it worsened to 123.1 billion dollars (from a deficit of 113.5 billion during the previous quarter). Finally, both export prices and import prices increased by 0.6% during August compared to the previous month.
In other currencies, the New Zealand dollar performed strongly on Tuesday while the Global Dairy Trade (GDT) price index came in with an increase of 0.9% compared to the previous reference price 2 weeks ago. Kiwi traders are eagerly anticipating the result of New Zealand's elections during the weekend.
A speech by President Trump before the UN General Assembly did not move markets much as it mainly seemed to be a repeat of previous foreign policy arguments.
Finally in commodities, gold rebounded a touch to $1309 an ounce, while oil enjoyed a strong rally from Monday's lows and scaled the $50 a barrel level (WTI US futures) to $50.12.
USD Struggles Going into the FOMC Decision
- European equities trade flat to slightly higher in an uneventful session. US equities start trading with marginal gains.
- The German ZEW economic sentiment index improved in September with the current situation sub-index nearly matching the cycle high and the expectations component rising substantially. A rebound in equity prices was probably favourable. The results suggest the economy is near its peak, but no sign yet of a downturn.
- Italian banks already hit by billions of euros in losses on bad loans are moving on to what may be a trickier category of distressed debt as they seek to clean up their balance sheets, Bloomberg wrote. Now, attention focus to loans involving borrowers that are still going concern, but unlikely to meet their obligations.
- Norway's oil fund, the world's largest sovereign wealth fund, has topped $1tn for the first time in its history. In a country of just 5.2m people, the oil fund has been an extraordinary success, growing faster than ministers imagined to become one of the world's largest investors, owning on average 1.3% of every listed company in the world.
- According to Reuters, ECB policy makers disagree on the fate of the bond programme. German and other northern countries are ready to wind down purchases, while others want to reduce the monthly pace of buying. Furthermore, a decision may be postponed to December and any end-date for purchases might not be set in stone.
- The Hungarian central bank cuts its overnight deposit rate by 10 basis points to -0.15% and leaves its benchmark 3-month deposit rate unchanged at 0.9% With the decision to cut, the NBH signals its readiness to counter downside inflation risks. It might also have eyed the (previous) strengthening of the HUF. EUR/HUF fell in a first reaction.
Rates
Core bonds in wait-and-see mode.
Another session of tight trading, but core bonds are nevertheless on their way to break a seven session losing streak, even as gains are very modest. Investors ignored the only eco data of importance, German ZEW economic sentiment. The ZEW survey suggests that the German economy continues to grow fast in September. Equities traded narrowly mixed, while gold stabilized after some losses in previous days. Crude oil tried to move up, but never went far and is now only marginally above opening levels. So, overall markets, including bond ones, traded quietly, with many investors side-lined ahead of tomorrow's FOMC meeting. A Reuters article based on "sources" said ECB policy makers disagree on the fate of the purchase programme (see headlines). It's unclear what conclusion to drawn from it. The Bund rose before and after the publication, but couldn't really build out the gains.
At the time of writing, US yields declined by 1 bp to 1.3 bps. German yields dropped between 0.3 bps (2-yr) and 2.5 bps (30-yr). On intra-EMU bond markets, 10-yr yield spread changes versus Germany were small with Italy and Spain slightly outperforming (-2-to-3 bps).
Currencies
USD struggles going into the FOMC decision
USD trading remained technical in nature today, as investors are counting down to tomorrow's FOMC decision. USD/JPY set a new correction top, but reversed earlier gains later on. EUR/USD traded close to mostly slightly below the 1.20 mark.
Overnight, Asian equities trades with modest losses. Japan outperformed on catching up after yesterday's holiday and yen weakness. PM Abe was rumoured to call snap parliamentary elections. Markets assume that a continuation of the current policy also includes an extension of the ultra-loose BOJ policy. This was an additional negative for the yen. EUR/USD maintained a cautious upward bias (1.1975 area). There was no indication of USD strength going into tomorrow's FOMC decision.
Trading in EUR/USD and USD/JPY was technical driven in Europe too. USD/JPY set a new correction high in the 111.88 area just before the open of the European markets. Afterwards, the dollar lost slightly ground, both against the yen and the euro. EUR/USD even filled offers just north of 1.20. However, a sustained re-break of this psychological barrier didn't occur. A, modest intra-day correction of EUR/JPY probably capped the topside both in EUR/USD and USD/JPY. German ZEW investors sentiment was again stronger than expected, but didn't bring further support for the euro.
Around noon there were again rumours from sources on disagreements within the ECB on the details/timing of APP tapering. The euro lost a few ticks after those headlines and EUR/USD returned temporary to the mid 1.19 area. US housing data were marginally stronger than expected, but the positive surprise was not enough to support the dollar. EUR/USD trades in the 1.1980 area. USD/JPY is changing hands in the 111.45 area. Despite recent USD/JPY gains (which we consider yen weakness), investors remain cautious on the US currency going into the Fed policy decision.
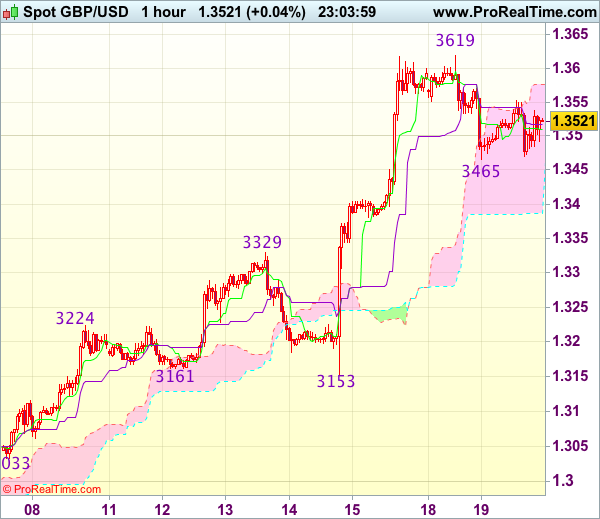
Sterling continues trading off recent top.
Today, sterling traded with a slightly negative intraday bias. Over the previous week, sterling rallied sharply as the BoE warned that it was likely to raise its policy rate in the coming months. The view was also subscribed by BoE governor Carney in a speech yesterday evening. Even so, the Carney comments marked the start of a (modest) countermove that filtered through into today's trading. The political bickering between UK PM May and UK Foreign Secretary Johnson was maybe also a slightly sterling negative. EUR/GBP trades currently at 0.8865. Cable hovers around 1.3525. Is sterling topping out after its impressive rebound?
Trade Idea Wrap-up: GBP/USD – Buy at 1.3400
GBP/USD - 1.3525
Most recent candlesticks pattern : N/A
Trend : Up
Tenkan-Sen level : 1.3510
Kijun-Sen level : 1.3518
Ichimoku cloud top : 1.3576
Ichimoku cloud bottom : 1.3386
Original strategy :
Buy at 1.3400, Target: 1.3560, Stop: 1.3365
Position : -
Target : -
Stop : -
New strategy :
Buy at 1.3400, Target: 1.3560, Stop: 1.3365
Position : -
Target : -
Stop : -
Although cable found support at 1.3465 and has recovered, reckon upside would be limited to 1.3570 and risk of another corrective fall remains, below 1.3500 would bring test of said support at 1.3465, then 1.3430 but reckon 1.3400 would attract renewed buying interest, bring another rise later, above 1.3570 would signal the pullback from 1.3619 (yesterday’s high) has ended, bring retest of this level, then 1.3650.
In view of this, would not chase this rise here and would be prudent to buy cable on subsequent pullback as 1.3400-10 should limit downside. Only below the lower Kumo (now at 1.3385) would defer and signal a temporary top is formed, bring retracement of recent rise to 1.3350, then 1.3320-25 but 1.3300 should remain intact.
Traders Waiting for Fed Statement Tomorrow
The EUR/USD regained some lost positions during the trading session. Thus, the positivity of the bulls has assisted the report according to which the current account balance in the Eurozone has grown to 25.1 billion euro in July compared to 22.3 billion euro expected. Moreover, the German ZEW Economic sentiment index improved to 17.0 in September against predicted growth to only 12.3. We recall that the German economy is the largest on the continent. We should mention that despite parliamentary elections in Germany that will be held this Sunday, investors do not fear any surprises from it and remain calm.
American investors were cheered by the strong housing macro statistics according to which the number of building permits increased to 1.30 million in August; that is 0.08 million more than forecasted and the housing starts figure was 1.18 million in the same period which is by 0.01 million above predictions. Investors are reluctant to accumulate positions ahead of tomorrow's release of the Fed statement on monetary policy. Markets do not expect the change in interest rates by the central bank of the US, but the rhetoric concerning the possibility of the rate hike in December way provoke the sharp price movements. Hawkish words from Janet Yellen may become a trigger for the massive sell of EUR/USD after the long rally of the pair.
Among important statistics today we should pay attention to the current account balance in New Zealand, which will be published at 22:45 GMT and the trade balance report in Japan at 23:50 GMT that may also increase the volatility level.
EUR/USD
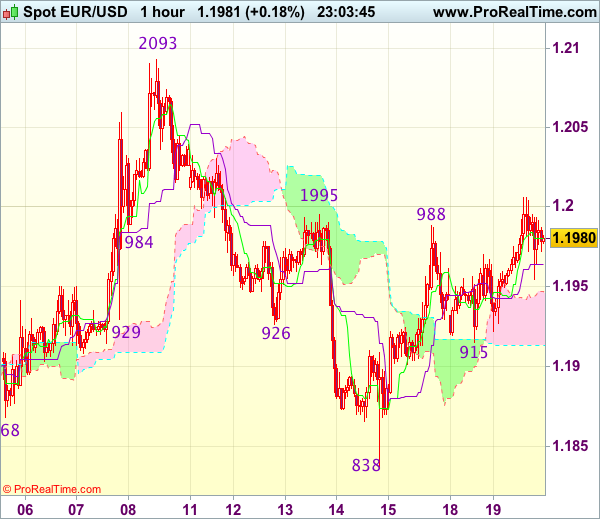
The EUR/USD price tested the resistance at 1.2000, but the bulls were short of strength to push the quotes above this psychologically important mark. In case of successful attempt to gain a foothold above 1.2000, we may see continued increase up to 1.2070. In case of the trend change to negative, the sell signal with the targets at 1.1825 and 1.1750 may become breaking through 1.1925 support line.

GBP/USD
The pound is retreating after the comments of the head of the Bank of England concerning the slow pace of possible monetary tightening in the country. Within the current descending movement, the price will be able to hit the support at 1.3400 and in the instance of fixing below it, we may see a continued drop to 1.3250 and 1.3150. The growth potential is likely to be limited by the 1.3600 mark.

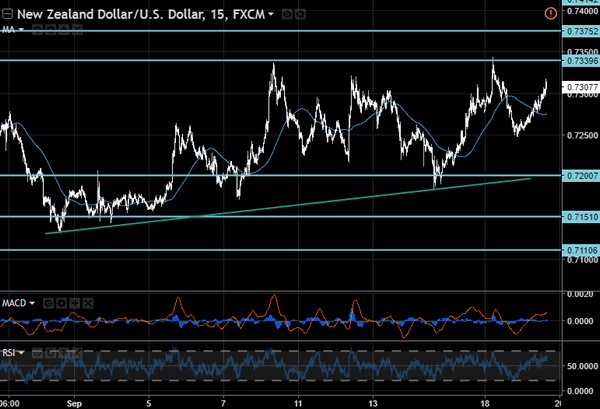
NZD/USD
The New Zealand dollar demonstrates confident upward trend which may approach the closest target levels of 0.7340 and 0.7375. Yesterday investors ignored the positive news about the Westpac Consumer sentiment index to 112.4 in the third quarter vs 113.4 in the previous period. The immediate objective for the bears in case of the price pullback will be at 0.7250.
Trade Idea Wrap-up: EUR/USD – Hold long entered at 1.1970
EUR/USD - 1.1977
Most recent candlesticks pattern : N/A
Trend : Sideways
Tenkan-Sen level : 1.1980
Kijun-Sen level : 1.1964
Ichimoku cloud top : 1.1947
Ichimoku cloud bottom : 1.1913
Original strategy :
Bought at 1.1970, Target: 1.2070, Stop: 1.1935
Position : - Long at 1.1970
Target : - 1.2070
Stop : - 1.1935
New strategy :
Hold long entered at 1.1970, Target: 1.2070, Stop: 1.1935
Position : - Long at 1.1970
Target : - 1.2070
Stop : - 1.1935
Euro’s intra-day breach of indicated resistance at 1.1995-00 (previous resistance and 61.8% Fibonacci retracement of 1.2093-1.1838) adds credence to our view that the fall from 1.2093 top has ended at 1.1838 last week and consolidation with upside bias remains for further gain to 1.2030-35, then 1.2050-55, however, break of 1.2070 is needed to signal early upmove has resumed for retest of 1.2093 first.
In view of this, we are holding on to our long position entered at 1.1970. Below 1.1945-50 would defer and risk weakness towards support at 1.1915 (yesterday’s low) but only break there wold signal the rebound from 1.1838 has ended instead, bring further fall to 1.1880.
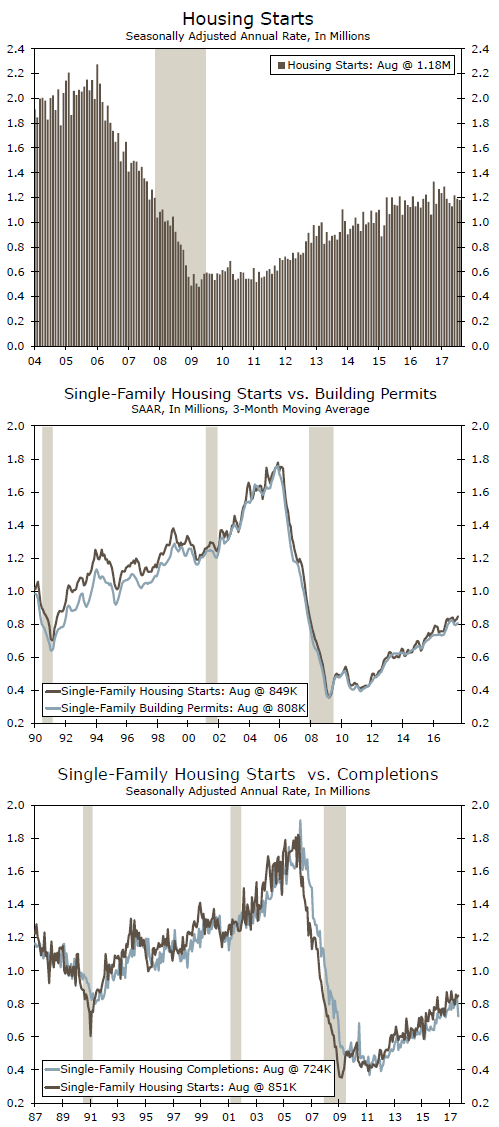
US: Housing Starts Fall Slightly Off An Upwardly Revised Level
Housing starts fell 0.8 percent in August but starts were revised higher for July, leaving starts slightly above the consensus forecast. Permits rose a solid 5.7 percent, with all the gain in multi-family units.
Homebuilding Looked Solid Prior to the Storms
Data for August housing starts were likely only minimally impacted by Hurricane Harvey. The storm hit in the last week of August and may have cut into starts in Houston, which has long been the number one market for single-family starts and also one of the top markets for apartment construction. Overall housing starts fell 0.8 percent, with the entire decline coming in multi-family units, which fell 6.5 percent in August. Most of that drop was in apartments, which have seen a great deal of supply come on the market in many parts of the country, cooling new construction.
Single family starts rose 1.6 percent in August to an 851,000 unit pace and are continuing to trend higher. Data through the first eight months of 2017 show single-family starts running 8.9 percent ahead of their year-ago pace. By contrast, multi-family starts through August are running 9.9 percent below the pace maintained through the first 8 months of 2016.
The monthly housing starts data are reported on a seasonally adjusted annualized basis, meaning the monthly figures reflect how many homes would be built in a year if that month's pace was maintained for the entire year. Single-family starts averaged an 849,000-unit annual rate over the past three months, which is close to the pace averaged this year. We suspect single-family starts are set to slow, however. Permits for new single-family homes have been running at just an 808,000-unit pace for the past three months, or 4.8 percent below single-family starts. Hurricanes Harvey and Irma will also likely slow starts in coming months, as resources are redirected toward repairs and rebuilding efforts. Texas and Florida combined account for about 25 percent of the nation's single-family starts, so any production lost there is likely to weigh heavily on the national data.
While single-family starts appear set to weaken, multi-family starts may be primed for a rebound. Multi-family permits jumped 19.7 percent in August, to a 500,000-unit pace. Permits averaged a 461,000-unit pace over the past three months - a whopping 32.8 percent ahead of multi-family starts.
The number of homes under construction rose 1.3 percent in August to 1.082 million units, on a seasonally-adjusted annualized basis. The number of single-family homes currently being built rose 2.2 percent to 472,000, also on an annualized basis. Multi-family units rose 0.7 percent. The largest increases were in the South and West, which account for more than two-thirds of the homes being built. While the number of homes under construction rose solidly, the number completed fell 10.2 percent, with single-family completions falling a whopping 13.3 percent, or by 111,000 units in August. Hurricane Harvey appears to have held back completions. The bulk of the drop was in the South, which saw single-family completions tumble 20.8 percent in August.
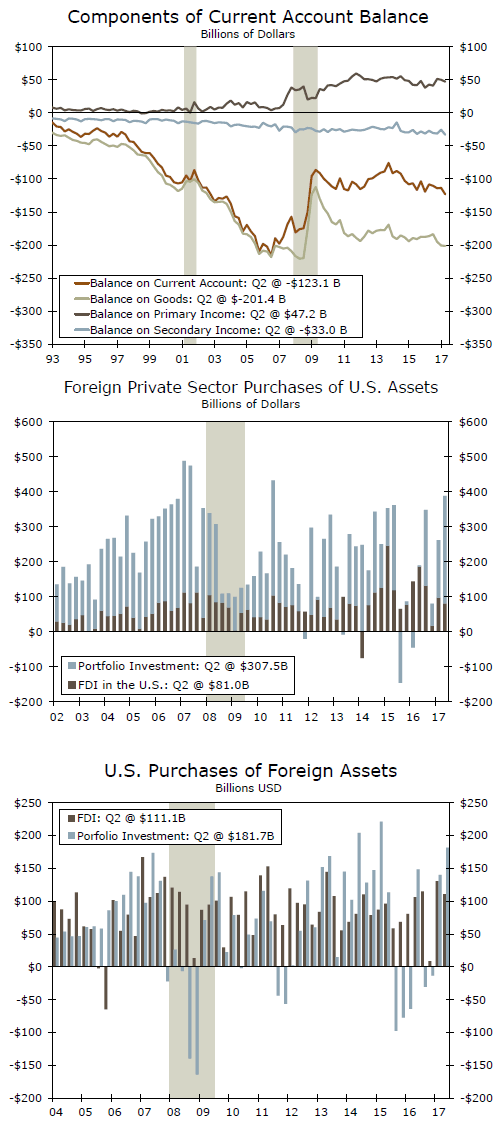
US: Current Account Deficit Rises to 9-Year High in Q2
The current account deficit rose to its highest level in about 9 years in the second quarter, but the country appears to have little difficulty financing this red ink at present.
Most Balances within the Current Account Deteriorated in Q2
The U.S. current account deficit widened from $113.5 billion (revised) in Q1-2017 to $123.1 billion in the second quarter, the most red ink in the overall current account in about 9 years (top chart). There are a few factors that have acted to push the deficit higher in recent quarters. First, the deficit in trade in goods, which was largely stable between 2014 and 2016 due in part to the collapse in petroleum prices, has widened again this year as oil prices have rebounded from their multi-year lows in early 2016. The surplus in the services balance has trended higher in recent quarters, but not enough to prevent the overall current account deficit from widening.
In addition, the overall red ink in the current account grew because the income that Americans earn on their overseas investments did not rise as much as the income that foreigners receive on their U.S. investments. Furthermore, the United States made more transfer payments abroad (e.g., workers' remittances to their families in foreign countries) and received less transfer payments in the second quarter than it did in the first quarter. That said, the current account deficit, which is equivalent to less than 3 percent of GDP at present, is really not that worrying because the United States appears to have little difficulty attracting the net capital inflows that are needed to finance the red ink in the current account.
Net Capital Inflows Remain Buoyant
In that regard, foreign direct investment (FDI) in the United States remained buoyant at $81.0 billion in the second quarter (middle chart). Foreign portfolio investment in the United States was also very strong. Not only did foreign purchases of equity securities total $51.0 billion in Q2, but foreigners also gobbled up $257.0 billion worth of debt securities. Previously released monthly data show that foreign purchases of long-term corporate debt securities were very strong in the second quarter.
Of course, American investors can buy assets abroad, and their FDI purchases totaled about $100 billion in Q2 (bottom chart). They also bought $118 billion worth of foreign stocks, the largest amount in four quarters, but their purchases of foreign debt securities softened a bit in the second quarter. On net, however, more capital flowed into the country in Q2 than flowed out.
As noted above, we do not really worry about the red ink in the current account at present. As a percent of GDP, the current account deficit reached about 6 percent in 2006. It was more challenging for the country to finance its current account deficit a decade ago than it is today. Although we look for the dollar to trend lower in coming quarters as foreign central banks begin to tighten their respective policy stances, we believe U.S. assets will remain attractive to foreign investors, which will prevent a sharp decline in the value of the greenback.
Gold Flirts With the 1300 Key Zone
Gold prices continued to edge lower this week, amid a general risk-on environment. Indeed, major US equity indices continued to post fresh all-time highs this week, while safe haven assets tumbled. A potential explanation is that investors have become somewhat accustomed to the latest missile strikes from North Korea, evident by the muted market reaction after Friday's launch. In our view, as long as this geopolitical risk does not translate into military conflict, market participants may continue to place less and less emphasis on such developments. If seen in isolation, this could imply even lower gold prices in the coming days.
Not so fast though: the near-term path of gold may also depend on any major move in the US dollar. In this respect, we will keep an eye on tomorrow's FOMC decision. We see the case for the Fed to keep its "dot plot" unchanged and signal one more rate hike this year, something that could help the dollar recover somewhat. If so, this would be another factor arguing for the continuation of the recent decline in gold.
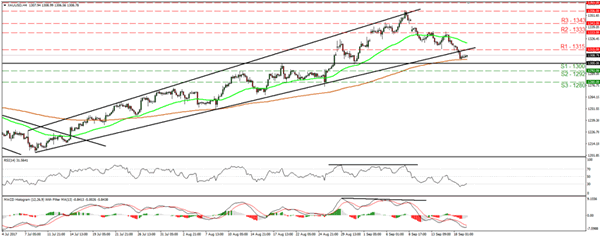
XAU/USD traded lower on Monday, breaking below the support (now turned into resistance) barrier of 1315 (R1) and the short-term uptrend line taken from the low of the 10th of July. Nevertheless, the price continues to trade above the psychological zone of 1300 (S1) and as such, we prefer to stand pat for now. A break below that key territory may trigger a short-term reversal and initially aim for our next support of 1292 (S2).
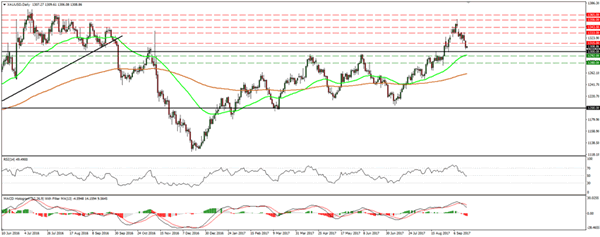
Switching to the daily chart, the fact that the yellow metal is trading above 1300 (S1) leaves the door open for a rebound, and keeps the longer-term outlook somewhat positive. A break below 1300 (S1) will bring the price back within the wide sideways range that had been in place from January until late August, and perhaps signal further declines within that range.
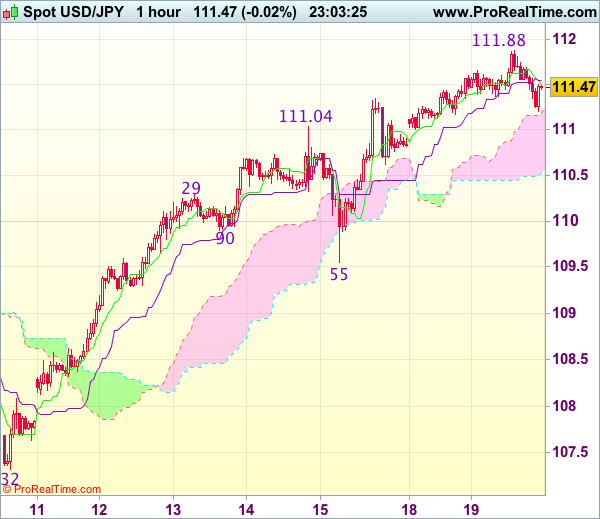
Trade Idea Wrap-up: USD/JPY – Buy at 110.70
USD/JPY - 111.45
Most recent candlesticks pattern : N/A
Trend : Up
Tenkan-Sen level : 111.51
Kijun-Sen level : 111.54
Ichimoku cloud top : 111.19
Ichimoku cloud bottom : 110.52
Original strategy :
Buy at 110.70, Target: 111.70, Stop: 110.35
Position : -
Target : -
Stop : -
New strategy :
Buy at 110.70, Target: 111.70, Stop: 110.35
Position : -
Target : -
Stop : -
As the greenback has retreated after rising to 111.88, suggesting minor consolidation below this level would be seen and pullback to 111.00 cannot be ruled out, however, reckon 110.60-70 would limit downside and bring another rise later, above said resistance would extend recent upmove to 112.00, then 112.20 (previous resistance) but near term overbought condition should prevent sharp move beyond 112.40-45.
In view of this, would not chase this move here and would be prudent to buy dollar on subsequent pullback as 110.60-70 should limit downside. Below the lower Kumo (now at 110.52) would abort and signal a temporary top is formed instead, risk correction to 110.30, then towards 110.00 which is likely to hold from here.