Sample Category Title
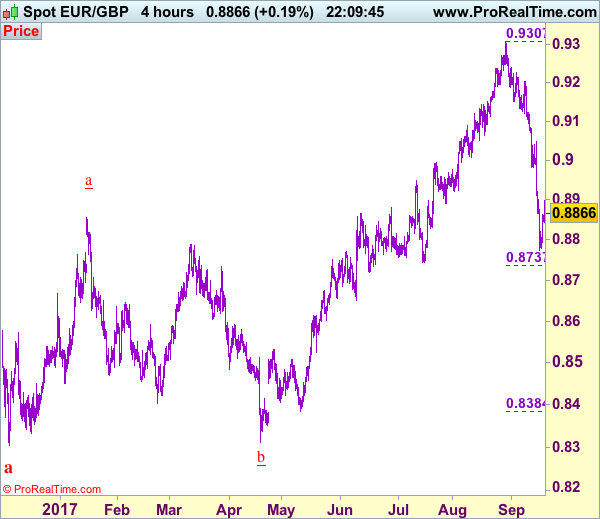
Trade Idea: EUR/GBP – Sell at 0.8955
EUR/GBP - 0.8875
Original strategy :
Sell at 0.8900, Target: 0.8780, Stop: 0.8940
Position : -
Target : -
Stop : -
New strategy :
Sell at 0.8955, Target: 0.8800, Stop: 0.8995
Position : -
Target : -
Stop : -
The single currency has rebounded this week, suggesting further consolidation above last week’s low at 0.8774 would be seen and corrective bounce to 0.8907-10 is likely, however, reckon upside would be limited to resistance at 0.8950-55 and bring another decline later, below 0.8805-10 would bring retest of said support at 0.8774, break there would signal the reversal from 0.9307 top is still in progress and bearishness remains for this fall to extend weakness towards 0.8737-43 (61.8% Fibonacci retracement of 0.8384-0.9307 and previous support) but near term oversold condition should limit downside to 0.8719 support and reckon another previous chart support at 0.8652 would hold.
In view of this, would not chase this fall here and we are looking to sell euro on further recovery as 0.8950-55 should limit upside and bring another decline later. Above previous support at 0.8982 would abort and signal a temporary low has been formed, bring retracement of recent decline to 0.9000 but price should falter below resistance at 0.9048 and bring another selloff next week.
Our preferred count is that, after forming a major top at 0.9805 (wave V), (A)-(B)-(C) correction is unfolding with (A) leg ended at 0.8400 (A: 0.8637, B: 0.9491 and 5-waver C ended at 0.8400. Wave (B) has ended at 0.9413 and impulsive wave (C) has either ended at 0.8067 or may extend one more fall to 0.8000 before prospect of another rally. Current breach of indicated resistance at 0.9043 confirms our view that the (C) leg has ended and bring stronger rebound towards 0.9150/54, then towards 0.9240/50.
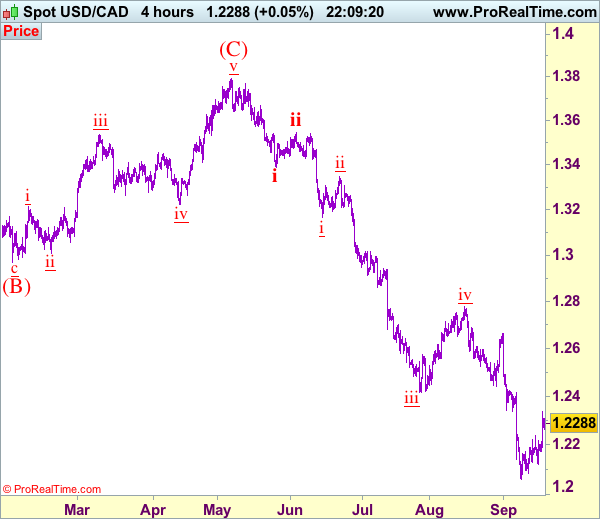
Trade Idea: USD/CAD – Stand aside
USD/CAD - 1.2290
Trend: Down
Original strategy :
Sold at 1.2240, stopped at 1.2240
Position: - Short at 1.2240
Target: -
Stop: - 1.2240
New strategy :
Stand aside
Position: -
Target: -
Stop:-
The greenback has jumped again today and broke above resistance at 1.2240, suggesting a temporary low has possibly been formed at 1.2061 earlier and upside risk remains the rebound from there to bring retracement of recent decline, above 1.2335-40 would bring further gain to 1.2390-00 but reckon resistance at 1.2425-30 would hold from here, bring retreat later.
In view of this, would not chase this rise here and would be prudent to stand aside for now. Below 1.2220-25 would bring weakness to 1.2170-75 but only break of support at 1.2121 would signal the rebound from 1.2061 has ended, bring retest of this level later, break there would extend recent decline has resumed and extend weakness towards psychological support at 1.2000. We are keeping our count that wave v as well as wave (C) ended at 1.3794 and impulsive wave (i ii, i ii) is now unfolding with minor wave iii ended at 1.2414, followed by wave iv correction ended at 1.2778, wave v has reached our indicated downside target at 1.2100 and may extend to 1.2000.
To recap, wave B from 1.3066 is unfolding as an a-b-c and is sub-divided as a: 1.2192, b: 1.2716 and wave c is a 5-waver with i: 1.1983, ii: 1.2506, extended wave iii with minor iii at 1.0206, wave iv ended at 1.0781 and wave v as well as wave iii has ended at 0.9931, hence the subsequent choppy trading is the wave iv which is unfolding as (a)-(b)-(c) with (a) leg of iv ended at 1.0854, followed by (b) leg at 1.0108 and (c) leg as well as the wave iv ended at 1.0674. The wave v is sub-divided by minor wave (i): 0.9980, (ii): 1.0374, (iii): 0.9446, (iv): 0.9913 and (v) as well as v has possibly ended at 0.9407, therefore, consolidation with upside bias is seen for major correction, indicated target at 1.3700 and 1.4000 had been met and further gain to 1.4700 would be seen later.
Canada: Factory Sales Take a Tumble in July
Canadian manufacturing sales fell again in July, down 2.6% month-on-month. While the price of goods sold was down, so too was the volume of goods, which fell 1.4% in July. Data for the prior months was also revised slightly lower with today's release.
Both durable and non-durable goods output fell, but it was the durable goods sector that led the way, down 4.6% on the month. This pullback was down largely due to the transportation equipment sector, which saw output fall 13.8%. Statistics Canada reported that this was the result of summer shutdowns at vehicle assembly plants that were longer and more concentrated in July than is typical. (It is normal for these operations to shut down for retooling, and Statistics Canada's seasonal adjustment attempts to correct for the 'typical' summer shutdown).
Regionally, Ontario (-6.1%) had the largest impact on the headline figure, consistent with the vehicle assembly impacts. However, the remaining provinces saw generally weak performances as well, with only Nova Scotia, Quebec, and Saskatchewan reporting gains in July.
Inventories ticked down just a notch (-0.2%), which was outpaced by the overall decline in sales, leaving the inventory-to-sales ratio at 1.40 in July (from 1.37 in June). Forward looking indicators were not encouraging, as unfilled orders fell for a third month (-1.7%). New orders also saw a decline of (1.7%), driven by the motor vehicle and aerospace industries.
Key Implications
The July manufacturing output data was less than encouraging, to put it mildly. The second month of declines in both value and volumes suggests that momentum may be fading somewhat at Canadian factories. To be sure, with a shift in the shutdown schedule at auto plants contributing significantly to the pullback, a rebound may be in store next month as these assembly lines come back to life. But with the forward-looking indicators down again in July, rebound expectations should be tempered.
Indeed, the weakness of the past few months looks significant enough to impact the overall growth figures. While the overall growth momentum into the third quarter was solid, today's report takes some wind out of the sails, and pushed the tracking a touch lower, to a still above-trend 2.3%.
For the data-dependent Bank of Canada, today's report will not be encouraging, but nor is it likely to hold too much weight. Yesterday's speech by Deputy Governor Tim Lane emphasized the desire to assess how the July and September interest rate increases are affecting the economy. Given the noise of the data and that it likely only partially reflects the first rate increase, we expect that it will be later data that will play a bigger role in their decision making.
Bank of Canada Maintains Somewhat Hawkish Tone, But Watch for Loonie Impacts
Bank of Canada Deputy Governor Time Lane spoke to the Saskatoon Regional Economic Development Authority today. His speech covered the history of Canadian trade, the benefits and challenges of free trade, recent challenges, and the Bank's outlook.
Much of the speech was given over to the development of trade linkages, specialization that has emerged, and the resultant shifts in the structure of the economy.
More interesting was the discussion of export challenges in the post-financial crisis period, and the outlook for the economy more broadly. On the first point, the Bank of Canada continues to dedicate resources to diagnosing export underperformance, including analysis down to the firm level. Lane suggested that part of the story is that expanding market share isn't just a matter of price (and so exchange rates), but can depend on where production will be located within internationally integrated supply chains. These decisions are not made often, and as such Canada has had to rely on other areas, such as household spending, to drive growth.
Regarding the outlook for trade, reasons for optimism were given: freer trade such as via CETA is expected to help, but a shift towards protectionist sentiment and uncertainties around potential changes to NAFTA pose downside risks.
Of the greatest interest to markets are likely Deputy Governor Lane's comments regarding the economic outlook more broadly. His language mirrored that of the September 6th decision, noting that growth is becoming more broadly based and self-sustaining, and that the import mix has become encouraging, pointing to rising business investment. At the same time, the language around the currency was strengthened somewhat, noting that "We will be paying close attention to how the economy responds to both higher interest rates and the stronger Canadian dollar."
Key Implications
After a policy hike that came with no prior communication and a limited statement, all eyes were undoubtedly on Deputy Governor Lane as he delivered the Bank of Canada's first speech since the July interest rate increase. Now that the 'insurance' interest rate cuts of 2015 have been removed, the key question has become when the process of interest rate normalization will get underway, and how quickly it might progress.
In the event, the tone of September's rate hike decision was more or less held. The economic outlook saw a more positive tone, as the discussion of the potential for continued business investment suggests continued breadth in the sources of economic growth. On the flip side, the statement was more explicit regarding the level of the Canadian dollar – rather than acknowledging its strength as in the rate decision, the dollar was discussed alongside higher rates as factors the Bank will be paying close attention to. This was likely meant to temper expectations of future rate hikes that helped drive the loonie up nearly 2 cents against the U.S. dollar after the September 6th decision. Indeed, the currency dropped back roughly half a cent after Lane's remarks were made public.
Ultimately, with GDP growth still tracking well above potential for the second half of the year, conditions are likely to remain supportive of further monetary tightening, and we continue to expect another policy interest rate hike this fall. That said, if recent experience has shown us anything, it is that coming decisions are going to be data-driven. The emphasis on assessing the impact of the July and September hikes suggests that should there be signs of deterioration in the growth outlook, a more dovish stance from the Bank of Canada should be expected – whether telegraphed in a speech or not.
CAC Subdued as Eurozone Posts Mixed Data
The CAC index is almost unchanged in the Tuesday session. Currently, the index is at 5,236.80, up 0.15% on the day. On the release front, eurozone numbers were a mixed bag. The eurozone's current account surplus jumped to EUR 25.1 billion, easily beating the forecast of EUR 22.3 billion. Eurozone ZEW Economic Sentiment improved to 32.4, short of the forecast of 31.7 points.
French President Emmanuel Macron ran on a platform to reform the economy, and the government plans to take a big first step later this week, with a labor reform that will make it easier for employers to hire and dismiss workers. The overhaul comes into effect on Sep. 22, but France's largest unions have pledged to fight the move tooth-and-nail. A mass demonstration brought more than 200,000 to the streets, and another demonstration is scheduled for September 23. The government has promised further reforms to the country's generous benefits system, specifically unemployment benefits and pensions. In the past, strikes and demonstrations by unions have managed to stave off major reforms. However, the government appears determined to move full speed ahead, and the markets will be watching closely to see who prevails in this round, the unions or the government.
The eurozone economy has rebounded in 2017, and much of the credit goes to Germany, the largest economy in the bloc. At the same time, inflation levels have been stubbornly low. This has complicated the ECB's plans to reduce its quantitative easing scheme (QE), although ECB President Mario Draghi has said that the ECB will announce its plans to reduce QE at the October policy meeting. QE is scheduled to end in December, and policymakers will have to balance opposing interests as to what happens next. Germany, with its robust economy, would like to remove stimulus entirely, while less affluent eurozone members want to retain an accommodative monetary policy. We're likely to see some compromise, in which stimulus is extended into 2018, but will be tapered from its current level of EUR 60 billion/month.
Lower Auto Sales Weighed on July Canada Manufacturing Sales
Highlights:
- Manufacturing sales fell 2.6% in July — larger than the ~1 1/2% drop expected ahead of the report.
- Weakness was concentrated in an outsized 17% drop in motor vehicle and parts sales — related to summer shutdowns — and a 1.2% drop in prices.
- Sale volumes fell 1.4% overall but increased about a percent excluding the auto component.
- We continue to expect GDP growth slowed in the third quarter, but to a still 'above-potential' 2.5% rate.
Our Take:
Canadian manufacturing sales declined a larger-than-expected 2.6% in July but with underlying details that were arguably firmer than expected. The pullback in nominal sales was entirely due to an outsized pullback in motor vehicle sales and lower prices. Auto sales in the U.S. — where most Canadian-made vehicles are sold — have been lower but the 17% drop in manufacturing sales of motor vehicle and parts in July probably had more to do with difficulties seasonally adjusting the data around longer-than-usual summer retooling shutdowns in the sector that were flagged earlier in the export data. Excluding the motor vehicle and parts components, sales rose 0.2% in July and increased about a percent in volume terms.
Risks around the outlook remain, in particular uncertainty about the outcome of NAFTA negotiations and the potential impact of a stronger Canadian dollar on activity in export-intensive sectors like manufacturing. We expect growth in the economy will ultimately remain strong enough to prompt further Bank of Canada rate hikes but with the potential for headwinds to emerge going forward still arguing for a gradual pace.
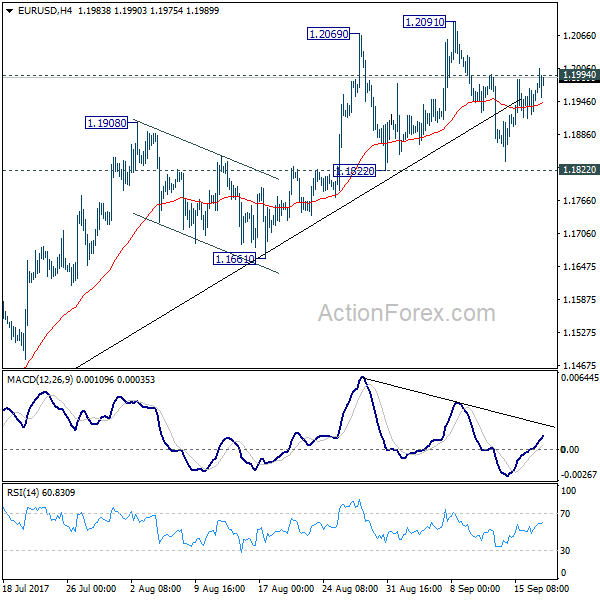
EUR/USD Mid-Day Outlook
Daily Pivots: (S1) 1.1922; (P) 1.1945 (R1) 1.1977; More...
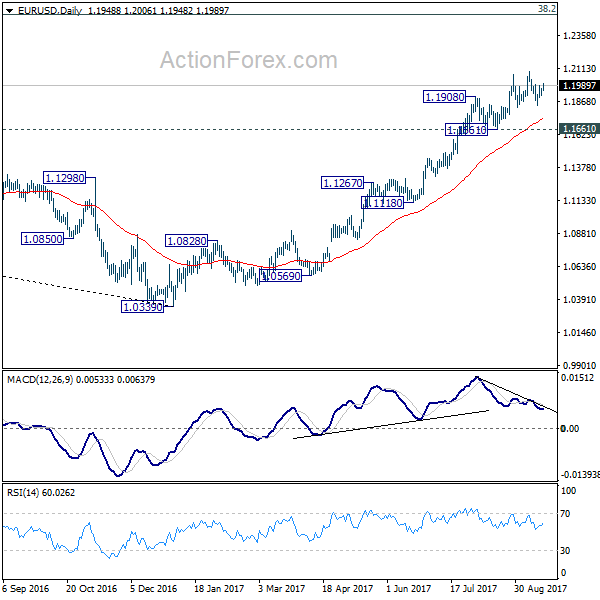
Breach of 1.1994 minor resistance argues that pull back from 1.2091 has completed. Intraday bias is turned to the upside for 1.2091 first. Break will extend larger rise from 1.0339 and target next key fibonacci level at 1.2516. In any case, outlook will remain bullish as long as 1.1822 support holds. But considering bearish divergence condition in 4 hour MACD, break of 1.1822 will confirm short term topping and bring deeper fall back to 1.1661 support and below.
In the bigger picture, rise from medium term bottom at 1.0339 is still in progress for 38.2% retracement of 1.6039 (2008 high) to 1.0339 (2017 low) at 1.2516. However, it should be noted that there is no confirmation of trend reversal yet. That is, such rebound from 1.0399 could be a correction. And the long term fall fro 1.6039 (2008 high) could resume. Hence, we'd be cautious on strong resistance from 1.2516 to limit upside. But after all, break of 1.1661 is needed to indicate medium term topping. Otherwise, outlook will remain bullish in case of pull back.
Trade Idea Update: USD/CHF – Hold short entered at 0.9625
USD/CHF - 0.9613
Original strategy :
Sold at 0.9625, Target: 0.9525, Stop: 0.9660
Position : - Short at 0.9625
Target : - 0.9525
Stop : - 0.9660
New strategy :
Hold short entered at 0.9625, Target: 0.9525, Stop: 0.9650
Position : - Short at 0.9625
Target : - 0.9525
Stop : - 0.9650
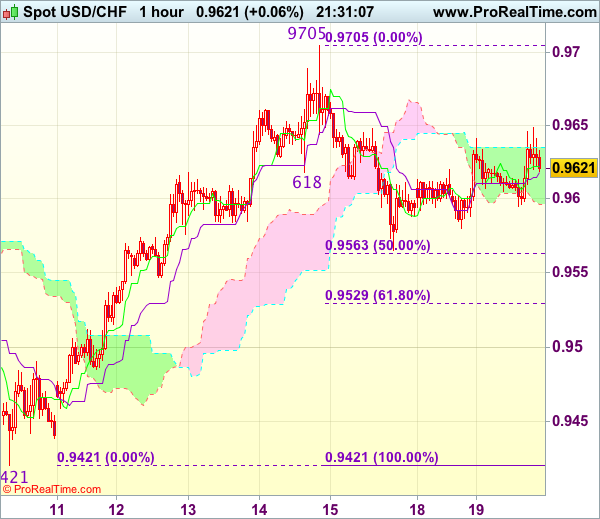
Although the greenback rebounded again in European morning, as price has retreated again after meeting resistance at 0.9649, retaining our bearishness and as long as this level holds, mild downside bias remains for another fall towards 0.9563-65 (50% Fibonacci retracement of 0.9421-0.9705 and Friday’s low), break there would add credence to our view that top has been formed at 0.9705, bring further weakness to 0.9525-30 (61.8% Fibonacci retracement), however, downside should be limited to 0.9500 and 0.9480-85 should hold from here.
In view of this, we are holding on to our short position entered at 0.9625. Above 0.9649 would defer and risk rebound to 0.9675-80, break there would signal the pullback from 0.9705 has ended, bring retest of this level, a breach of this last week’s high would extend recent rise from 0.9421 to 0.9740-50 later.
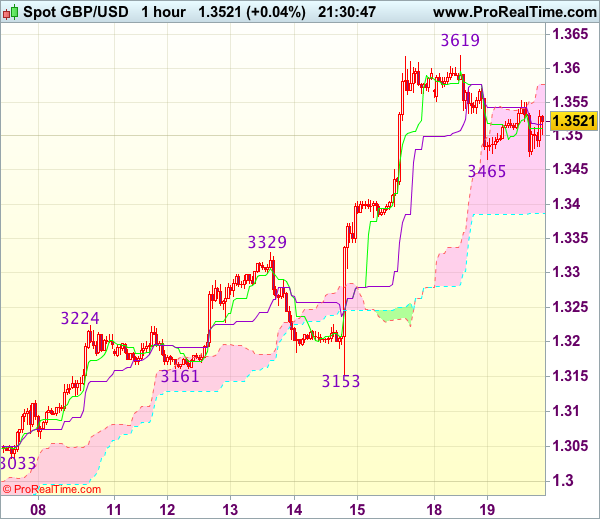
GBP/USD Mid-Day Outlook
Daily Pivots: (S1) 1.3435; (P) 1.3526; (R1) 1.3589; More....
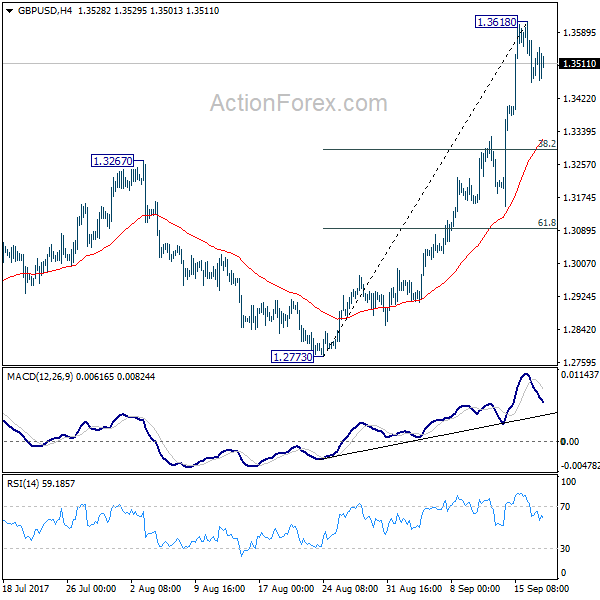
Intraday bias in GBP/USD remains neutral for consolidation below 1.3618 temporary top. Downside of retreat should be contained by 38.2% retracement of 1.2773 to 1.3618 at 1.3295 and bring rise resumption. Above 1.3618 will turn bias back to the upside for 1.3835 support turned resistance next. Break there will target 55 month EMA (now at 1.4405).
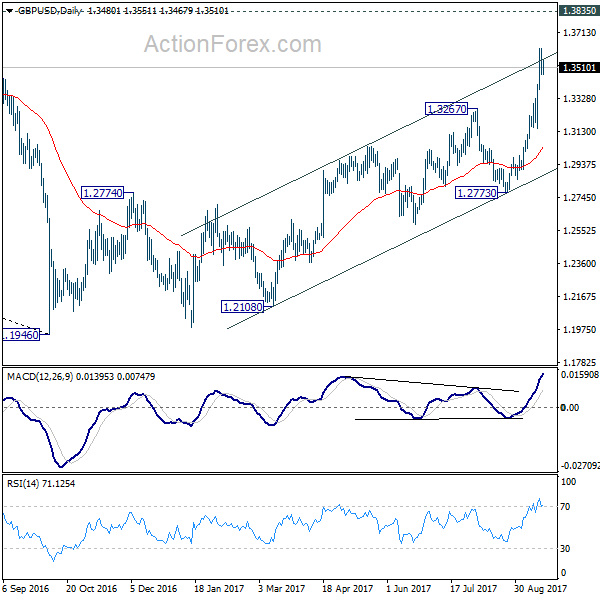
In the bigger picture, the strong break of 1.3444 key resistance now argues that the long term trend in GBP/USD has reversed. That is a key bottom was formed back in 1.1946 on bullish convergence condition in monthly MACD. Current rise from 1.1946 will target 38.2% retracement of 2.1161 (2007 high) to 1.1946 (2016 low) at 1.5466 next. In any case, medium term outlook will now stay bullish as long as 1.2773 support holds.
Trade Idea Update: GBP/USD – Buy at 1.3400
GBP/USD - 1.3513
Original strategy :
Buy at 1.3400, Target: 1.3560, Stop: 1.3365
Position : -
Target : -
Stop : -
New strategy :
Buy at 1.3400, Target: 1.3560, Stop: 1.3365
Position : -
Target : -
Stop : -
Although cable found support at 1.3465 and has recovered, reckon upside would be limited to 1.3570 and risk of another corrective fall remains, below 1.3500 would bring test of said support at 1.3465, then 1.3430 but reckon 1.3400 would attract renewed buying interest, bring another rise later, above 1.3570 would signal the pullback from 1.3619 (yesterday’s high) has ended, bring retest of this level, then 1.3650.
In view of this, would not chase this rise here and would be prudent to buy cable on subsequent pullback as 1.3400-10 should limit downside. Only below the lower Kumo (now at 1.3385) would defer and signal a temporary top is formed, bring retracement of recent rise to 1.3350, then 1.3320-25 but 1.3300 should remain intact.