
Sample Category Title
The Waiting Game
Markets have reached a crossroad and dealers are sitting tight ahead of FOMC. It seems like a typical pre FOMC week with low currency volatility, as US Yields are staying within range.
However, equity markets continue to reach higher ignoring possible Fed monetary policy implications as investors remain focused on US tax reform. But with stock markets at an all-time high, it remains puzzling why investors are not showing a greater level of caution into what should be a very significant call for the Feds. Of course, we must respect price action, but from my chair, risks are near level for a hawkish tilt from the FOMC, even more so if they decide to overlook months of weak inflation data after the essential CPI inflation gauge readings finally broke the previous string of five consecutive downside surprise.
It would not be so far-fetched the Feds come out firing on all cylinders and pave the way for a December rate hike.
Trump headlines from the UN General Assembly provided some curious soundbites, but little market reaction.
The waiting game has set in as FX markets continue to debate the concerning pace of monetary policy normalisation ahead of the key FOMC with the greenback looking for a new narrative.
Japanese Yen
USDJPY remains supported on the on the increasing possibility of a Japanese general election. With Abe cementing his lead in the polls and with the opposition in disarray, an Abe win all but guarantees extended Abenomics and a weaker JPY.
Euro
As expected the G-10 traders have respected the 1.1900 -1.2000 ranges as the EURUSD more or less remains mired in pre FOMC position squaring
Dollar Lower Ahead of Fed Statement
Fed meeting keeping markets in suspense
The US dollar was weaker on Tuesday almost 24 hours ahead of the release of the Federal Open Market Committee (FOMC) rate statement. The biggest question will not be on interest rates as they are expected to remain unchanged, but on the details of the Fed's plan to reduce its bond holdings. North Korea was once again in the news when US President Trump spoke to the UN and condemned the regime that is leaving him no choice but to destroy the Asian nation.
The U.S. Federal Reserve will publish its rate statement on Wednesday, September 20 at 2:00 pm EDT. The US central bank is not expected to hike interest rates at this time, but is anticipated to announce the start of its balance sheet reduction initiative. The Fed will also release its updated economic projections and there will be a press conference with Fed Chair Janet Yellen at 2:30 pm EDT.
The Bank of Japan (BOJ) will publish its monetary policy statement on Wednesday, September 20 at 11:50 pm EDT with a press conference to follow on Thursday at 2:30 am EDT. The Japanese central is not expected to make a change to its monetary policy as inflation remains stubbornly low despite unprecedented stimulus by the BOJ. Growth has continued its upward trend but with little help from inflationary pressures no reduction is stimulus is in the horizon.
The EUR/USD gained 0.326 percent in the last 24 hours. The single currency is trading at 1.1995 after touching daily highs of 1.2007 prompting the European Central Bank (ECB) to release a disagreement between policymakers about the end date of the quantitive easing (QE). The euro received a boost form the latest ZEW survey of economic sentiment. The German survey rose ahead of this weekend's elections in a sign of stability, helping the single currency move forward against the USD.
Angela Merkel is on track to remain Germany's Chancellor despite an increase in challengers. Merkel's party the Christian Democrats are expected to win, but the question will be which party they will form a coalition to rule. Economic growth in Europe has fuelled optimism, but inflation remains low causing a headache for the ECB as it cannot fully commit to removing stimulus with deflation risks still present.
The Fed was able to remove stimulus in a gradual manner and has now hiked twice in 2017. The USD has received some of the benefits from a tightening economic policy, but political uncertainty has impaired the greenback. Another factor to look for in tomorrow's statement and press conference is any hint of a December rate hike. The market had cooled on a final rate raise this year, but is now estimating the probability at higher than 50 percent.
Canadian Dollar Higher Ahead of Fed Meeting
The Canadian dollar appreciated on Tuesday after losing traction at the beginning of the week as Bank of Canada (BoC) Deputy Governor Lane said the strength of the loonie would be a factor of monetary policy decisions. The CAD appreciated after the surprise rate hike in early September. The central bank did not signal its intention to hike but markets had it at least 50 percent, with the more likely candidate being October. The closing gap between US and Canadian rates boosted the loonie and a growth outperformed forecasts in Canada a third rate hike that would take the benchmark rate to 1.25 percent is not out of the question.
Canadian manufacturing sales dropped 2.6 percent in July with auto playing a big part. Plant shutdowns took total sales above the expectation of a 1.6 drop. Sales fell in 57 percent of manufacturers with a reduction in volume by 1.4 percent.
Canada posted a 14.5 budget deficit which improved on the preliminary numbers reported in May. The loonie was able to gain versus the US dollar ahead of the publication of the Fed's rate statement tomorrow at 2:00 pm EDT. The Fed is expected to announce the details of its balance sheet reduction plans. The US central bank ammased a large portfolio of bond holdings as part of its QE program. The tapering of the program as well as rate hikes showed a tightening monetary policy, which will now include removing those bonds on a gradual basis.
usdcad Canadian dollar graph, September 19, 2017
The USD/CAD fell 0.214 percent on Tuesday. The currency pair is trading at 1.2272 after the dollar lost some momentum ahead of the release of the Fed statement on Wednesday. The US central bank economic projections will also be released along with a press conference at 2:30 pm EDT with Fed Chair Janet Yellen.
The Fed was able to remove stimulus in a gradual manner and has now hiked twice in 2017. The USD has received some of the benefits from a tightening economic policy, but political uncertainty has impaired the greenback. Another factor to look for in tomorrow's statement and press conference is any hint of a December rate hike. The market had cooled on a final rate raise this year, but is now estimating the probability at higher than 50 percent.
West Texas Intermediate graph
US energy dropped 0.671 percent in the last 24 hours. The price of West Texas Intermediate is trading at 50.32 ahead of Wednesday's US inventory data. Tropical storms have disrupted the US refinery and crude platforms but are now getting slowly back online. The other major factor this week has been rumours of the Organization of the Petroleum Exporting Countries (OPEC) seeking an extension to the production cut agreement made with other major producers. The agreement has already been extended once and will end in March, but there is talk it could be in place for all of 2018.
Federal Government Posts Smaller-than-Expected Deficit in 2016/17
Our Take:
A better-than-expected bottom line in fiscal year 2016/17, as released by the Department of Finance this morning, alongside surprisingly strong economic growth in Canada suggests there is scope for the government to beat its target again in the current 2017/18 fiscal year. The posted shortfall of $17.8 billion in 2016/17 came in well below the earlier budget estimate of $23.0 billion and was led by modestly lower expenditure growth and a smaller dip in total revenues than had been projected in the budget.
Over the twelve months ending March 2017, the government was on track to post a deficit of nearly $22 billion for the 2016/17 fiscal year. The inclusion of final year revenue and expenditure adjustments (commonly referred to as the 13th month) can swing the final balance in either direction. In the event, these adjustments this year saw the overall figure improve to below $18 billion, providing upside risk for a better-than-expected outcome in 2017/18 and possibly throughout the projection period should this realized improvement be carried forward into the coming years.
The potential for a $5 billion 'cushion' to reduce the projected $28.5 billion shortfall in 2017/18 is further enhanced by the surprisingly robust economic growth environment. Canadian economic growth in 2017 is surpassing earlier growth estimates, those which underpinned the fiscal projections in the March budget. RBC's forecast for 2017 nominal GDP growth, the broadest indicator of the tax base, is 5.5% and well above the consensus estimate of 4.1% back in the spring. This alone implies an overall $6 billion lift to the government's bottom line in 2017/18. The inclusion of a $3 billion adjustment for risk provides a further boost as this is unlikely to be needed given the current growth environment. All in, there is scope for the 2017/18 budget shortfall to come in below $15 billion. Whether or not this materializes remains to be seen, however, with the government potentially opting to broadly maintain the current deficit profile and boost expenditures. They have scope to do this so long as they maintain their commitment to seeing the revised fiscal anchor—the debt to GDP measure— decline modestly through the projection period relative to the lower starting point for fiscal 2016/17 of 31.2% (was 31.5%).
Gold Prices Unchanged, Markets Eye FOMC Statement
Gold is almost unchanged in the Tuesday session. In North American trade, the spot price for an ounce of gold is $1306.13, down 0.04%. In economic news, housing data was positive. Building Permits jumped to 1.30 million, well above the forecast of 1.22 million. Housing Starts improved to 1.18 million, edging above the forecast of 1.17 million. On Wednesday, the US Federal Reserve will wind up its policy meeting and release a rate statement.
What can we expect from the Federal Reserve on Wednesday? There is virtually no chance that the benchmark rate of 1.25% will change, so the markets are focusing on the Fed's bloated balance sheet, which currently stands at $4.2 trillion. Earlier in the year, the Fed outlined plans to reduce the balance sheet by not replacing some maturing bonds, starting at $10 billion/month, and gradually moving higher. This move can be viewed as a mini-rate hike, and could provide a boost for the US dollar against its major rivals. The markets will also be keeping a close eye on the tone of the rate statement, as an optimistic view of the US economy could boost the greenback. Will the Fed provide any hints about one last rate hike in 2017? The Fed is still debating whether it will raise rates in December, as persistently low inflation has hampered plans for a third rate hike in 2017. However, the odds of a December increase have been moving higher in September, and are currently at 56%.
US consumer spending has been a sore spot in a generally strong economy, and there was more disappointing news on Friday, as August retail sales reports missed expectations. Core Retail Sales slowed to 0.2%, missing the forecast of 0.5%. Retail Sales was even worse, posting a decline of 0.2%, compared to the estimate of +0.1%. Much of the slowdown in the August numbers are attributable to lower automobile sales, which have been slowing in recent months, and was likely made worse by Hurricane Harvey. These numbers underscore continuing weakness in consumer spending, despite a strong labor market. The Federal Reserve remains concerned about weak consumer spending, a key driver of economic growth, and could make reference to the lack of spending in its rate statement.
Pound Subdued, UK Retail Sales Next
The British pound has posted small gains in the Tuesday session. In North American trade, GBP/USD is trading at 1.3484, down 0.08% on the day. On the release front, the sole UK indicator was the 30-y bond yield. Over in the US, housing data was positive. Building Permits jumped to 1.30 million, well above the forecast of 1.22 million. Housing Starts improved to 1.18 million, edging above the forecast of 1.17 million. On Wednesday, the UK releases Retail Sales and the US Federal Reserve will wind up its policy meeting and release a rate statement.
Bank of England Governor Mark Carney has made no secret of his grave concerns over Brexit, and he reiterated these worries on Monday at a speech at the International Monetary Fund in Washington. Carney said that Britain's loss of its trade relationship with the European Union would push inflation higher and slow growth, and labeled Brexit as "an example of de-globalisation, not globalisation." Pro-Brexit supporters have been unhappy with Carney's stance on Brexit, arguing that high inflation in the UK is a result of the BoE's stimulus program and ultra- low interest rate policy, rather than Brexit. Carney also hinted at a rate hike, saying that monetary policy "would have to move". The pound jumped 3.0% last week, after the minutes of the BoE's policy meeting strongly hinted at a rate hike before the end of the year. This has led to speculation that the BoE could raise rates for the first time in a decade at the November 2 policy meeting.
The Federal Reserve will be front row and center on Wednesday. There is virtually no chance that the benchmark rate of 1.25% will change, so the markets are focusing on the Fed's bloated balance sheet, which currently stands at $4.2 trillion. Earlier in the year, the Fed outlined plans to reduce the balance sheet by not replacing some maturing bonds, starting at $10 billion/month, and gradually moving higher. This move can be viewed as a mini-rate hike, and could provide a boost for the US dollar against its major rivals. The markets will also be keeping a close eye on the tone of the rate statement, as an optimistic view of the US economy could boost the greenback. Will the Fed provide any hints about one last rate hike in 2017? The Fed is still debating whether it will raise rates in December, as persistently low inflation has hampered plans for a third rate hike in 2017. However, the odds of a December increase have been moving higher in September, and are currently at 56%.
USD/JPY Touches 7-Week High Ahead of Fed, BoJ Rate Statements
USD/JPY has ticked higher in Wednesday trade, after gains in the Tuesday session. In the North American session, the pair is trading at 111.43, down 0.12%. The yen remains under pressure, and touched a high of 111.88 earlier on Tuesday, its highest level since July 26. On the release front, US housing data was positive. Building Permits jumped to 1.30 million, well above the forecast of 1.22 million. Housing Starts improved to 1.18 million, edging above the forecast of 1.17 million. Later in the day, Japan releases Trade Balance, with the surplus expected to rise to JPY 0.41 trillion. On Wednesday, central banks will be in focus, as the Federal Reserve and the Bank of Japan publish rate statements.
Is Japan headed to the polls? There were reports on Tuesday that Prime Minister Shinzo Abe may call a snap election next week, with the vote to be held on October 22. Abe has seen his ratings improve over the North Korean crisis and a fragmented opposition. Japan's radical stimulus program, known as 'Abenomics' has failed to push inflation levels anywhere near the BoJ's target of just below 2.0%. Still, stronger global growth as seen the economy improve in 2017, and Abe is gambling that the time is right to seek a fourth mandate. The Bank of Japan releases a rate statement on Wednesday, and a hawkish message from the BoJ could send the yen to higher ground.
The Federal Reserve will be back in the spotlight on Wednesday. There is virtually no chance that the benchmark rate of 1.25% will change, so the markets are focusing on the Fed's bloated balance sheet, which currently stands at $4.2 trillion. Earlier in the year, the Fed outlined plans to reduce the balance sheet by not replacing some maturing bonds, starting at $10 billion/month, and gradually moving higher. This move can be viewed as a mini-rate hike, and could provide a boost for the US dollar against major rivals, such as the euro. The Fed is still debating whether it will raise rates in December, as persistently low inflation has hampered plans for a third rate hike in 2017. However, the odds of a December increase have been moving higher in September, and are currently at 56%.
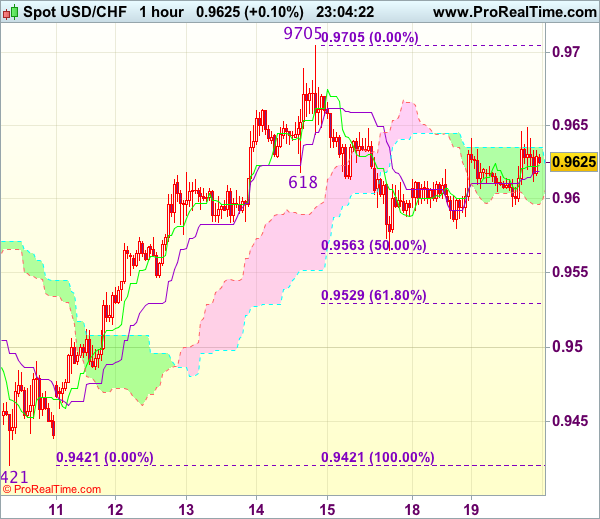
Trade Idea Wrap-up: USD/CHF – Hold short entered at 0.9625
USD/CHF - 0.9636
Most recent candlesticks pattern : N/A
Trend : Near term up
Tenkan-Sen level : 0.9623
Kijun-Sen level : 0.9619
Ichimoku cloud top : 0.9635
Ichimoku cloud bottom : 0.9596
Original strategy :
Sold at 0.9625, Target: 0.9525, Stop: 0.9660
Position : - Short at 0.9625
Target : - 0.9525
Stop : - 0.9660
New strategy :
Hold short entered at 0.9625, Target: 0.9525, Stop: 0.9650
Position : - Short at 0.9625
Target : - 0.9525
Stop : - 0.9650
Although the greenback rebounded again in European morning, as price has retreated again after meeting resistance at 0.9649, retaining our bearishness and as long as this level holds, mild downside bias remains for another fall towards 0.9563-65 (50% Fibonacci retracement of 0.9421-0.9705 and Friday’s low), break there would add credence to our view that top has been formed at 0.9705, bring further weakness to 0.9525-30 (61.8% Fibonacci retracement), however, downside should be limited to 0.9500 and 0.9480-85 should hold from here.
In view of this, we are holding on to our short position entered at 0.9625. Above 0.9649 would defer and risk rebound to 0.9675-80, break there would signal the pullback from 0.9705 has ended, bring retest of this level, a breach of this last week’s high would extend recent rise from 0.9421 to 0.9740-50 later.
New Zealand Election: Change in Government is NZD-Negative in Near-Term
The upcoming New Zealand election would be a tight race between the incumbent National Party and Labor Party. Polls of polls compiled by both RNZ and Stuff indicate that supports for both parties are at around 40%. Moreover, opinion polls have been suggesting that neither of the parties would be able to a government without forming coalition with smaller parties. This is such uncertainty that has increased the volatility of New Zealand dollar of late. This report compares the impacts of various scenarios on the economic growth outlook and the monetary policy, hence the exchange rate. We believe that maintain the status quo - a minority government led by Nationals- would be the most NZD-favorable, while a Labor + Green+ NZ First trio would lead to an immediate, but short-term selloff in the currency.
Nationals + other small parties
The National Party has been in office since 2008. Winning 60 seats, (61 is required to form a majority government, in the last election in 2014, Nationals entered confidence and supply agreements with a number of parties including United Future, ACT and Māori. The situation replicated that of the 2011 election, when Nationals got 58 seats, 2 seats short of a majority. Therefore, this scenario signals continuation of the status quo and should be the most favorable for New Zealand dollar with the least political uncertainties.
On the policy front, a centre-right National party favors maintaining free and open markets for labor and capitals. It proposes tax reduction and less fiscal spending than Labors. This should be positive for investments, and hence GDP growth.
On housing market, the National Party proposes a NZ$1B Housing Infrastructure Fund to "accelerate new housing in the high-demand areas where it's needed most". The new fund will "focus squarely on financing infrastructure like roads and water needed to support new housing". It also seeks to continue with the first home buyer grants.
Nationals + NZ First
The populist NZ First Party had experiences of forming governments with both Nationals (1996 to 1998) and Labors (2005 to 2008). Its leader Winston Peters has noted that he would work with the largest party. The latest result from Newshub'sReid Research suggests that supports for Nationals rose to 47.3%, leading Labors' 37.6%. NZ First would likely ally with Nationals if that's the case.
NZ First is closer to Nationals on social policies but closer to Labors on economic policies. Contrary to Nationals, NZ First proposes to limit foreign investments, revise current FTA deals to "make sure they are real and are in our interests (such as protection of land and strategic assets) and "renegotiate existing poor-quality deals to increase their quality and benefit".
While emplacing the quality of immigrants, Nationals have not proposed a cut in the net immigration per year. However, NZ First favors the most restrictive immigration policy amongst all parties. It proposes to attract highly-skilled migrants by sharply cutting numbers to around 10K per annum, from the current 72K. It also proposes to adopt strict control over immigration under "family reunion" and "make sure that Kiwi workers are at the front of the job queue".
On the housing market, besides subsidies, NZ First "initiates the New Zealand Housing Plan to revamp the New Zealand housing market covering housing availability and affordability as well as rental homes supply and affordability". Indeed, NZ First's proposal to reduce net immigration would pressure housing prices.
NZ First requests to reform the Reserve Bank Act, aiming at achieving a "more exporter-friendly" RBNZ and "sensible exchange rate regime". This implies lower exchange rate and a more accommodative monetary policy.
Reduction in net immigration should weigh on economic growth over coming years. Lower housing prices suggest that the RBNZ would have more room to leave interest rates low for a long period of time, if needed. Together with the proposed central bank reform, NZ First's platform should be negative for New Zealand dollar. However, it is unlikely all of its plans would be taken in such a coalition government. Therefore, the actual impacts on exchange rate would depend on how many, and to what extent, of its policies are adopted.
Labor + Green/ Labor + Green+ NZ First
The centre-left Labor Party and the left-wing Green Party are natural coalition partners. The latest Colmar Brunton polls suggest that Labor (44%) and Green (7%) are capable of forming a government without NZ First. Poll of polls, however, indicated that it is only possible for Labor to lead with this trio. We believe the scenario of Labor + Green+ NZ First would create the most changes and uncertainties. This should pose the most downside risks to New Zealand dollar in the near term
The Labor Party proposes to increase fiscal spending, mainly on health and education. On tax, it proposes capital gains tax on rental properties resold within five years (currently two), while the Green Party opts for a capital gains tax on rental properties. However, NZ First does not favor such taxes.
On the housing market, Labor's KiwiBuild program will build 100K "high quality, affordable homes over 10 years, with 50% of them in Auckland". It would also create an Affordable Housing Authority to fast-track development. We believe these do not contract the housing platforms of the other two parties.
While labors support limiting immigrants, its proposed reduction of net immigration to around 30K per year is less aggressive than NZ First's 10K per year. At an interview with Newshub, Greens also admitted that net migration would likely fall under their policy, which aims for a "sustainable net migration flow to limit effects on our environment, society and culture". The party emphasized that the policy "is not on picking a number or target" but on ensuring "good services, houses and support for people who want to make New Zealand their home". As such, a government with Labors should including a policy of immigration reduction, which is expected to shrink GDP growth in the long-term.
Same as NZ First, both Labors and Greens support reforms of the Reserve Bank Act. Back by the Greens, Labors propose a move to committee-based decision making and a dual mandate that includes employment (price stability already exists) in RBNZ's monetary policy setting. Don Brash, the RBNZ governor in 1989, warned that the change to dual mandate might "lead to some loss of confidence in the New Zealand dollar". Indeed, a dual-mandate would mark one of the biggest changes for the RBNZ. Depending how the mandate is formulated, a full employment mandate, together with the current 1-3% inflation target, would theoretically lead to looser monetary policy, or a slower pace of rate hike. As such, the scenario would result in a RBNZ reform that would skew the risk of the monetary policy to an easy side.
A government led by the National Party would be the most favorable for New Zealand dollar, as this signals less uncertainty, more open economic policy and less change in the RBNZ. A Labor-led government, with its immigration and housing market policies, as well as the proposed reform on the central bank, would weigh on New Zealand dollar. The magnitude of impacts would even increase with NZ First joining the coalition.
Dollar Retreats ahead of Fed Announcement Tomorrow
The US dollar posted modest losses during today's session as traders were fixated on tomorrow's announcement by the Federal Reserve.
The dollar made its highs towards the end of today's Asian session, but lost ground after that. Dollar/yen, in particular, saw significant profit-taking after the substantial gains of the previous days. From 111.83 the pair fell to as low as 111.23, rebounding to 111.40. Euro/dollar also peaked above 1.20 earlier in the day but was not far from that level at 1.1978. The pound was trying to hold on to the 1.35 mark against the greenback at 1.3498.
The Fed was foremost in the mind of traders as the central bank of the largest economy in the world was expected to announce the starting date of the scheduled reduction of its $4.5 trillion balance sheet of Treasury and mortgage-backed securities. The planned reduction would proceed and build up at a very slow pace so as not to cause a disruption in the markets or a sudden spike in bond yields. No change in interest rates was expected from the Fed, but some hints as to the chances of another hike this year as well as an update of the terminal rate when the hiking process finishes, are expected.
In today's economic news, the German ZEW investor survey painted an upbeat picture ahead of the German federal elections during the weekend. The ZEW did not help the euro to rally much, as the market seems to need a significant catalyst to push the single currency above 1.20 versus the dollar and make a run for 1.21. There was a Reuters report that temporarily hurt the euro as sources said the ECB would refrain from setting an end date to the asset purchase program during its October meeting, in order to keep the option of extending its QE program's duration if necessary.
In other economic news, there were a few key releases from the United States. August housing starts fell from the upwardly revised July number but managed to beat expectations, while building permits powered ahead to a 1.3 million annualized pace during the same month. Building permits jumped 5.7% on the month. The US current account deficit remained a source of weakness for the dollar during the second quarter as it worsened to 123.1 billion dollars (from a deficit of 113.5 billion during the previous quarter). Finally, both export prices and import prices increased by 0.6% during August compared to the previous month.
In other currencies, the New Zealand dollar performed strongly on Tuesday while the Global Dairy Trade (GDT) price index came in with an increase of 0.9% compared to the previous reference price 2 weeks ago. Kiwi traders are eagerly anticipating the result of New Zealand's elections during the weekend.
A speech by President Trump before the UN General Assembly did not move markets much as it mainly seemed to be a repeat of previous foreign policy arguments.
Finally in commodities, gold rebounded a touch to $1309 an ounce, while oil enjoyed a strong rally from Monday's lows and scaled the $50 a barrel level (WTI US futures) to $50.12.