Sample Category Title
GBP/USD Elliott Wave Analysis
GBP/USD – 1.3491
Sterling did rallied again after brief pullback to 1.3153 (we recommended in our previous update to buy at 1.3165 and a long position was entered), the subsequently surged to as high as 1.3619 (our upside target at 1.3365 was met basically on the same day with 200 points), this anticipated move adds credence to our bullish view that the medium term erratic rise from 1.1986 low has resumed and upside bias remains for this move to extend further gain to 1.3650-55 (100% projection of 1.1986-1.3048 measuring from 1.2589) and 1.3700-10, however, overbought condition should limit upside to 1.3800 and price should falter well below 1.3955-60 (50% Fibonacci retracement of intermediate downtrend from 1.5930-1.1986).
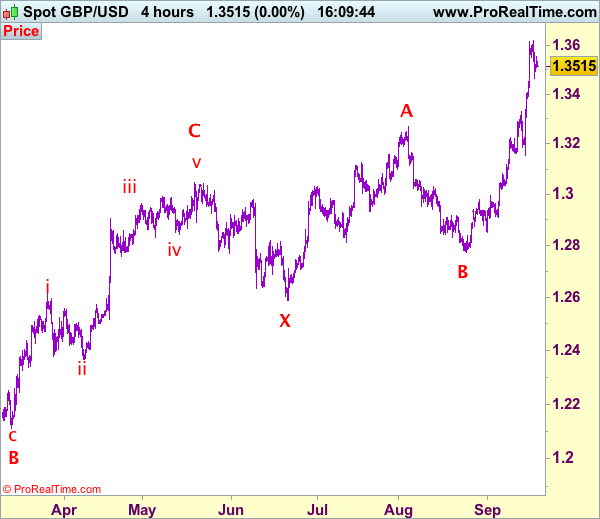
Our preferred count on the daily chart is that cable's rebound from 1.3500 (wave (A) trough) is unfolding as a wave (B) with A ended at 1.7043, followed by triangle wave B and wave C as well as wave (B) has possibly ended at 1.7192, below support at 1.4232 would add credence to this count, then further fall to 1.4000 level would follow but reckon downside would be limited to 1.3655 support and price should stay above previous support at 1.3500.
On the downside, although current pullback from 1.3619 suggests initial downside risk is for minor correction to 1.3450-55, reckon downside would be limited to 1.3380-85 and bring another rise later to aforesaid upside targets. Below previous resistance at 1.3329 (now support) would defer and suggest a temporary top is possibly formed, bring retracement of recent rise to 1.3290-00, then 1.3240-50 but said support at 1.3153 should remain intact, bring another upmove later.
Recommendation: Long entered at 1.3165 met target at 1.3365 with 200 points profit and would buy again at 1.3390 for 1.3590 with stop below 1.3290.
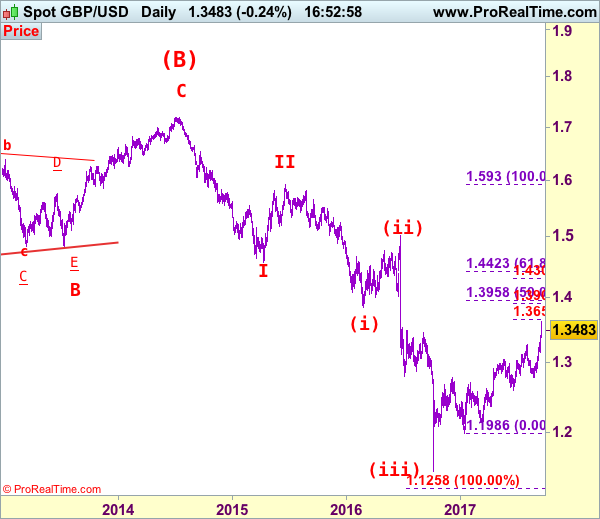
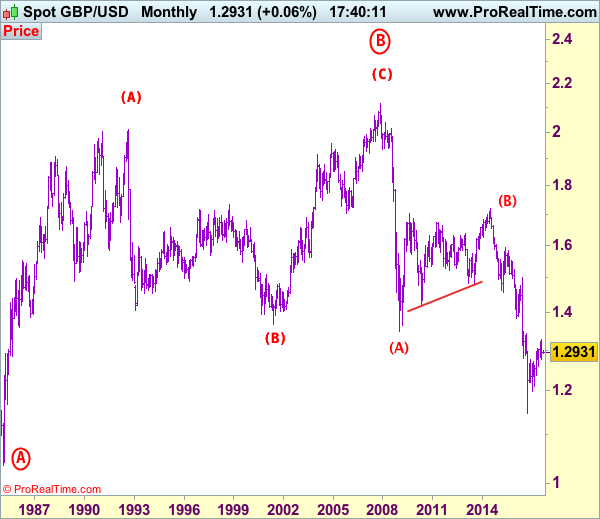
Longer term - Cable's rise from 1.0520 (Feb 1985) to 2.0100 (September 1992) is seen as [A], the decline to 1.3682 is labeled as (B) and (C) wave rally has ended at 2.1162 (9 Nov, 2007) which is also the top of larger degree wave B with circle. The selloff from there is a 5-waver with wave (A) ended at 1.3500 (23 Jan 2009), wave (B) itself is labeled as A: 1.6733, triangle wave B: 1.4813 and wave C as well as top of wave (B) ended at 1.7192 (2014), hence the selloff from there is an impulsive wave (C) with wave I : 1.4566, wave II 1.5930, an extended wave III is unfolding and already exceeded our downside target at 1.3500 and 1.3000, hence weakness to 1.2500 and possibly 1.2000 cannot be ruled out, however, price should stay well above psychological level at 1.0000.
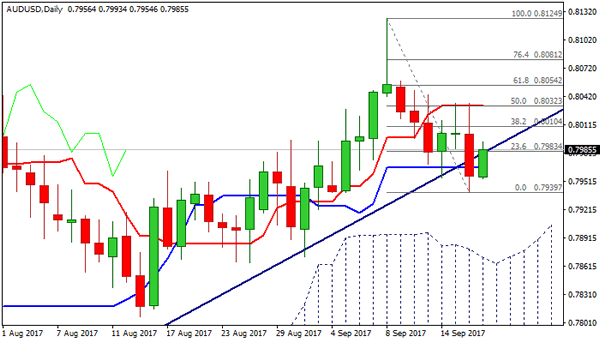
Technical Outlook: AUDUSD – Stronger Recovery Seen On Sustained Break Above 0.8000 Resistance Zone
The Aussie regained traction in early Europe and returned near Asian peak at 0.7993 after release of RBA's last meeting minutes.
The minutes of central banks last meeting showed that the RBA is encouraged by recent jobs data but wages are expected to stay low for some time. The minutes also pointed at stronger than expected economic growth in China but high debt weighing on the outlook.
Fresh recovery after strong fall on Monday probes above broken main bull-trendline (0.7988) and needs sustained break above 0.8000 zone (bull-trendline / psychological point / Fibo 38.2% of 0.8124/0.7939 downleg) to signal higher low formation at 0.7939 (Monday's low) and open way for further recovery.
Extension above next key barrier at 0.8032 (daily Tenkan-sen / Fri/Mon double upside rejection) is needed to confirm reversal.
Res: 0.8000, 0.8010, 0.8032, 0.8054
Sup: 0.7966, 0.7939, 0.7929, 0.7902
GBP/CHF Elliott Wave Analysis
GBP/CHF – 1.2960
Sterling found decent demand at 1.2343 earlier this month and has rallied very strongly, price even penetrated previous resistance at 1.3069, signaling early erratic rise from 1.1475 has resumed and upside bias is seen for this move to extend further gain to 1.3100, then previous resistance at 1.3208 but near term overbought condition should prevent sharp move beyond 1.3300 and reckon 1.3526 (previous support) would remain intact, bring retreat later.
To recap the larger degree count, the selloff from 2.4965 (July 2007) is the beginning of wave V with circle and is labeled as 1: 2.3760, 2: 2.4425, wave 3 extension ended at 1.1470, followed by wave 4 at 1.5547, the quick rebound from 0.9106 suggests wave 5 as well as entire circle wave V could have ended there, hence consolidation with mild upside bias is seen for major correction to take place, bring initial test of 1.5547 (previous 4th of a lesser degree).
On the downside, as price has retreated after rising to 1.3078, suggesting consolidation below this level would be seen with initial downside bias for pullback to 1.2900, however, reckon 1.2800-10 would limit downside and bring another rise later. Only below support at 1.2716 would defer and suggest a temporary top is formed instead, bring correction to 1.2650-60 and later towards 1.2600 before prospect of another upmove.
Recommendation: Buy at 1.2800 for 1.3100 with stop below 1.2700.
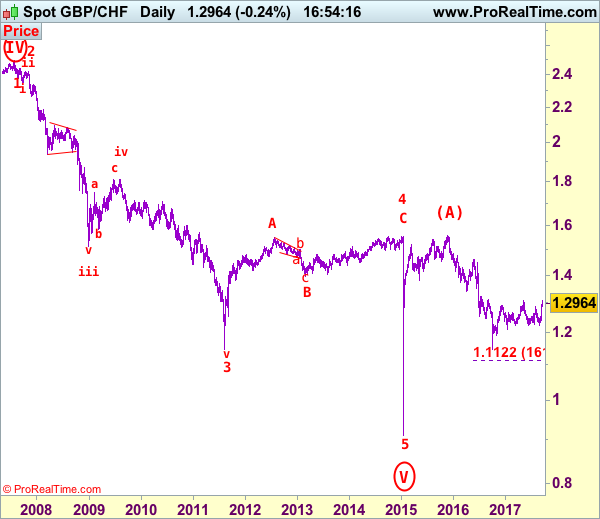
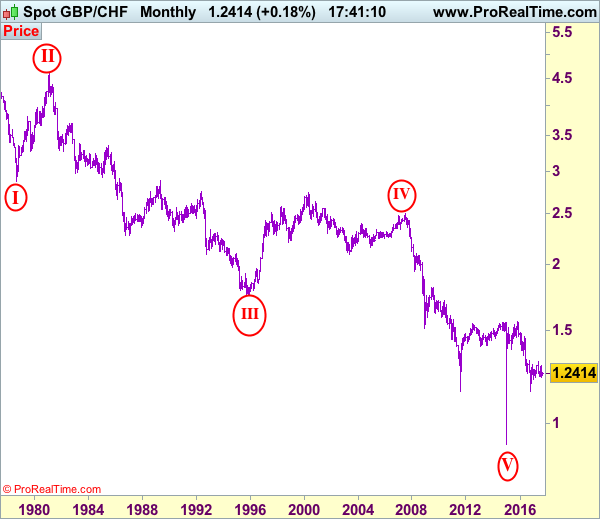
On the Monthly chart, the longer-term count is that major downtrend is under way with circle wave I at 2.8645 (Sep 1.978), then wave II with circle at 4.6175 (Feb 1981), the wave III with circle ended at 1.7425 (Nov 1995) and followed by wave IV with circle at 2.4965 (July 2007 with a short wave C) and wave V with circle has possibly ended at 0.9106. A monthly close above 1.5547 would add credence to this view, bring major correction to 1.7000, then towards psychological level at 2.0000.
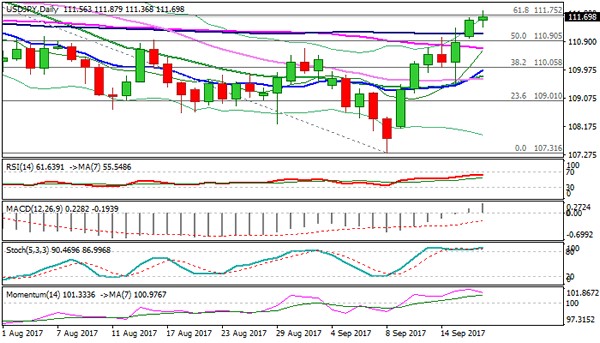
Technical Outlook: USDJPY – Bulls Cracked Key Barriers And Focus 200SMA Target, 111.00 Support Zone To Hold Dips
The pair remains bid on Tuesday and probes above key barriers at 111.61/75 (daily cloud top / Fibo 61.8% of 114.49/107.31 descend), in extension of strong rally in past two days.
Sustained break here is needed to generate strong bullish signal for further advance and test of 200SMA at 112.23.
Another bullish signal came from yesterday's close above weekly cloud top (111.21) which underpins today's action.
However, bulls may show hesitation before firm break above 111.61/75 pivots, as strongly overbought slow stochastic on daily chart warns, but so far without clearer bearish signal.
Downticks should ideally stay above 111.00 support zone (Monday's low / broken 100SMA) to keep immediate bulls intact.
Otherwise, deeper pullback could be anticipated. Key support lies at 110.75 )daily cloud base / 55SMA) and sustained break here would generate stronger reversal signal.
Res: 111.75, 111.87, 112.23, 112.80
Sup: 111.36, 111.21, 111.00, 110.75
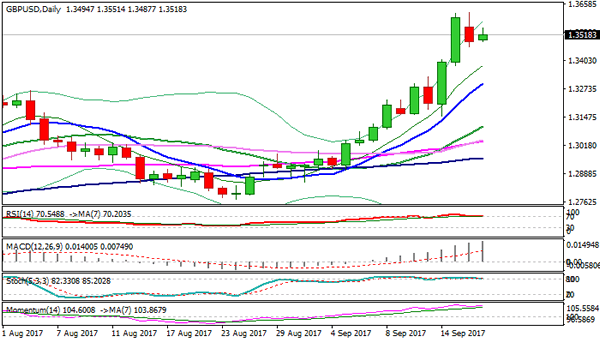
Technical Outlook: GBPUSD – Consolidation Is Under Way, Deeper Pullback Not Ruled Out
Cable is holding within triangular consolidation under fresh 15-month high at 1.3618, with downside pressure growing after Monday's close in red, triggered by profit-taking and comments from BoE governor Carney, who disappointed markets by not specifying when the central bank might raise interest rates.
Yesterday's easing found footstep at 1.3464, but overbought daily studies weigh on near-term action, which was so far limited by hourly cloud top (1.3551) that keeps the downside vulnerable.
Violation of Monday's low would generate stronger bearish signal, while extension below pivot at 1.3439 (Fibo 38.2% of 1.3148/1.3618 upleg) is needed to confirm correction.
Alternatively, sustained break above very thick hourly cloud (spanned between 1.3551 and 1.3383) will be bullish signal.
However, the pair may remain within extended consolidation while pivotal boundaries stay intact
Res: 1.3551, 1.3582, 1.3618, 1.3646
Sup: 1.3487, 1.3465, 1.3439, 1.3383
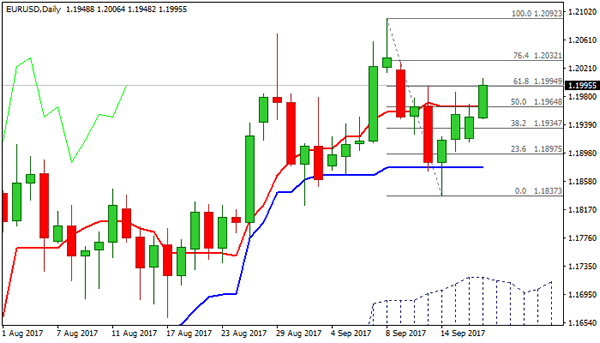
Technical Outlook: EURUSD Lifts Above Tenkan-Sen And Turns Focus Towards Recent Peaks, ZEW Data In Focus
The Euro retested 1.2000 barrier in early European trading on Tuesday, hitting one-week high, as fresh acceleration higher eventually broke above Tenkan-sen barrier which limited upside attempts in past four days.
Fresh bulls also dented 1.1995 barrier (Fibo 61.8% of 1.2092/1.1837 pullback) and generated another bullish signal, with sustained break higher needed for confirmation.
Further upside action may result in retest of recent trend high at 1.2092 (the highest since Dec 2014), with stretch towards 1.2166 (Fibo 50% of larger 1.3992/1.0340 descend), seen on break higher.
Broken daily Tenkan-sen now acts as solid support at 1.1964, followed by top of hourly cloud at 1.1942 (cloud is spanned between 1.1942/12 and underpins near-term action).
ZEW data are key releases from the European session today. German economic sentiment is expected to rise in September, according to the forecast at 12.5 vs 10.0 in Aug, with Eurozone economic sentiment expected at 32.4 vs 29.3 in Aug, which could lend further support to the single currency on positive release.
Res: 1.2006, 1.2029, 1.2070, 1.2092
Sup: 1.1964, 1.1942, 1.1912, 1.1877
Trade Idea: GBP/USD – Buy at 1.3400
GBP/USD – 1.3478
Original strategy :
Buy at 1.3450, Target:1.3650, Stop: 1.3390
Position: -
Target: -
Stop: -
New strategy :
Buy at 1.3400, Target:1.3600, Stop: 1.3340
Position: -
Target: -
Stop:-
Although cable bounced to 1.3552, renewed selling emerged there and has slipped again, suggesting consolidation below yesterday’s high of 1.3619 would be seen and retracement to 1.3440-50 is likely, however, reckon 1.3380-85 would limit downside and bring another rise later, above said resistance at 1.3552 would signal the retreat from 1.3619 has ended, bring retest of this level first. Looking ahead, a break of 1.3619 would extend recent upmove to 1.3650-60, then towards 1.3700. We have re-labeled our preferred count (pls see the attached chart) that the wave IV is unfolding as a complex double three (ABC-X-ABC) correction with 2nd wave B ended at 1.2774, hence 2nd wave C is unfolding and may extend further gain to 1.3650, then 1.3700, however, near term overbought condition should limit upside to 1.3770-75 and reckon 1.3800-10 would hold from here, bring retreat later.
In view of this, would not chase this rise here and would be prudent to buy sterling on subsequent pullback as 1.3380-85 should limit downside. Only below previous resistance at 1.3329 (now support) would abort and signal a temporary top is formed instead, bring deeper correction to 1.3290-00 and possibly towards 1.3250-60.
Our preferred count on the daily chart is that cable's rebound from 1.3500 (wave (A) trough) is unfolding as a wave (B) with A ended at 1.7043, followed by triangle wave B and wave C as well as wave (B) has ended at 1.7192, the subsequent selloff is the larger degree wave (C) which is still unfolding with minor wave (III) of larger degree wave 3 ended at 1.1986, hence wave (IV) correction is in progress which could either be a triangle wave (IV) of a complex formation but upside should be limited to 1.3500 and price should falter well below 1.4000, bring another decline in wave (V) of 3 for weakness to 1.1500, then 1.1200.
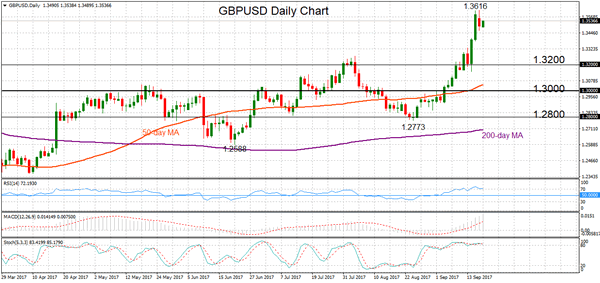
GBPUSD Rally Fades, Medium-Term Outlook Remains Bullish
GBPUSD has stalled its recent rally that took the pair to a high of 1.3618 yesterday. This is the highest level since June 2016. After reaching this level, the market became overextended as is indicated in the momentum oscillators. RSI is overbought above 70 and the stochastic is above 80.
The underlying market structure is bullish – it can be seen that the MACD is bullish and still rising and there is limited downside at this stage. GBPUSD is making a corrective move lower following the strong surge in the past few sessions.
Any further weakness in the market below Friday’s low of 1.3381 would target the key level at 1.3200. Failure at this support would signal more near-term downside especially if there is a move below last week’s low of 1.3149. From here the focus turns to the next key level at 1.3000. A drop back below this psychological level would start to weaken the bullish phase and see the start of a stronger move down towards the August low of 1.2773.
The medium-term outlook should stay bullish if support at 1.2773 holds. The crossover of the 50-day above the 200-day moving average in mid-May gave a bullish signal. In the near term, the bias may turn neutral since resistance at 1.3616 is expected to be strong and likely to keep the market capped below. Clearing the 1.3616 peak would see a resumption of the bullish trend.
Dollar Climbs Vs Yen Ahead Of FOMC, Pound Loses Ground After Carney Speaks On Rates And Brexit
On Tuesday, the dollar hit a fresh eight-week high against the yen in Asia with investors widely expecting the Fed policymakers to announce the start of monetary tightening later this year in their two-day meeting that concludes on Wednesday. Its British counterpart was in an uptrend as well following a deep fall on Monday after the BOE Governor, Mark Carney, talked down the country’s post-Brexit trade prospects and argued that rates should rise moderately, giving no clues on when the central bank will deliver higher rates.
While the US President is expected to deliver his first speech in front of the UN leaders who aim to find a solution to North Korea’s aggressive nuclear programs, the dollar peaked at a fresh eight-week high of 111.87 early in Asia, gaining mainly from stronger US treasury yields. The move came due to expectations that the Fed will announce its plans for balance sheet reduction later this year at the end of its two-day policy meeting on Thursday, while markets are also pricing a potential third-rate hike in December.
Meanwhile, the pound pared yesterday’s losses made after the BOE Governor, Mark Carney, said on Monday at the IMF headquarters that interest rates should rise but “gradually” and to a “limited extent”, giving no clues on the timeframe of this process. Moreover, he claimed that Britain’s exit from the EU will hurt growth prospects in the near-term and push up inflation, saying that new trade relations with non- EU members are less likely to offset drawbacks arising from weaker trade agreements with EU members. The pound retreated by almost 1% on Monday to $1.3463 before it surged to $1.3550 early on Tuesday.
Euro/dollar posted gains during the session, reaching a one-week high of 1.2005 before it fell to 1.1994.
The aussie was moving upwards most of the time during the Asian session after the RBA minutes released today maintained an upbeat view on the economic outlook, while the Australian house price growth came in higher than expected, giving some support to the currency. The minutes mentioned that employment growth is expected to continue improving with a limited impact on the already subdued wages. In addition, minutes revealed risks from household debt rising faster than household income and from a stronger local currency. Aussie/dollar slipped to a session low of $0.7960 following the report but then jumped to $0.7983, finding some support from the House price index which grew by 1.9% q/q, above the 1.1% forecasted in the second quarter.
The loonie weakened against the dollar after the BOC’s Deputy Governor, Timothy Lane, said that the central bank will keep a close eye on the currency, which has recently strengthened to a two-year high versus its US counterpart, before taking any policy decision. Moreover, he added that households are now more indebted compared to the period when rates were close to neutral. However, he claimed that a strengthening economy will help consumers to deal with debt costs. Dollar/loonie drifted higher on late Monday to a two-week high of 1.2336, falling to 1.2286 during the Asian session.
Looking at commodities, WTI crude was up by 0.46% on the day at $50.14 per barrel and Brent rose by 0.31% to $55.65.
Gold was trading flat at $1,307.10 per ounce.
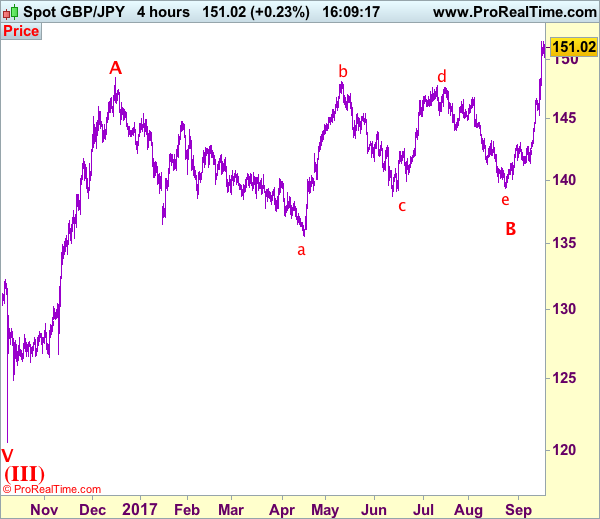
Trade Idea: GBP/JPY – Sell at 151.00
GBP/JPY - 150.55
Original strategy:
Buy at 149.50, Target: 151.50, Stop: 148.90
Position: -
Target: -
Stop: -
New strategy :
Sell at 151.00, Target: 149.00, Stop: 151.60
Position: -
Target: -
Stop:-
Although sterling rose to 151.55 again today, failure to penetrate this level and current retreat suggest consolidation would be seen and as long as said resistance holds, mild downside bias is for test of 150.00, break there would suggest a temporary top is possibly formed, bring retracement of recent rise to 149.50, then 149.00, however, reckon previous resistance at 148.35 (now support) would hold and bring rebound later.
In view of this, we are looking to turn short on recovery as 151.15-20 should limit upside and bring another retreat. Above said resistance at 151.55 would abort and extend recent rise to 152.00, then 153.00, however, near term overbought condition should limit upside to 154.00-10 and price should falter below 155.00. Our latest preferred count is that triangle wave B correction ended at 139.35 (the final e leg of triangle), hence wave C has commenced and may extend further gain to 153.00 and later 154.00.
Our preferred count is that larger degree wave V with circle is unfolding from 251.12 with wave (I) 219.34, (II): 241.38 and wave (III) is subdivided into 1: 192.60, 2: 215.89 (23 Jul 2008) and wave 3 ended at 118.87 earlier in 2009. The correction from there to 162.60 is wave 4 which itself is a double three and is labeled as first a-b-c ended at 151.53, followed by wave x at 139.03, 2nd a ended at 162.60, 2nd b at 146.75 and 2nd c leg of wave 4 ended at 163.00. Therefore, the decline from 163.00 to 116.85 is now treated as wave 5 which also marked the end of larger degree wave (III), hence wave (IV) major correction has commenced for retracement of the wave (III) from 241.38 and upside target at 183.95-00 (50% Fibonacci retracement of the wave (II) from 241.38) had been met, a drop below 160.00 would suggest wave (IV) has ended at 195.85, bring decline in wave (V) for initial weakness to 130 (already met) and 120.