
Sample Category Title
EUR/GBP Strong Decline
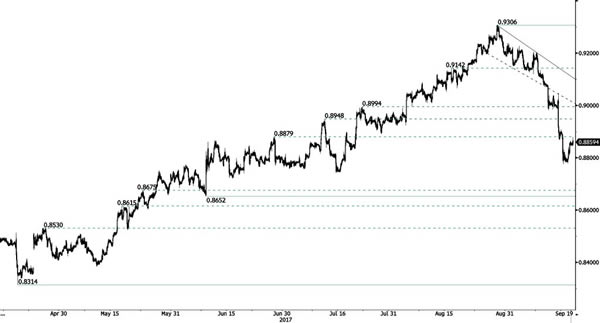
EUR/GBP is trading lower. However, as long as prices remain below the resistance at 0.9176 (declining trendline), the short-term technical structure is biased to the downside. Hourly support is given at 0.8982 (12/09/2017). Strong resistance lies at 0.9306 (29/07/2017 high).
In the long-term, the pair has largely recovered from recent lows in 2015. The technical structure suggests a growing upside momentum. The pair is trading above from its 200 DMA. Strong resistance can be found at 0.9500 (psychological level).
AUD/USD Bouncing On Lower Bound Of Uptrend Channel
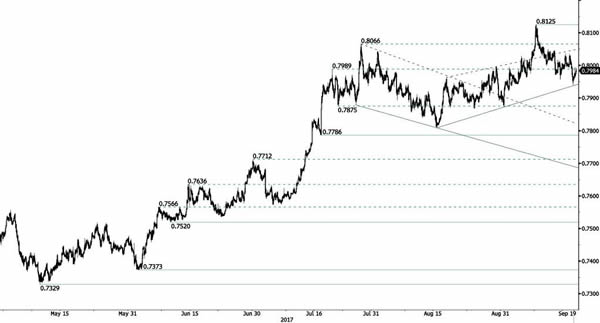
AUD/USD is bouncing higher below 0.8000. Hourly resistance is given at 0.8125 (08/09/2017 high). Hourly support below 0.7950 (former uptrend channel). Expected to further weaken.
In the long-term, the trend is largely negative since 2011. Key supports stands at 0.6009 (31/10/2008 low) . A break of the key resistance at 0.8295 (15/01/2015 high) is needed to invalidate our long-term bearish view.
USD/CHF Downside Pressures Are Rising
USD/CHF keeps on bouncing. Strong resistance is given at 0.9808 (30/05/2017 high). The technical structure shows that the the pair is likely to head further lower below 0.9421 (03/05/2017). Expected to show renewed bearish pressures.
In the long-term, the pair is still trading in range since 2011 despite some turmoil when the SNB unpegged the CHF. Key support can be found 0.8986 (30/01/2015 low). The technical structure favours nonetheless a long term bullish bias since the unpeg in January 2015.
USD/JPY Monitoring Resistance Area Around 112.00
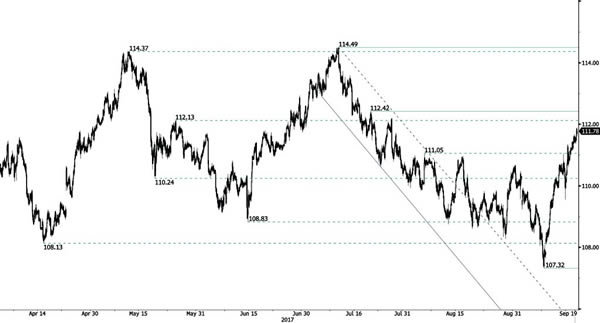
USD/JPY is pushing higher towards 112.00. Strong support is located at a distance at 107.32 (08/09/2017 high). Expected to show further bullish pressures. Yet, downside risks are now rising as markets may soon take some short-term profit.
We favor a long-term bearish bias. Support is now given at 99.02 (10/08/2013 low). A gradual rise towards the major resistance at 125.86 (05/06/2015 high) seems unlikely. Expected to decline further support at 93.79 (13/06/2013 low).
GBP/USD Short-Term Consolidation
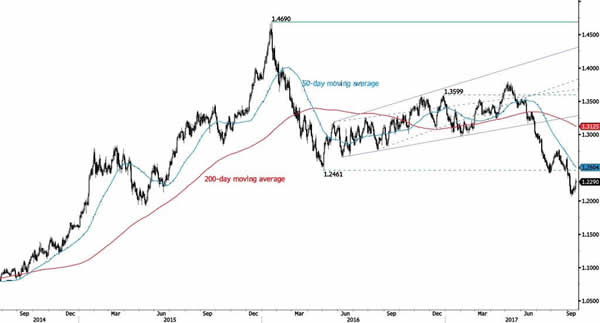
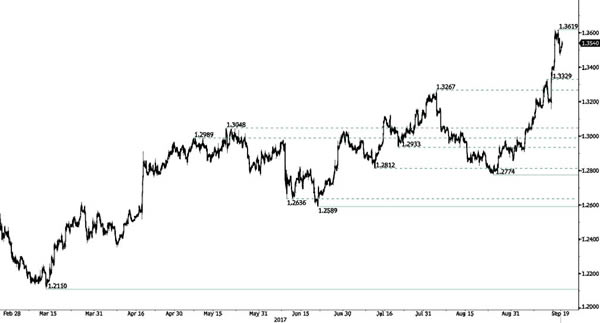
GBP/USD is consolidating lower after recent surge. The pair has broken hourly resistance at 1.3329 (13/09/2017 high) and has set up a new hourly resistance at 1.3619 (18/09/2017 high). Strong support is given at 1.2774 (24/08/2017 low). Expected to show continued bearish consolidation.
The long-term technical pattern is reversing. The Brexit vote had paved the way for further decline. Long-term support can be found at 1.1841 (07/10/2017 low). Long-term resistance given around 1.35 is at stake and indicates a long-term reversal in the negative trend. Yet, it is very unlikely at the moment.
EUR/USD Pushing For Another Leg
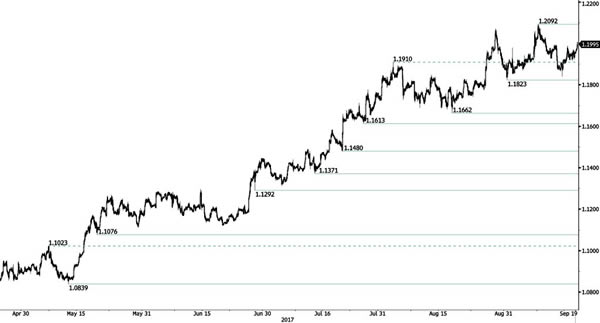
EUR/USD lies in a bullish trend. Hourly resistance can be found at 1.2092 (08/09/2017 high) while hourly support lies at 1.1823 (31/08/2017 low). Stronger support is given at a distance at 1.1662 (17/08/2017 low). Expected to show renewed bullish pressures.
In the longer term, the momentum is now turning largely positive. We favour a continued bullish bias. Key resistance is holding at 1.2252 (25/12/2014 high) while strong support lies at 1.0341 (03/01/2017 low).
EUR/CHF Towards New Peaks
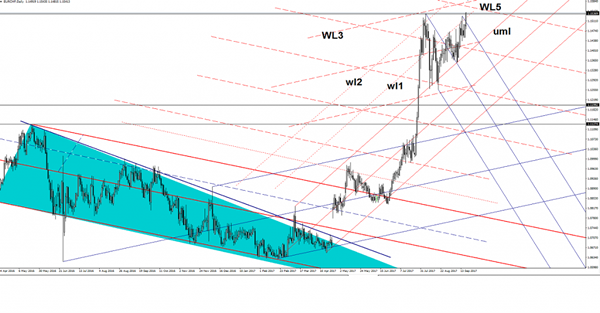
Price edges higher and jumped above the 1.1536 static resistance, a valid breakout will confirm a further increase in the upcoming period. The next upside target will be at the fifth warning line (WL5), could be attracted also by the WL3 on the short term. Only a failure to reach these lines will signal another drop on the short term.
Gold Breakdown Needs Confirmation
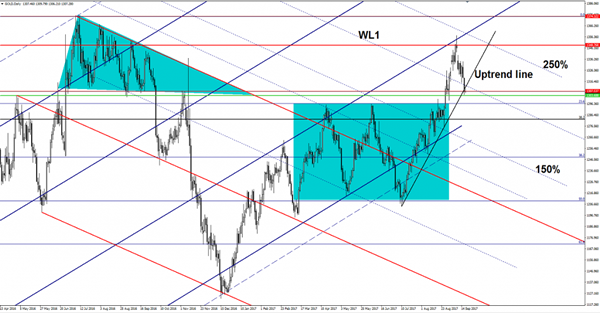
Price has dropped sharply in the last two days and has managed to drop below the uptrend line and much below the warning line (WL1) of the major descending pitchfork. Remains to see if this will be a valid breakout, we still need a confirmation that will drop further. A retest of the WL1 followed by a minor drop will validate a further decrease.
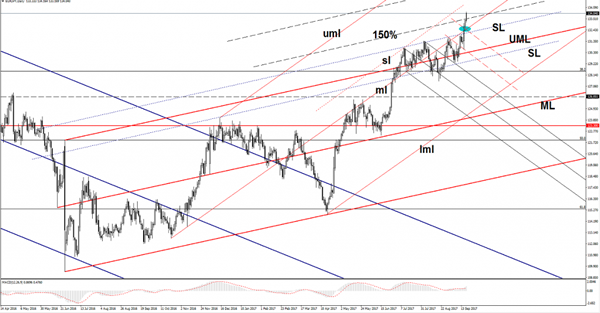
EUR/JPY At New Highs
The currency pair has rallied aggressively and has managed to escape from a minor ascending channel, signaling that the bulls are in full control and should drive it much higher. The Yen is demolished by the Nikkei’s impressive rally, the index is trading at 20282 level, much above the 20058 broken static resistance and below the 20320 highest high.
The JP225 seems unstoppable on the short term, has ignored important resistance levels and looks motivated to climb much higher in the upcoming period.
Personally, I’m waiting to see a minor decrease in the upcoming days after the impressive rally. A minor retreat will force the Yen to appreciate a little versus all its rivals.
The Euro could receive a helping hand from the Euro-zone data, the Current Account could increase from 21.2B to 22.3B in July, moreover the German ZEW Economic Sentiment is expected to climb from 10.0 points to 12.3 points. The ZEW Economic Sentiment could increase from 29.3 points to 32.4 points.
Price has managed to break above the confluence area formed at the intersection between the median line (ml) of the black ascending pitchfork with the warning line (short descending dotted line). The valid breakout has accelerated the current rally. EUR/JPY is trading right above the 150% Fibonacci line (ascending dotted line) and should approach and reach the sliding line (sl), where he may find a temporary resistance.
Central Bankers Force GBP And CAD To Retreat. Focus On Fed’s Sept 19-20 Policy Meeting
Dollar Eased Before Fed Decision. The dollar index, which measures the greenback against a basket of currencies was down 0.1 percent at 91.924 on Tuesday while investors await Fed policy decision.
BOC Policymaker Lane Highlights CAD Strength. The Loonie pulled back from its recent rally when BOC policymaker Lane gave his testimony during the start of what would likely be a monetary policy-focused week.
Yen Gave Up Ground on Improving Risk Sentiment. The Japanese Yen’s recent selloff came to a halt in ahead of the BOJ decision, as investors decide to wait and see if the central bank would follow through on what many analysts believe will be an aggressively loose monetary policy or if they will disappoint yet again. Dollar eased 0.1 percent versus the yen after marking its highest since July 27 overnight.
Pound Pulled Back After Carney’s Speech. Pound pairs were already jittery in the hours leading up to BOE head Carney’s testimony as market participants were probably expecting him to temper the currency’s strong rally. He didn’t really say anything downbeat but traders didn’t seem so impressed by his rationale for hiking rates.
Gold Higher Ahead of Fed Meeting. Gold on Tuesday inched up from its lowest in over two weeks as the dollar shed some of its gains from the previous session, with market focus on a two-day Federal Reserve meeting that kicks off later in the day.
Watch Out Today For:
02:30 am GMT: AUD RBA Meeting Minutes