
Sample Category Title
Elliott Wave View: NZDUSD More Upside
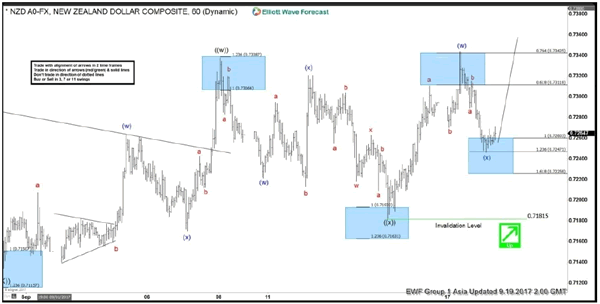
NZDUSD Short Term Elliott Wave view suggests that the Index shows a 5 swing sequence from 8/31 low favoring further upside. Rally from 8/31 low (0.7128) is unfolding as a double three Elliott Wave structure. Up from 0.7128, Minute wave ((w)) ended at 0.7338 and Minute wave ((x)) ended at 91.71. Wave ((y)) is currently in progress and the subdivision is also unfolding as a double three Elliott wave structure. Minutte wave (w) of ((y)) ended at 0.7344 and Minutte wave (x) of ((y)) ended at 0.7246. Near term, while pullbacks stay above 0.718, expect pair to extend higher. We don't like selling the pair.
NZDUSD 1 Hour Elliott Wave Chart
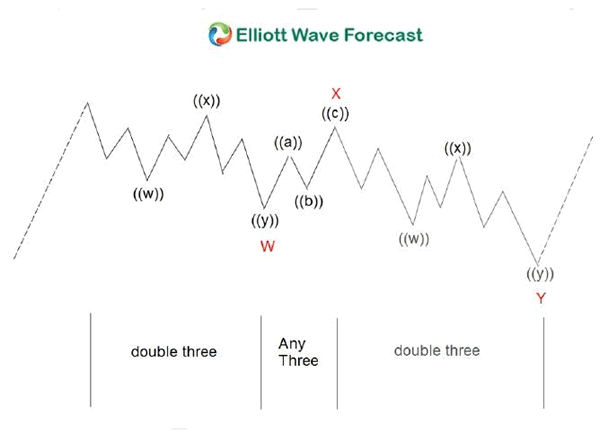
Double three ( 7 swings) is the most important pattern in Elliott wave's new theory. It is also probably the most common pattern in the market these days. Double three is also known as a 7-swing structure. It is a very reliable pattern that gives traders a good opportunity to trade with a well-defined level of risk and target areas. The image below shows what Elliott Wave Double Three looks like. It has labels (W), (X), (Y) and an internal structure of 3-3-3. This means that all 3 legs has corrective sequences. Each (W) and (Y) is formed by 3 wave oscillations and has a structure of A, B, C or W, X, Y of smaller degrees.
XAUUSD Intraday Analysis
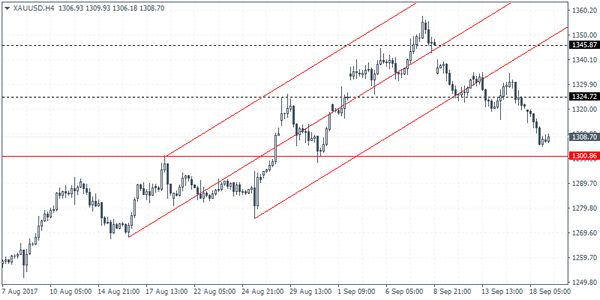
XAUUSD (1308.70): Gold prices have posted a steady decline with price action gapping lower below 1324.72. We expect the downside momentum to see further declines that could send gold prices down to test the support at 1300.86. However, there is scope for a modest reversal off the current levels. Resistance at 1324.72 will be in play as gold prices aim to fill this minor gap from earlier this week. A reversal around 1324.72 will signal the completion towards the 1300.86 support. To the upside above 1324.72, signals a bullish bias in gold that could see price aiming for the 1345.87 resistance level.
USDJPY Intraday Analysis
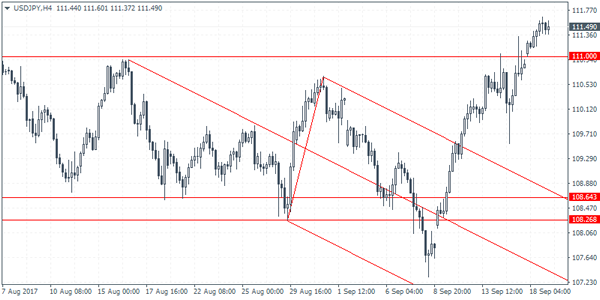
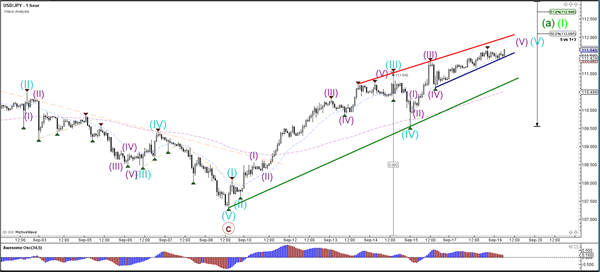
USDJPY (111.49): USDJPY has posted strong gains in the past few sessions. The gains saw prices rallying to recover above the 111.00 resistance level. Having cleared this level, USDJPY could be seen aiming for further gains. However, we expect to see some short-term declines in the process. Any near-term dips are likely to be supported near the 111.00 level where the unfilled gap from Monday's open is likely to be tested. A decline below 111.00 could however push prices lower to test the breakout level from the falling median line.
EURUSD Intraday Analysis
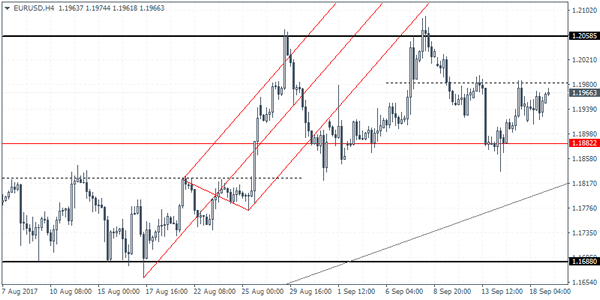
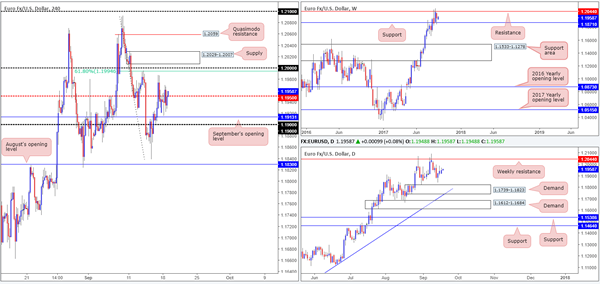
EURUSD (1.1966): The EURUSD managed to post some modest gains yesterday as price action was seen recovering back to 1.1954. On the 4-hour chart, we see a potential inverse head and shoulders pattern that is evolving with the neckline resistance seen forming at 1.1976. With the right shoulder now formed, we expect EURUSD to rally back to 1.2060 at the minimum on a successful upside breakout from this pattern. Alternately, failure to break out above 1.1976 will put EURUSD in a sideways range which could keep the currency pair range supported above 1.1882. A breakdown below this support level will keep EURUSD biased to the downside targeting 1.1688.
GBP Retreats On Carney’s Comments On Brexit
The markets were trading relatively quiet yesterday with the main events of the day coming from the BoE Governor Carney's comments and the Eurozone inflation data. The British pound was seen trading weaker yesterday on the back of the comments from Carney.
Speaking of inflation, Carney said that Brexit would prove to be an inflationary event as the central bank prepares to hike rates. He cautioned that although the intention was Brexit was not to isolate Britain from the rest of the world; the initial outcome would be similar due to uncertainty in trade ties with Europe.
The euro managed to make some gains, especially against the British pound as latest inflation data from Eurostat showed that consumer prices in the Eurozone surged to a four-month high at 1.5% in August. Interestingly, the ECB's monthly bulletin, however, showed that due to a statistical quirk, inflation in the eurozone could fall to below 1% in the first quarter of 2018. That did not dent the sentiment in the euro which managed to hold on to the gains.
Looking ahead, economic data today will see the release of the US building permits data and housing starts. Overall, the day looks a bit relaxed, but investors are likely to turn cautious as the Fed's two-day monetary policy meeting starts today.
Currencies: Sterling Rebound Runs Into Resistance
Sunrise Market Commentary
- Rates: Eyes remain on the Fed
Core bonds lost slightly more ground yesterday in thin trading conditions. Today's eco calendar contains eco data with little market moving potential, especially ahead of the FOMC. We expect neutral trading within small ranges. Since last week, market reduced dovish bets, making the technical picture and positioning more neutral. - Currencies: Sterling rebound runs into resistance
The dollar showed no clear trend yesterday. Yen weakness remains the key trend among the major currency cross rates. Today's eco calendar probably won't inspire big directional USD bets going into tomorrow's FOMC policy announcement. The easiest part of the sterling rally on recent hawkish BoE comments is apparently behind us.
The Sunrise Headlines
- US stock markets closed with limited gains (+0.2%) in a session devoid of eco data with investors waiting tomorrow's FOMC meeting. Overnight, most Asian bourses lose slightly ground with Japan outperforming (yen weakness).
- BoE Carney said Brexit is undermining the UK's supply capacity, making it harder for the economy to grow without generating inflationary pressures. That's one reason why the BoE may need to hike rates in the coming months.
- The Bank of Canada will pay close attention to how the economy responds to both higher interest rates and a stronger CAD, and remains data-dependent as it looks ahead to further decisions on interest rates, BoC Lane said.
- Senate Republicans are considering writing a budget that would allow for up to $1.5 trn in tax cuts over the next decade, said people familiar with the discussions. Budget talks are continuing and no final decision has been reached.
- Theresa May has moved to tighten her grip on the UK's disjointed Brexit operation, shaking up her negotiating team and dismissing efforts by her foreign secretary, Boris Johnson, to push her towards a hard exit.
- Hurricane Maria barrelled into the eastern Caribbean as a Category 5 storm, ripping roofs from homes, knocking out electricity on the island of Dominica and threatening others in the region already ravaged by Hurricane Irma.
- Today's calendar contains German ZEW investor sentiment, US housing starts and building permits
Currencies: Sterling Rebound Runs Into Resistance
Yen weakness prevails. Dollar trades mixed
Yesterday, technical considerations drove USD trading in the absence of hard news. Core yields traded with a slight upward bias. This rise weighted on the yen with USD/JPY and EUR/JPY breaking through key resistance (recent highs). There was no directional impact on EUR/USD. The pair hovered in the mid 1.19 area.The pair finished the day at a1.1954. USD/JPY closed the session at 111.57.
Overnight, Asian equities trades with modest losses. Japan outperforms on catching up to do after yesterday's holiday and yen weakness. PM Abe is rumoured to call snap parliamentary elections. Markets assume that a continuation of the current policy also includes an extension of the ultra-loose BOJ policy. This is an additional negative for the yen. The yuan extends its recent decline. EUR/USD maintains a cautious upward bias (1.1975 area). There is no indication of broad-based USD strength going into tomorrow's FOMC decision.The trade-weighted dollar (91.86) is going nowhere.
Today the eco calendar is again only modestly interesting. The September German ZEW economic confidence survey is expected little changed from August. As German equities recovered in September, we have no reasons to distance us from consensus. The market reaction to the release is mostly modest at best. In the US, housing starts and permits are expected respectively slightly higher and slightly lower in August. Sales look to have peaked, but no such sign yet from permits, which urges for caution in interpreting the housing market. Markets will look forward to an tomorrow's Fed decision. For an in extenso analysis see the fixed income part of the this report. The focus will be on the reduction of the balance sheet, but the ‘dots' are important too. We expect the ‘median dots' for December 2017 and for 2018 to remain unchanged. If so, it might be slightly supportive for the dollar. The speech of Trump before the UNand the US tax reduction debate are wild cards.
Last week's cautious USD rebound (due to positive risk sentiment) was not convincing as soft US data created a mixed dollar context. Despite disappointing US data, core yields (in the US and EMU) extended their rise, suggesting that markets don't expect an overly soft FOMC. This might prevent further USD losses going into the FOMC policy meeting
We did start the week with a neutral bias on the dollar. EUR/USD hovers in a sideways consolidation pattern between 1.1823 and 1.2070. It was disappointing for EUR/USD bears that last week's correction didn't reach this range bottom. More confirmation is still needed that the recent bottoming out process in US yields and in the dollar might be the start of more sustained USD gains (againstthe euro).
The day-to-day momentum in USD/JPY is more constructive. The yen trades weak across the board. USD/JPY regained the 110.67/95 previous resistance. This a short-term positive. EUR/JPY shows a similar positive picture. So, the yen might stay under pressure at least until the next event risk pops up.
EUR/USD consolidation off recent top, but no test of first significant support level.
EUR/GBP
GBP rebound losing steam
After a week of very strong gains on hawkish BoE talk, sterling finally fell prey to modest profit taking yesterday. Investors holding sterling longs took some chips off the table. BoE governor Carney confirmed recent BoE communication that chances of a rate hike have risen, even as Brexit contains plenty of risks for the UK economy. The speech of the BoE governor didn't help sterling anymore though. It fell even prey to more profit taking. EUR/GBP closed the session at 0.8856. Cablefinished the day at 1.3495.
Technical considerations will probably prevail today as the calendar is emty. Markets will continue to look forward to PM May's Brexit speech Friday. The sterling rally clearly lost momentum yesterday. We look out whether/how soon sterling can return to the recent correction top .If that move fails, the easiest partof the BoE rate hike rebound might be behind us.
From a technical point of view, EUR/GBP cleared the 0.8854/80 resistance (top end June), opening the way for a protracted August rebound. The move was the result of euro strength. Simultaneously, UK price data were soft enough to keep the BoE side-lined at the August meeting. Recent price data amended this story and the ST-trend reversal of sterling was reinforced by recent BoE comments. Medium term, we maintain a EUR/GBP buy-on-dips approach as we expect the mix of relative euro strength and sterling softness to persist. The prospect of withdrawal of BOE stimulus put a solid floor for sterling ST term. We look out how far the current correction has to go. EUR/GBP is nearing next support at0.8743 and 0.8652. We start looking to buy EUR/GBP on dips.
EUR/GBP: GBP-rebound rebound slows
Daily Technical Analysis: EURUSD, GBPUSD, USDJPY, USDCHF
EURUSD
The EURUSD didn’t make significant movement yesterday. The bias remains neutral in nearest term. Overall I remain bullish but price has been trapped between 1.2090 – 1.1823 range area for almost four weeks now. Immediate resistance is seen around 1.2000. A clear break and daily close above that area could trigger further bullish pressure testing 1.2100 – 1.2175 region. Immediate support is seen around 1.1915. A clear break and daily close below that area could trigger further bearish pressure retesting 1.1823 key support which remains a good place to buy with a tight stop loss as a clear break below that area would take the pair to a bearish correction zone.
GBPUSD
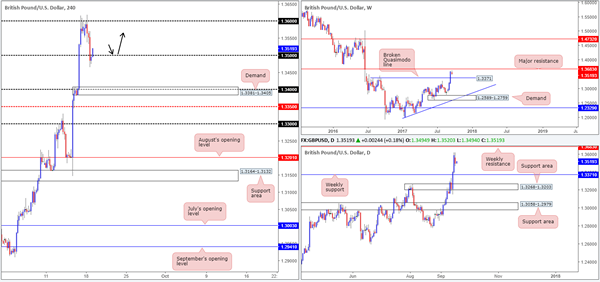
The GBPUSD was corrected lower yesterday after formed a double top formation as you can see on my H1 chart below, bottomed at 1.3464. The bias is neutral in nearest term probably with a little bearish bias testing 1.3400 support area but overall I remain bullish and any downside pullback should be seen as a good opportunity to buy. Immediate resistance is seen around 1.3550. A clear break above that area could trigger further bullish pressure testing 1.3615 key resistance which need to be clearly broken to the upside to continue the bullish scenario targeting 1.3700 – 1.3750 region. On the downside, only a break below 1.3150 key support would nullify the major bullish bias.
USDJPY
The USDJPY continued its bullish momentum yesterday topped at 111.66. The bias remains bullish in nearest term testing 112.15 region. A clear break and daily close above that area would expose 113.10/50 region. Immediate support is seen around 111.00 area. A clear break below that area could lead price to neutral zone in nearest term testing 110.50 area or lower. My H4 chart bias is now neutral but clearly bullish at H1 chart. Overall I remain neutral.
USDCHF
The USDCHF was indecisive yesterday. The bias is neutral in nearest term probably with a little bearish bias testing 0.9565 – 0.9525 support area as a part of the bearish scenario after the appearance of the bearish pin bar on daily chart last week. Immediate resistance is seen around 0.9650. A clear break and daily close above that area could trigger further bullish pressure testing 0.9700 region or higher. On the downside, a clear break and daily close below 0.9525 would expose 0.9450 key support which remains a good place to buy.
Market Update – Asian Session: Equities And FX Await Fed Meeting
Asia Summary
Asian equity markets opened broadly stronger, with a 3rd consecutive day of gains, again tracking US markets. Hong Kong shares fell for the first time in 3 days, weighed down by Chinese developers. China’s MSCI Index fell 0.4% after closing at the highest level since January 1st, 2008. The HK$ surged 0.16% against the USD to 7.8045; which prompted the HKMA to add HK$40B in additional exchange fund bills to meet demand from banks. RBA meeting minutes were relatively unchanged from prior, again saying that A$ is more a product of USD weakness and noting improvement in the domestic economy. USD was broadly weaker against G7 currencies ahead of Fed meeting, where it is expected they will announce details on a balance sheet wind down.
Key economic data
(AU) AUSTRALIA Q2 HOUSE PRICE INDEX Q/Q: 1.9% V 1.3%E; Y/Y: 10.2% V 9.2%E
(AU) RESERVE BANK OF AUSTRALIA (RBA) MEETING MINUTES: Recent domestic data is consistent with gradual pick up in growth, labour market conditions had continued to improve, although spare capacity remains
(KR) SOUTH KOREA AUG PPI M/M: 0.3% V 0.1% PRIOR; Y/Y:3.2% V 3.0% PRIOR
(NZ) NEW ZEALAND Q3 WESTPAC CONSUMER CONFIDENCE: 112.4 V 113.4 PRIOR
Speakers and Press
China/Hong Kong
(CN) China Securities Journal: China should study yuan pricing for commodities
(CN) Communist Party of China (CPC) will amend its constitution at the upcoming national congress for the first time since 2012 – Xinhua
(CN) China should adopt 'sovereign digital currency' as soon as possible - China Financial News
(CN) China said to be planning to draft scheme to open the financial sector - press
Korea
(KR) China Foreign Min: North Korea nuclear issue must be resolved peacefully with talks
Japan
(JP) Japan investors sold a net $4.36B of US corporate bonds in July (fresh record high) v $2.15B m/m – press
(JP) Japan Fin Min Aso: Need to protect gains toward fiscal consolidation (comments in response to sales tax increase)
(JP) Japan PM Abe said to call snap election as soon as Sept 25th - Japanese Press
Asian Equity Indices/Futures (00:00ET)
Nikkei 1.5%, Hang Seng -0.2%; Shanghai Composite -0.3%, ASX200 +0.1%, Kospi -0.1%
Equity Futures: S&P500 0.0%; Nasdaq100 0.0%, Dax -0.1%, FTSE100 -0.0%
FX ranges/Commodities/Fixed Income (00:00ET)
EUR 1.1975-1.1951; JPY 111.60-111.37; AUD 0.7993-0.7958;NZD 0.7380-0.7256
Dec Gold +0.1% at $1,312/oz; Nov Crude Oil -0.1% at $50.31/brl; Dec Copper +0.0% at $2.97/lb
(CN) PBoC OMO: injects CNY150B in 7 and 28-day reverse repos v injected combined CNY300B in 7 and 28 day reverse repos prior
USD/CNY (CN) China PBOC sets yuan reference rate at 6.5530 v 6.5419 prior
(HK) Hong Kong 1-month HIBOR +5bps to 0.47250% (most since Dec)
Equities notable movers
Australia/New Zealand
WLD.AU Reports 1st shipment of beef cattle to China; +12%
TPM.AU Reports underlying FY17 (A$) Net 413.8M v 409Me; EBITDA 835M v 839Me; Rev 2.48B v 2.5Be; Cuts dividend to A$0.10 v A$0.145 y/y; +9.4%
LYC.AU Reports FY17 (A$) net -45.0M v -122.2M y/y; adj EBITDA 31.9M v 30Me; Rev 257M v 264Me; -5%
Japan
6502.JP Bain consortium to offer ¥50B in provision for litigation damages in Western Digital lawsuit - Japanese press; -0.3%
5423.JP To raise Oct hot-rolled coil and H-beam prices by approx 3.8-4.7%; +3.5%
Korea
009540.KR Could win orders for very large iron ore carriers; Vale is said to have awarded contracts to shipping companies to haul iron ore under a long-term contract - financial press; +8.5%
Daily Technical Analysis: GBP/USD Bullish Bounce Within Uptrend At 61.8% Fibonacci Level
Currency pair GBP/USD
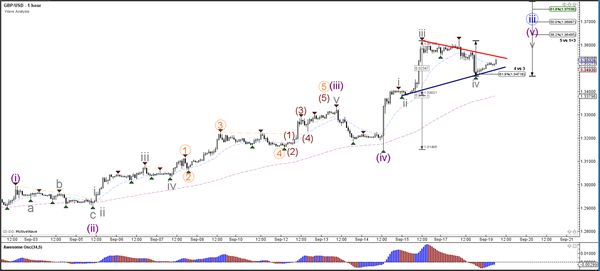
The GBP/USD made a pullback within the larger bullish momentum and could now be continuing higher as part of the wave 3 (blue). The resistance line (orange) is a potential resistance from the daily chart.
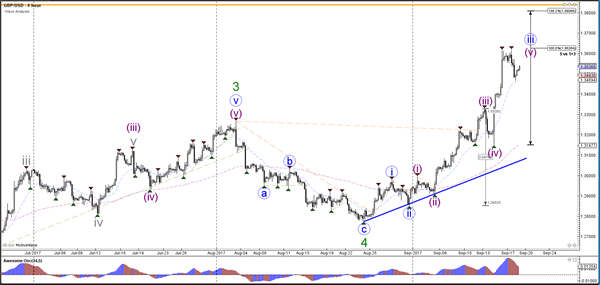
The GBP/USD bearish retracement made a correction back to the 61.8% Fibonacci level of wave 4 vs 3, which acted as a support and bouncing spot. A break above resistance (red) could indicate the continuation of the 5th waves (grey/purple).
Currency pair EUR/USD
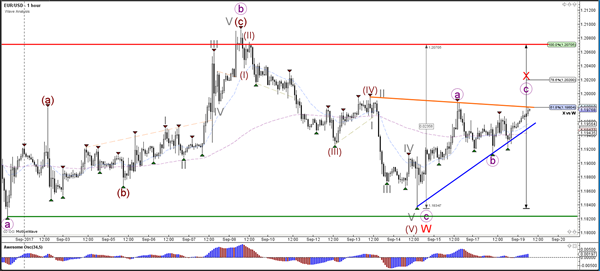
The EUR/USD could be building an extended WXY (red) correction within wave 4 (blue) unless price is showing strong bullish momentum above the resistance level (red).
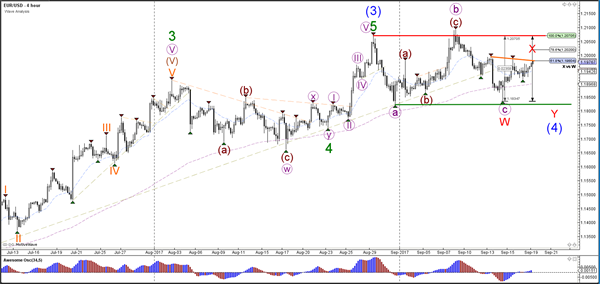
The EUR/USD is either building an ABC (purple) correction or alternatively it could be a 123 pattern. An ABC should stop at the Fibonacci levels of wave X vs W.
Currency pair USD/JPY
The USD/JPY broke above the horizontal resistance level (dotted orange) and is continuing higher within wave 5 (blue). This bullish momentum is part of a wave 1 (light green) or alternatively wave A (green).
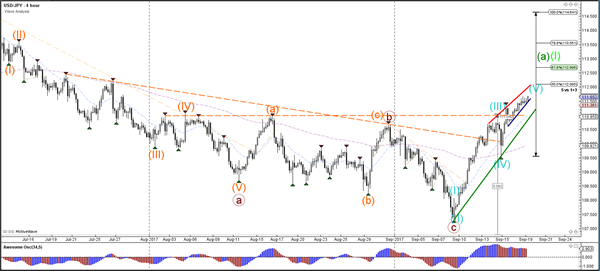
The USD/JPY is continuing higher within the wave 5 (blue) unless price
Daily Technical Outlook And Review: EUR/USD, GBP/USD, AUD/USD, USD/JPY, USD/CAD, USD/CHF, DOW 30, GOLD
A note on lower timeframe confirming price action...
Waiting for lower timeframe confirmation is our main tool to confirm strength within higher timeframe zones, and has really been the key to our trading success. It takes a little time to understand the subtle nuances, however, as each trade is never the same, but once you master the rhythm so to speak, you will be saved from countless unnecessary losing trades. The following is a list of what we look for:
- A break/retest of supply or demand dependent on which way you're trading.
- A trendline break/retest.
- Buying/selling tails ... essentially we look for a cluster of very obvious spikes off of lower timeframe support and resistance levels within the higher timeframe zone.
- Candlestick patterns. We tend to only stick with pin bars and engulfing bars as these have proven to be the most effective.
We typically search for lower-timeframe confirmation between the M15 and H1 timeframes, since most of our higher-timeframe areas begin with the H4. Stops are usually placed 1-3 pips beyond confirming structures.
EUR/USD
With absolutely no high-impacting news on the docket yesterday, the single currency is effectively little changed this morning. As you can see, the pair spent Monday’s sessions ranging between the H4 mid-level resistance at 1.1950 and September’s opening level at 1.1913. Therefore, much of the following report will echo similar thoughts put forward in yesterday’s analysis…
On the weekly timeframe, the unit remains confined between resistance at 1.2044 and support coming in at 1.1871. In addition to this, the weekly USDX chart shows price trading beneath resistance at 11854, with room to move down to at least support positioned at 11687 (converges with a long-term trendline support etched from the low 9322). Moving down to the daily timeframe, price has been consolidating between the noted weekly resistance level and a demand coming in at 1.1739-1.1823 since August 29.
Suggestions: Given H4 action currently trading a tad above the mid-level resistance 1.1950, traders may want to note the large psychological number 0.80 lurking ahead. Not only is this a watched level in the market, it is also bolstered by a strong-looking H4 supply just above it at 1.2029-1.2007 and a nearby H4 61.8% Fib resistance at 1.1994 taken from the high 1.2092. For that reason, price may bounce lower from here.
To trade any bounce seen from 0.80, nonetheless, we would highly recommend drilling down to the lower timeframes to secure a tighter entry (see the top of this report for information on how to do this). This will likely help secure better risk/reward should price reverse before reaching 1.1950 (first take-profit target).
Data points to consider: German ZEW economic sentiment at 10am. US Housing figures at 1.30pm GMT+1.
Levels to watch/live orders:
- Buys: Flat (stop loss: N/A).
- Sells: 0.80 region ([waiting for a lower-timeframe entry signal to form is advised] stop loss: dependent on where one confirms this area).
GBP/USD
The British pound, as you can see, failed to sustain gains beyond the 1.36 handle during the early hours of London. This eventually transpired into a substantial move lower, intensified by BoE’s Gov. Carney’s recent comments, forcing the pair to trade sub 1.35 going into the closing bell. As you can see though the bears were unable to hold ground here, allowing H4 price to edge its way back above 1.35 this morning.
Looking over to the bigger picture, weekly price is seen loitering between a major resistance level drawn from 1.3683 and a broken Quasimodo line at 1.3371. With USDX weekly action trading beneath resistance at 11854, there’s a strong possibility GBP resistance will come into play sometime this week. On the daily timeframe, there’s not really much to add except that the USDX daily candles could possibly halt around demand at 11681-11749 (fuses with a channel support taken from the low 12352) should a downside (dollar) move take place.
Suggestions: Although yesterday saw a brisk 100-pip move lower, our desk is still biased to the upside for now. Aside from weekly USDX trading beneath resistance, both weekly and daily GBP charts show room to advance up to as far as 1.3683. For that reason, we will be keeping a close eye on the 1.35 handle today for possible buying opportunities. Ideally, we would like to see 1.35 retested as support (see black arrows) before pulling the trigger. Should this trade come to fruition, 1.36 will be the next port of call, followed by the major weekly resistance, thus giving us plenty of room to lock in substantial profits.
Data points to consider: US Housing figures at 1.30pm GMT+1.
Levels to watch/live orders:
- Buys: 1.35 region ([waiting for a H4 confirming bull candle to form following the retest is advised, preferably in the shape of a full, or near-full-bodied candle] stop loss: ideally beyond the candle’s tail).
- Sells: Flat (stop loss: N/A).
AUD/USD:
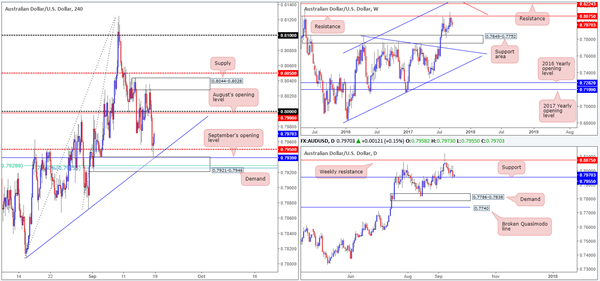
Coming in from the top this morning, weekly flow shows price extending losses from resistance at 0.8075. In the event that the bears remain in the driving seat here, the next port of call will likely be the support area coming in at 0.7849-0.7752. Sliding down to the daily timeframe, nevertheless, price recently engaged with a support level seen at 0.7955. A violation of this level would likely pressure the major back down to demand coming in at 0.7786-0.7838 (seen positioned within the walls of the noted weekly support area).
Across on the H4 timeframe, the large psychological level 0.80/August’s opening level at 0.7998 held firm in early trading, lifting price back up to supply at 0.8044-0.8028. It was from here though that things turned sour for the commodity currency as price stormed lower, breaking through 0.80 and the mid-level support at 0.7950, and coming within a pip of testing September’s opening level at 0.7939.
For those who read Monday’s report you may recall that we had a pending buy order set at 0.7939 with a stop loss positioned at 0.7918, meaning we missed the move by a pip! But well done to any of our readers who managed to pin down a position from here.
Suggestions: Near term, we feel the Aussie will continue to advance today at least until we reach 0.80. Therefore, for traders already long, you might want to consider reducing risk to breakeven around this point and taking some profits off the table. Still, considering the RBA takes to the stage in a few hours, you may be forced to reduce risk sooner than expected.
Other than our recent call, we do not see much else to hang our hat on at the moment.
Data points to consider: Australian monetary policy meeting at 2.30am. US Housing figures at 1.30pm GMT+1.
Levels to watch/live orders:
- Buys: Flat (stop loss: N/A).
- Sells: Flat (stop loss: N/A).
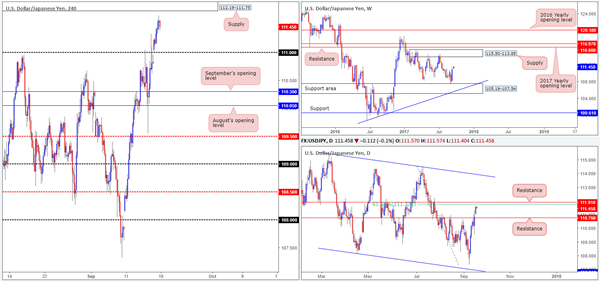
USD/JPY
As expected, the 111 handle failed to provide resistance on Monday, consequently opening up the path north to H4 supply at 112.19-111.75.
Apart from weekly price, which is seen trading from a support area coming in at 105.19-107.54, daily and H4 price show there’s a possibility for a pullback today/this week. On the daily timeframe, we have a nearby resistances planted at 111.91/61.8% daily Fib at 111.77. Alongside this, H4 price highlights the supply mentioned above at 112.19-111.75, which holds July’s opening level at 112.09, the 112 handle and the above said daily resistances within. This – coupled with the USDX weekly chart trading beneath resistance at 11854, makes the H4 supply a very interesting area indeed.
Suggestions: Keeping it simple this morning, we have set a pending sell order around the underside of H4 supply at 111.75 and a stop-loss order two pips beyond the area at 112.21. Assuming the order fills today, we’ll be eyeing the 111 handle as an initial take-profit target.
Data points to consider: US Housing figures at 1.30pm GMT+1.
Levels to watch/live orders:
- Buys: Flat (stop loss: N/A).
- Sells: 111.75 ([pending order] stop loss: 112.21).
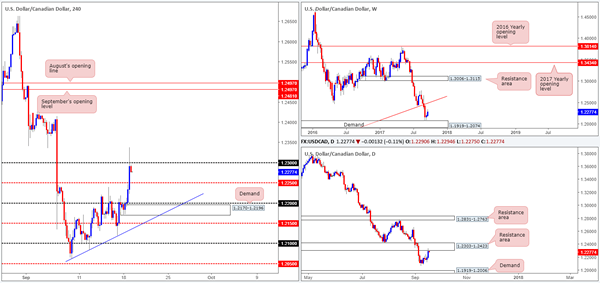
USD/CAD
The pair rose more than 100 pips during the US afternoon segment on Monday, following BoC Deputy Governor Tim Lane’s comments.
Given weekly price is currently seen trading from demand at 1.1919-1.2074, yesterday’s move should have not really come as too much of a surprise.
Apart from the rather brutal whipsaw through the 1.23 handle, we can see the recent move north also brought daily price into the jaws of a resistance area formed at 1.2303-1.2423. With this area having been a reasonable support back in July, as well as the unit currently entrenched within a steep downtrend at the moment, price is likely to find some active sellers residing here.
Suggestions: As you can probably guess from our notes, a long in this market is great from a weekly perspective, but precarious according to the daily timeframe. Although we believe H4 price will selloff back down to at least the mid-level support at 1.2250/H4 demand at 1.2170-1.2196 today, we are just not willing to short into potential weekly buyers. As such, we will remain on the sidelines today and look to reassess price action going into tomorrow’s open.
Data points to consider: US Housing figures and Canadian manufacturing sales m/m at 1.30pm GMT+1.
Levels to watch/live orders:
- Buys: Flat (stop loss: N/A).
- Sells: Flat (stop loss: N/A).
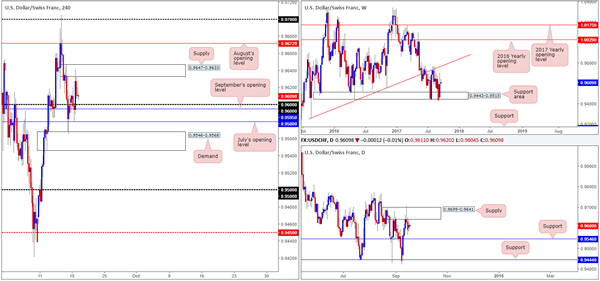
USD/CHF
Using a top-down approach this morning, the buyers and sellers on the weekly chart remain battling for position between a support area registered at 0.9443-0.9515 and a trendline resistance etched from the low 0.9257.Also of particular interest is weekly price over on the USDX is seen trading below resistance at 11854.Turning our attention to the daily timeframe, price remains capped by supply penciled in at 0.9699-0.9641. Should the Swissy continue lower, the next area of support on tap can be seen at 0.9546.
During the course of Monday’s sessions, the candles shook hands with supply coming in at 0.9647-0.9633, after finding a floor of support around September’s opening level at 0.9595. Despite yesterday’s movement, we are sure you’ll agree with us when we say H4 action is somewhat restricted at the moment. To the upside, not only do we have the current supply to contend with, there’s also August’s opening level at 0.9672 lurking nearby. To the downside, however, there’s the 0.96 handle, two monthly opening levels (September/July – 0.9595/0.9580), shadowed closely by demand pegged at 0.9546-0.9568.
Suggestions: With little ‘wiggle’ room for H4 price to move, and not much going on over on the bigger picture, we’ll place this market on the back burner for the time being and reassess structure tomorrow.
Data points to consider: US Housing figures at 1.30pm GMT+1.
Levels to watch/live orders:
- Buys: Flat (stop loss: N/A).
- Sells: Flat (stop loss: N/A).
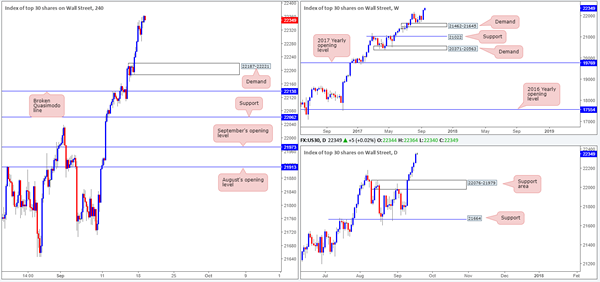
DOW 30
US equities extended Friday’s advance on Monday, reaching a record high of 22359. As highlighted in yesterday’s report, a pullback on the H4 timeframe could see price cross swords with the demand zone at 22187-22221. A violation of this area, however, likely opens the door for a test of the broken Quasimodo line at 22138, which happens to sit just above a daily support area fixed at 22076-21979.
Suggestions: With absolutely no resistances seen on the horizon, this is a buyers’ market right now as far as we’re concerned. As such, we’ll continue to watch both the above said H4 supports for possible buying opportunities should the index dip lower.
Data points to consider: US Housing figures at 1.30pm GMT+1.
Levels to watch/live orders:
- Buys: 22187-22221 ([waiting for a reasonably sized H4 bullish candle to form – preferably a full, or near-full-bodied candle – is advised] stop loss: ideally beyond the candle’s tail). 22138 ([waiting for a reasonably sized H4 bullish candle to form – preferably a full, or near-full-bodied candle – is advised] stop loss: ideally beyond the candle’s tail).
- Sells: Flat (stop loss: N/A).
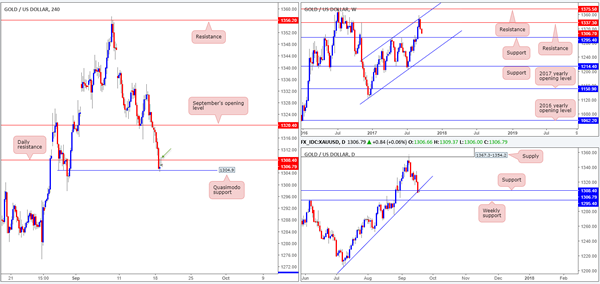
GOLD
As demand for havens fade, the yellow metal continued to press lower on Monday after a marginal close below September’s opening level at 1320.4 last week. Daily support at 1308.4, as you can see, was taken out, leaving H4 price free to challenge a H4 Quasimodo support level pegged at 1304.9.
The bounce from this H4 boundary has so far been unable to register anything noteworthy, as the recently broken daily support is now offering the market resistance. Over on the weekly timeframe, gold looks poised to extend losses this week, at least until we reach support marked at 1295.4.
Suggestions: We would not want to be buyers in this market right now! Not only do we have space for weekly sellers to stretch their legs, but now we also have resistance forming on the daily timeframe. In fact, H4 price has just finished printing a nice-looking bearish selling wick (green arrow) at the underside of this daily resistance. This could, given the position of current price on the bigger picture, be enough to short this market and target the above said weekly support level.
Aside from the current H4 Quasimodo support, the only risk we see by selling this market is USDX weekly price trading beneath resistance at 11854 – a dollar move lower could translate to a push higher on gold.
Levels to watch/live orders:
- Buys: Flat (stop loss: N/A).
- Sells: Possible short at current price (stop loss: 1310.1).