
Sample Category Title
Japan posts first trade surplus in six months
Japan recorded a trade surplus of JPY 130.9B in December, the first surplus in six months, driven by a 2.8% yoy rise in exports to JPY 9.91T. Imports also jumped, rising 1.8% yoy to JPY 9.8T.
However, exports to the two largest trading partners saw declines, with shipments to China falling by -3.0% yoy and to the US by 2.1% yoy.
On a month-on-month seasonally adjusted basis, exports rose 6.3% mom to JPY 9.44T. Imports increased 2.2% mom to JPY 9.47T, resulting in a seasonally adjusted trade deficit of JPY 33B.
For the entirety of 2024, Japan’s trade deficit narrowed significantly, shrinking by 44% from the previous year to JPY -5.33T. Exports reached a record high of JPY 107.09T, up 6.2%, bolstered by strong demand for vehicles and semiconductor-related products. Imports also rose by 1.8% to JPY 112.42T.
Tech Soap Opera
US equities were boosted by strong earnings and Trump’s AI push. Technology stocks led the rally, this time, and pushed Nasdaq 100 1.33% higher, the S&P500 hit a fresh intraday record high while gains in the Dow Jones were significantly lower. The index gained only 0.30% on Wednesday. Among the tech names, Netflix jumped around 10% on the back of strong earnings and traded at $999 a share – just short of the $1000 psychological mark. It’s probably a matter of time before Netflix claims the $1000 level provided that the company’s recent gains were driven by the strategic move to stream live events and has potential to fuel organic growth. Other than that, Nvidia, Oracle and OpenAI investor Microsoft – the names of the companies that are cited in the so-called Stargate project – gained. Nvidia extended gains by almost 4.5%, Microsoft gained more than 4% while Oracle jumped up to 10% but gave back a part of these gains to end the day with an almost 7% gain.
But Trump’s Best Buddy Elon Musk, probably irritated by the growing closeness between Donald Trump and OpenAI’s Sam Altman – his nemesis - wrote an X post saying that these companies don’t have the money to invest in Trump’s AI project. The post sparked concerns about Musk’s relationship with the White House, leading Tesla shares to drop 2%. The saga serves as a reminder that the next four years will be a constant watch of who’s aligned with whom, who’s feuding, who’s making waves, and who holds the power to steer things in their favor. I, for one, can’t wait."
Elsewhere, there was good from P&G’s latest quarterly report. The company revealed that its organic sales exceeded expectations. But what attracted investors’ attention is that the company’s Q4 sales growth came from higher volumes and not from price hikes, as the company didn’t raise the price of its products for the first time since 2019 according to Bloomberg. The latter gives an encouraging insight regarding the US inflation dynamics. Unfortunately, that doesn’t erase the risk of rising inflationary pressures on Donald Trump’s pro-growth policies, his tax cut and mass deportation plans and the tariffs – which are all potential inflation-boosters. Indeed, ‘US Republicans are in talks over raising the cap for state and local tax deductions’. And tax deductions are obviously bad for public finances. As such, the US 10-year yield is back to 4.60% after a decline to 4.53% earlier this week, while the US futures are slightly negative at the time of writing.
In Europe, the Stoxx 600 advanced to a fresh record high yesterday, on hope that the tariffs that the US would impose on Europe would be softer than the threats. So far, the Stoxx 600 gained around 4%, and outperformed the S&P500 – which posted around 3.60% since the beginning of the year. This is all very much in line with the expectation of convergence between the stocks of two continents due to the big valuation gap and on the expectation that the ECB will be more supportive of the economies than the Fed in the coming months.
In China, market sentiment is mixed. The relief over Donald Trump not announcing new tariffs on China during his inauguration didn’t last long. He said yesterday that he would impose 10% tariff on Chinese imports. Consequently, the Chinese equities were down yesterday and they are having hard time recovering on Chinese government’s freshly announced measures to boost sentiment. These measures include an increase to the amount of stocks that pension funds and insurers could buy, and encourages the listed firms to increase their share repurchases. Alas, the CSI 300 has erased most of its gains since this morning, and the shooting star pattern of today hints that sentiment remains bearish for Chinese equities.
In the FX, the US dollar rebounded yesterday on the back of higher US growth and potentially higher US inflation expectations. The EURUSD bounced lower after testing the 50-DMA. The European Central Bank (ECB) doves remain in charge of the market and cap the upside potential of the euro against the greenback. Across the Channel, Cable is also under pressure this morning as Rachel Reeves is being seriously challenged on her Budget in Davos. She said that she said that she was ‘absolutely relaxed’ about wealth creation. How lucky! The truth is investors are not as relaxed and they are losing confidence in Reeves’ growth-boosting plans. The sterling outlook remains negative, also backed by the expectation of two – and maybe more – rate cuts for this year.
Finally, crude oil is down for the sixth straight day on the back of Trump policy plans and a surprise 1 mio barrel build in US inventories last week. US crude is preparing to test a major support area, $75.20/75.40 range, that includes the 200-DMA and the major 38.2% Fibonacci retracement on the December to January rebound. A move below this zone will suggest a medium-term bearish reversal and hint at the possibility of deeper price pullback toward the $73.80 mark, the 50% retracement level.
Markets Eye Tariffs on the Horizon
In focus today
Markets remain closely focused on President Trump's actions during this first week of his presidency. He is expected to issue several executive orders building on his current momentum, leading to US news continuing to dominate the headlines as markets and world leaders alike are left navigating the implications.
In the euro area, we receive consumer confidence data for January, which will be very interesting. Following a continuous upward trend over the past two years, consumer confidence declined in both November and December. Since private consumption is anticipated to be the primary growth driver this year, consumer sentiment will be crucial for the economic outlook.
Norges Bank (NB) is highly expected to stay on hold at 4.5% today and signal that the first rate cut will most likely be delivered in March. December's core inflation likely relieves NB after November's spike, indicating continued disinflation. However, global rates, NOK, and oil prices suggest upside risk to December's rate path. NB is expected to remain vague on the outlook beyond March.
Overnight in Japan, we will receive both CPI and PMI data for December ahead of the Bank of Japan meeting early morning. Tokyo inflation data indicates price pressures have eased a bit in December. The economic recovery has been on track for a while and inflation close to target. We expect the BoJ will hike its policy rate by 25bp, which is also largely priced in by investors now.
Economic and market news
What happened yesterday
In the US, President Trump told Russian President Putin to reach a deal in Ukraine or be faced by increased sanctions from the US. This marks the first comment by the president on the war in Ukraine. Overnight Trump halted more than USD 300bn in US green infrastructure funding, while paving the way for a USD 500bn private-sector investment in AI infrastructure. He also disclosed that his administration was currently discussing a 10% tariff on China, as well as saying the EU will get tariffs due to a "troubling" trade surplus with the US.
Equities: Global equities rose yesterday, marking the seventh consecutive day of gains, with the MSCI World Index reaching a new all-time high. This is noteworthy given the widespread caution and predictions of volatility surrounding the inauguration of the US president, which have not materialised. Instead, there has been a steady increase, and those who reduced risk beforehand would have missed out on a 4% equity return, equivalent to half a year's average return in just seven days. This could serve as a reminder of not being too cautious about underweighting risk during periods when macroeconomic, microeconomic, and monetary policies are highly supportive, even when political issues dominate 90% of the media coverage.
In the US yesterday, the Dow was up by 0.3%, the S&P 500 by 0.6%, the Nasdaq by 1.3%, and the Russell 2000 was down by 0.6%. This morning presents a mixed picture in Asia. Earlier, Chinese stocks performed better following comments about increased public support for the equity markets, but this effect has since faded. US and European futures are slightly lower this morning.
FI: There was modest movement in global bond yields yesterday as 2Y and 10Y US Treasuries rose a few bp. In the European market there was also modest movement in bond yields. 2Y and 10Y German government bonds also just moved a few bp. Furthermore, the spread between the semi-core vs. Germany as well as periphery vs. Germany continue to tighten. Hence, the 10Y Italy vs. Germany spread is close to breaking through 100bp, while the 10Y French vs. German 10Y yield spread has stabilised and is slowly moving towards the 70bp-level. Finally, the Bund ASW-spread has also been rangebound at 0bp to -2bp.
FX: NOK rose and JPY lost ground yesterday ahead of monetary policy decisions from Norges Bank and Bank of Japan with the latter set to hike interest rates tomorrow. EUR/USD was steady yesterday just above 1.04.
GBP/USD Eyes Recovery, But Hurdles May Stall Progress
Key Highlights
- GBP/USD started a recovery wave from the 1.2100 zone.
- A major bearish trend line is forming with resistance at 1.2400 on the 4-hour chart.
- EUR/USD extended its recovery above the 1.0400 resistance.
- Gold rallied and broke the $2,750 resistance zone.
GBP/USD Technical Analysis
The British Pound found support at 1.2100 and recovered some losses against the US Dollar. GBP/USD climbed above 1.2150 and now attempts more gains.
Looking at the 4-hour chart, the pair was able to clear the 50% Fib retracement level of the downward move from the 1.2575 swing high to the 1.2099 low. It tested the 100 simple moving average (red, 4-hour) and remained well below the 200 simple moving average (green, 4-hour).
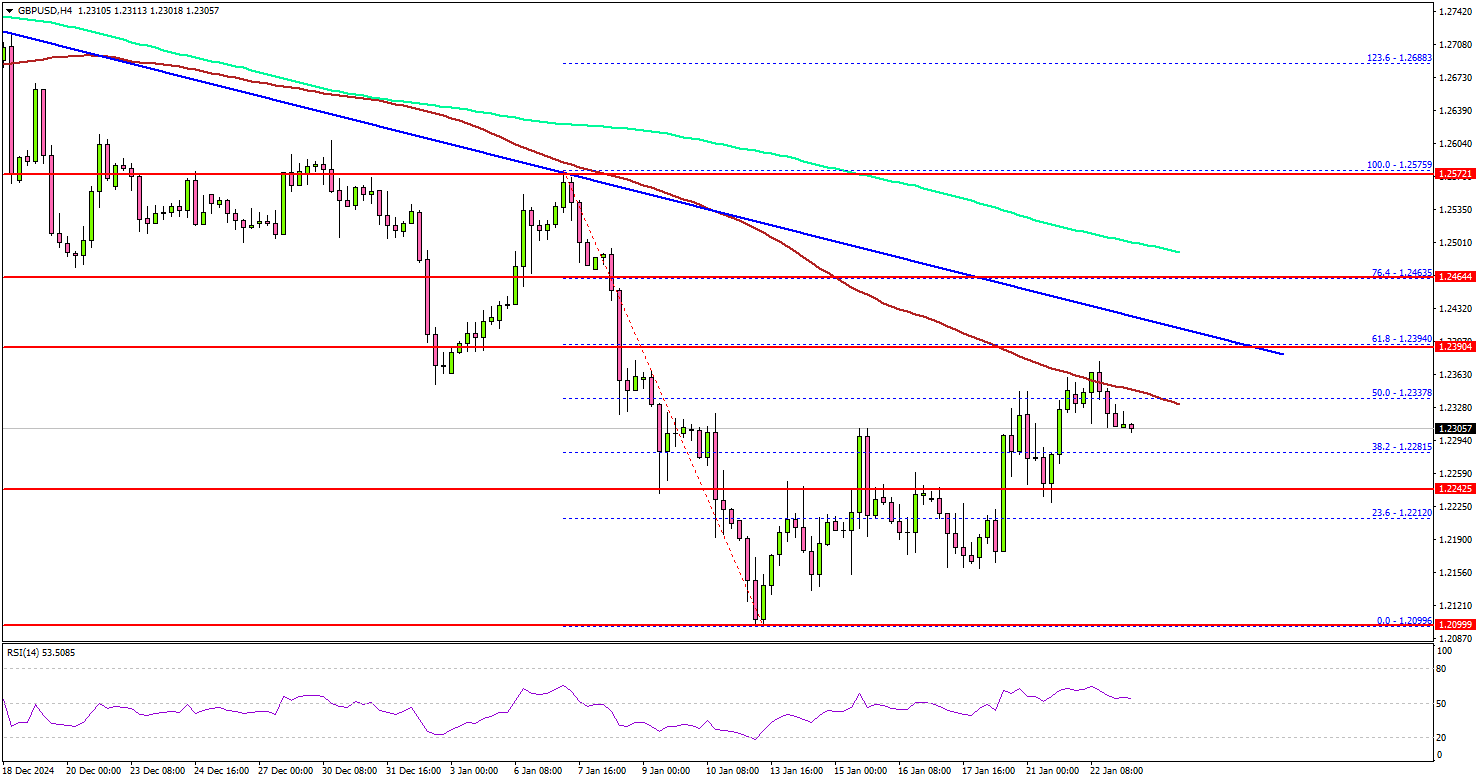
On the upside, the pair seems to be facing hurdles near the 1.2390 level. It is close to the 61.8% Fib retracement level of the downward move from the 1.2575 swing high to the 1.2099 low.
There is also a major bearish trend line forming with resistance at 1.2400 on the same chart. The next major resistance is near the 1.2440 level. A close above the 1.2440 level could set the tone for another increase.
In the stated case, the pair could even clear the 200 simple moving average (green, 4-hour) and rise toward the 1.2550 resistance. The main hurdle could be 1.2620.
On the downside, immediate support sits near the 1.2250 level. The next key support sits near the 1.2220 level. Any more losses could send the pair toward the 1.2150 level.
Looking at EUR/USD, the pair started a short-term recovery wave and there was a clear move above the 1.0400 resistance zone.
Upcoming Economic Events:
- US Initial Jobless Claims - Forecast 220K, versus 217K previous.
EURGBP Price Action Breakdown
The EURGBP exchange rate remained steady earlier despite the release of UK labor market data. While wage growth (excluding bonuses) came in slightly higher than expected, the more critical month-on-month rise in private sector pay, which the Bank of England (BoE) watches closely, was more subdued. This suggests the job market is gradually cooling, with expectations for wage growth now below 4%, according to the BoE’s recent survey. The data does not significantly change the outlook for the BoE, with a February interest rate cut still anticipated. In the short term, EURGBP may see upward movement as markets continue to factor in potential BoE easing and risks tied to the UK’s higher borrowing rates. At the same time, the euro could benefit from reduced fears of EU-targeted trade tariffs.
EURGBP – D1 Timeframe
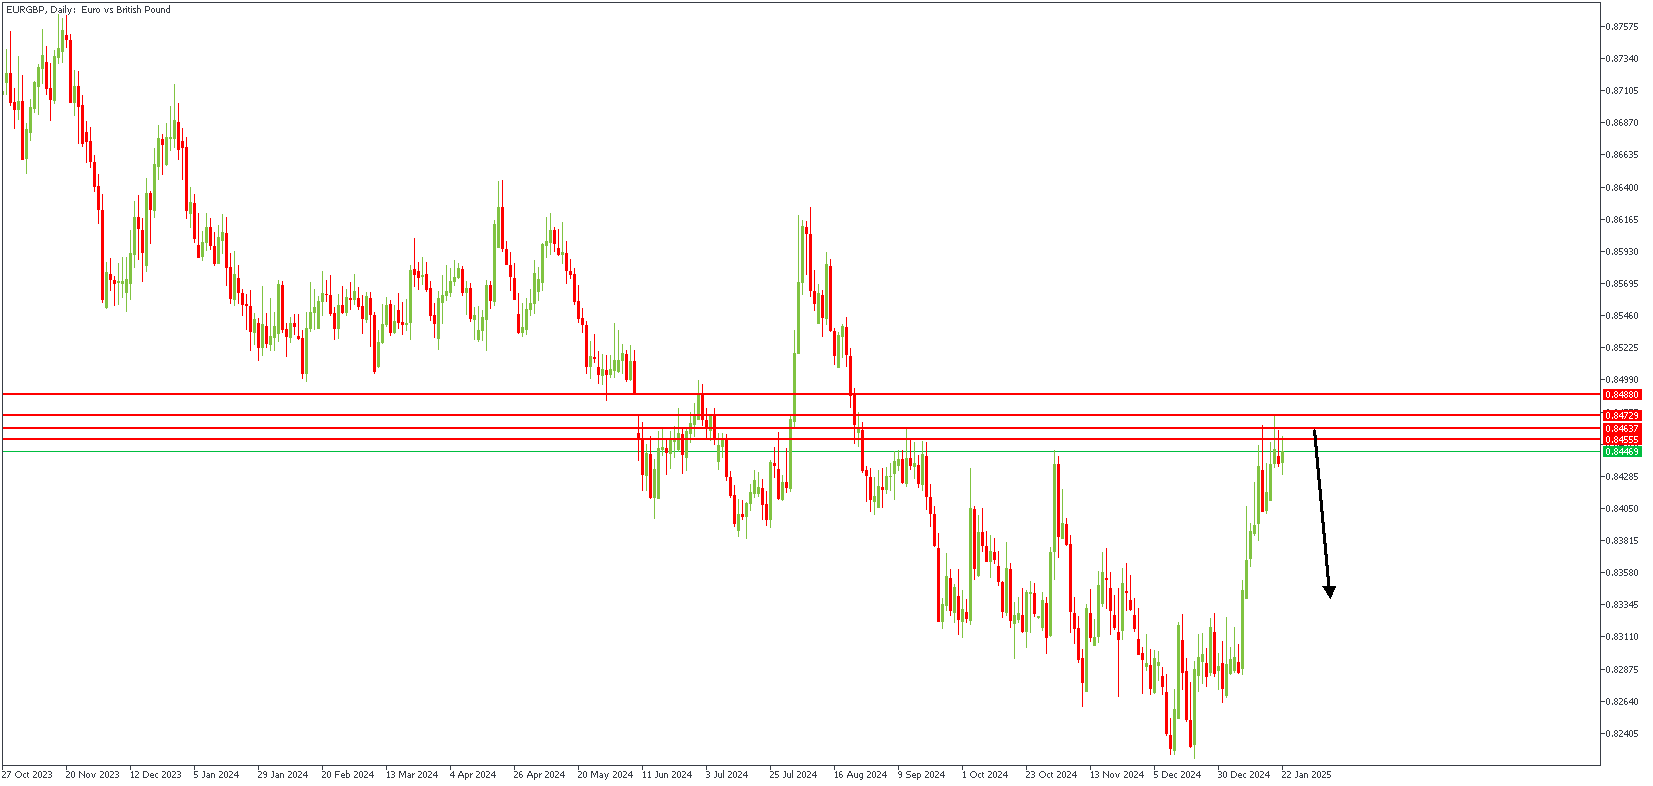
EURGBP on the daily timeframe chart has just bounced off the pivot area right after a liquidity sweep from the previous high. However, this is not expressly clear enough to build a proper sentiment, hence the need for a lower timeframe POV of the price action.
EURGBP – H3 Timeframe
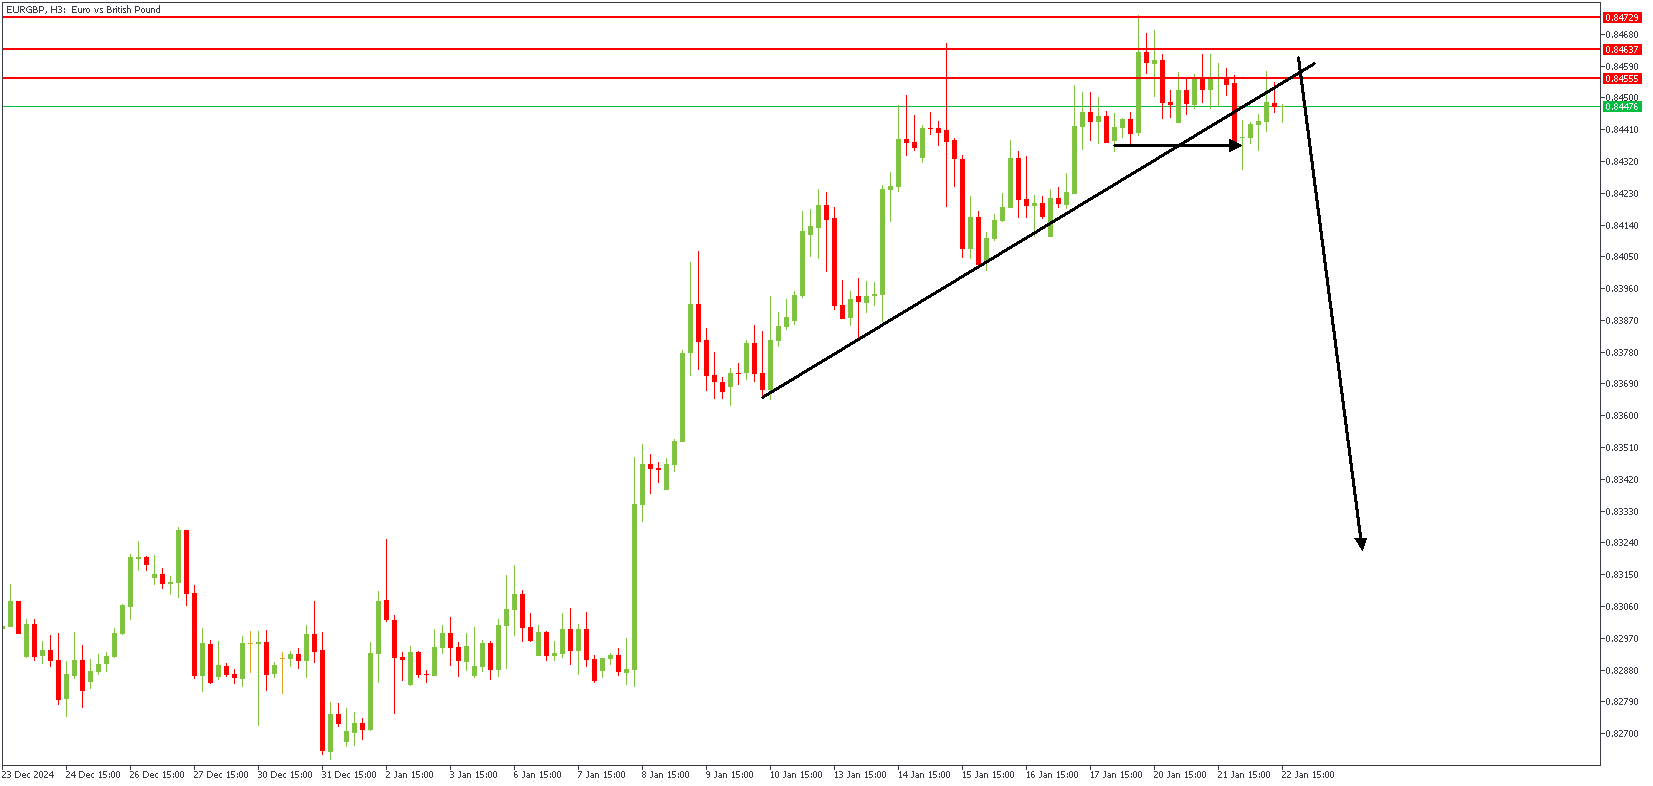
The trendline break and retest is a critical price action pattern for confirming a reversal. As seen on the 3-hour timeframe chart of EURGBP, we see that the reaction from the daily timeframe pivot region has now gone ahead and broken below the trendline support, holding prices up. In this light, a retest of the trendline often signifies the onset of a reversal – thus confirming the bearish sentiment in this case.
Analyst’s Expectations:
- Direction: Bearish
- Target: 0.84983
- Invalidation: 0.83065
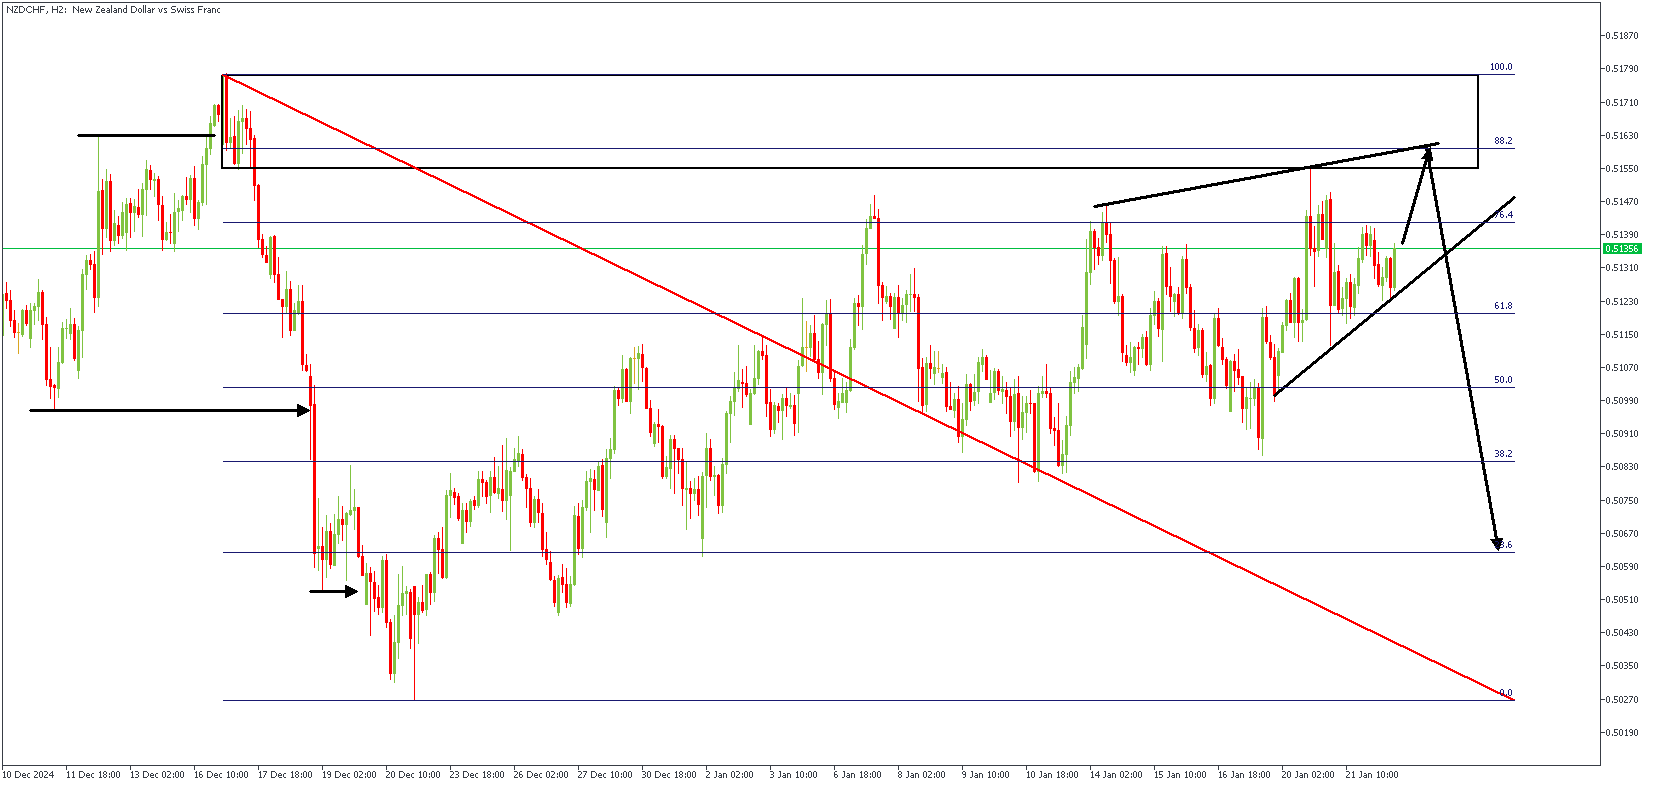
NZDCHF Price Action Breakdown
New Zealand's inflation data for the fourth quarter was released overnight, showing the headline CPI remained steady at 2.2%, slightly higher than the expected 2.1%. However, the non-tradable inflation index, which is closely watched, dropped more than expected to 4.5%, its lowest level since late 2021 and below the Reserve Bank of New Zealand's (RBNZ) previous forecast. This has increased the chances of a 0.50% interest rate cut by the RBNZ at their February 19 meeting, with further cuts expected later this year. In the short term, the NZDUSD pair may find some support above 0.570, helped by reduced concerns over US tariffs on China and technical factors favoring the NZD after recent heavy selling. However, the RBNZ's focus on supporting economic growth will unlikely provide much strength to the currency in the long run.
NZDCHF – H4 Timeframe
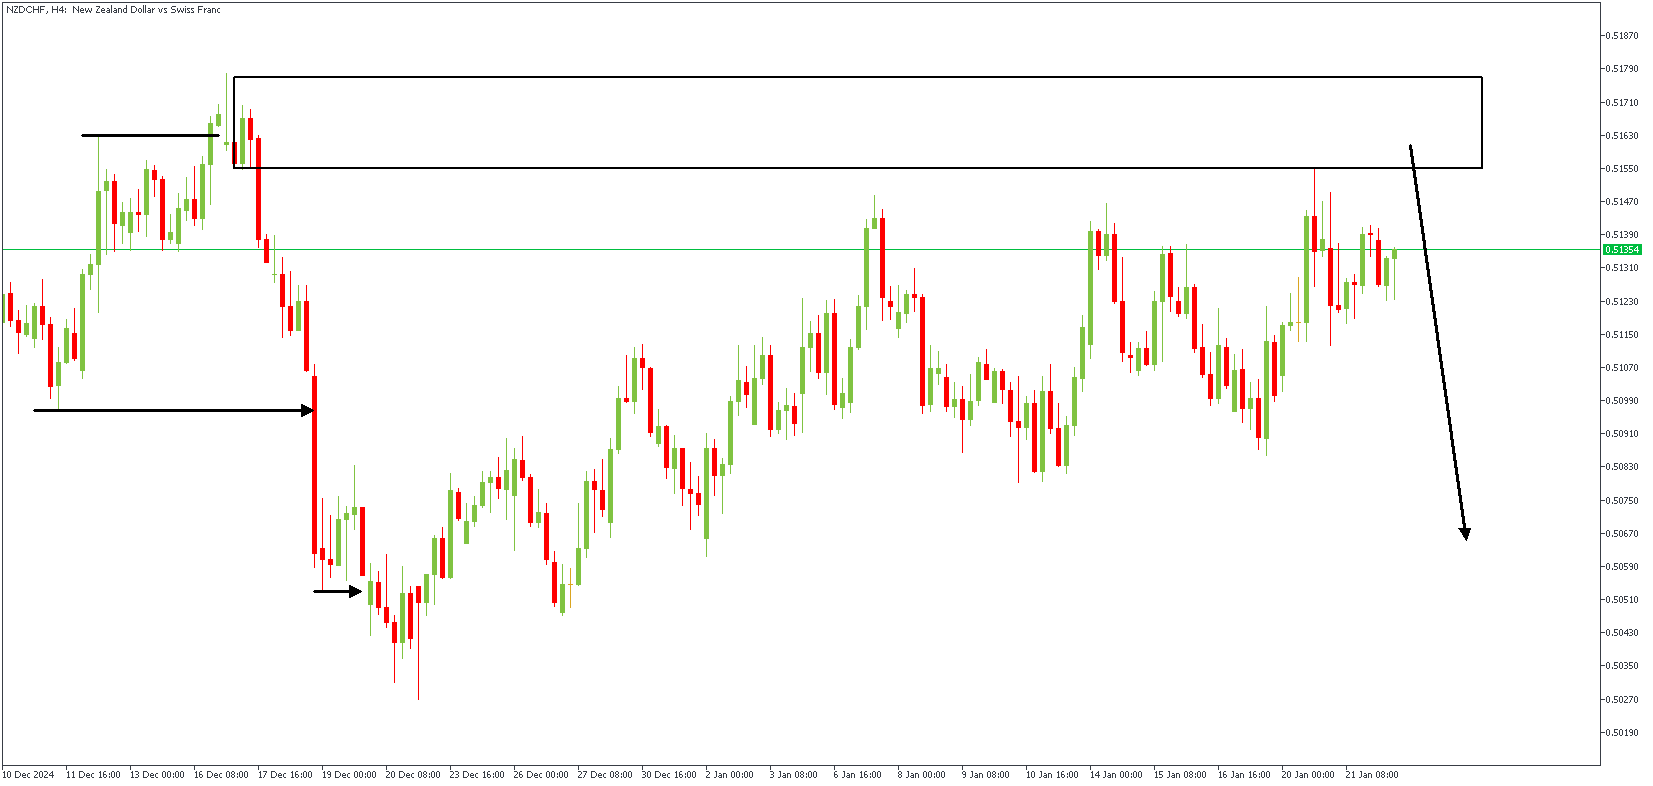
By now, I've written so many references to the SBR (Sweep-break-Retest) pattern that any avid reader of my work must be familiar with the pattern already. The SBR pattern shown on the 4-hour timeframe chart of NZDCHF begins with the sweep above the previous high, followed by the immediate break below the previous low. Based on this, the supply zone at the origin of the bearish impulse serves as the supply zone of interest. In addition, the Fibonacci retracement tool places the supply zone near the 88% level, further increasing the likelihood of a reaction from the highlighted supply area.
NZDCHF – H2 Timeframe
The two-hour timeframe chart of NZDCHF shows price consolidating within the wedge pattern presented near the 88% Fibonacci retracement level and the supply zone of the SBR pattern. The price should take a bearish turn from the said region on this ground.
Analyst's Expectations:
- Direction: Bearish
- Target: 0.50626
- Invalidation: 0.51837
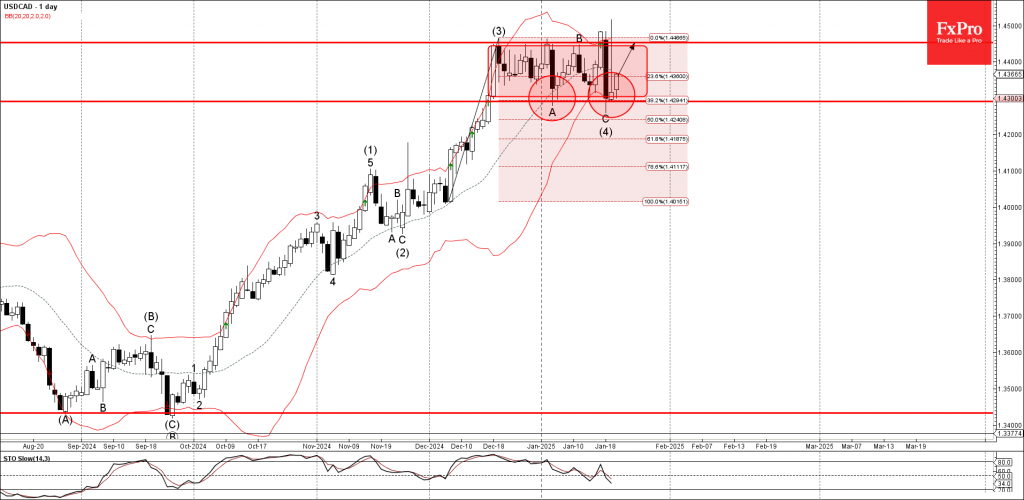
USDCAD Wave Analysis
- USDCAD reversed from pivotal support level 1.4290
- Likely to rise to resistance level 1.4455
USDCAD currency pair recently reversed up from the pivotal support level 1.4290 (lower border of the sideways price range from December, which stopped previous waves A and (4)).
The support level 1.4290 was also strengthened by the lower daily Bollinger Band and by the 38.2% Fibonacci correction of the previous upward impulse from December.
Given the clear daily uptrend, USDCAD currency pair can be expected to rise in the active impulse wave (5) to the next resistance level 1.4455 (upper border of the active sideways price range).
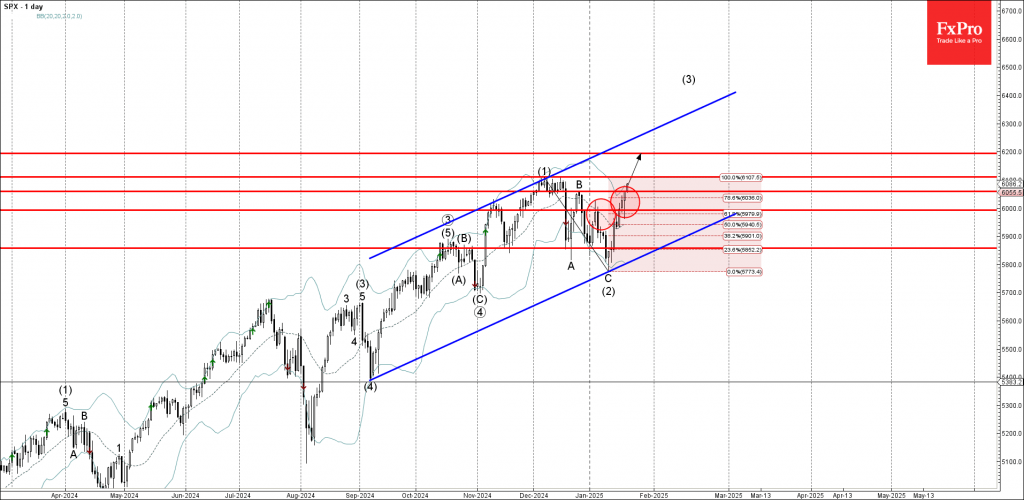
S&P 500 index Wave Analysis
- S&P 500 index broke resistance levels 6000.00 and 6060.00
- Likely to rise to resistance level 6110.00
S&P 500 index recently broke the resistance levels 6000.00 (top of the previous minor correction) and 6060.00 (top of the previous wave B from December).
The breakout of these resistance levels accelerated the active intermediate impulse sequence (3) from the start of January.
Given the strong multi-month uptrend, S&P 500 index can be expected to rise to the next resistance level 6110.00, top of the previous impulse wave (1).
USD/JPY Climbs, Markets Eye Trump
The Japanese yen is in negative territory on Wednesday. In the North American session, USD/JPY is trading at 156.53, up 0.68% on the day.
Trump shakes up dollar on Day 1
There are no key releases in the US today. On Thursday, the US releases unemployment claims and President Trump will address the World Economic Forum. Trump has vowed to levy tariffs on US trading partners, including China and the European Union. The financial markets are taking his threats seriously, and on Monday, his first day in office as President, Trump announced that he was delaying applying tariffs until Feb. 1. That announcement was a relief for the market and the US dollar fell sharply against many of the majors, although the yen failed to gain ground. Will Trump’s comments at the World Economic Forum shake up the financial markets?
Market awaits BoJ decision, core CPI
Investors are keeping a close eye on the Bank of Japan rate decision and December Core CPI on Friday. The central bank has hinted at a rate hike at the rate meeting and is widely expected to raise rates to 0.50%, which would be the highest level since the 2008 global financial crisis. After decades of deflation and an ultra-loose monetary policy, inflation has taken root and the BoJ is slowly moving towards normalization. The BoJ’s tightening cycle makes it an outlier among the major central banks, most of which are easing rates in response to lower inflation.
Japan’s core inflation rate has been steadily rising and is expected to climb to 3% y/y in December 2024, up from 2.7% in November which was a three-month high. The core rate, which is a key gauge of inflation trends, has remained above the BoJ target of 2% for over two years and is a key reason why the BoJ is tightening policy.
USD/JPY Technical
- USD/JPY has pushed above resistance at 155.51 and 156.24. Above, there is resistance at 156.97
- 154.78 and 154.05 are the next support levels
