Sample Category Title
EUR/USD Analysis: Reaches Medium Support
The common European currency continued its decline against the US Dollar, as it was expected on Monday.
On Tuesday morning the pair had already rebounded against the combined support of the medium pattern and the 200-hour SMA near the 1.1940 mark. Due to that reason a surge was expected.
However, the rebound is most likely going to be hindered by the 100-hour SMA until the pair reaches the weekly PP at 1.1999, which will be supported by the 55-hour SMA.
Most likely that combined resistance will force the rate to continue the decline.
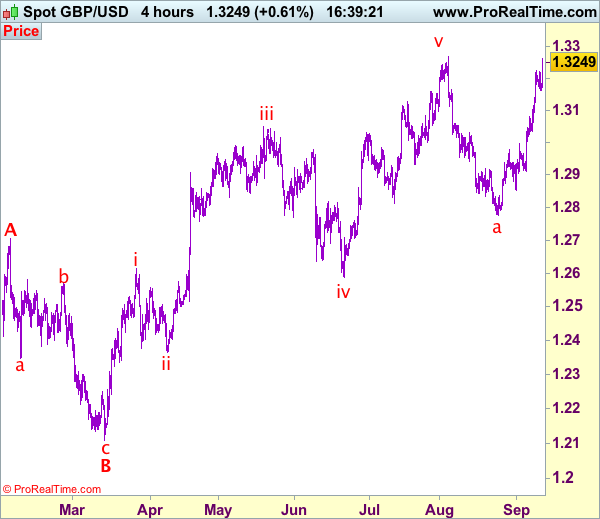
GBP/USD Analysis: Returns Near Monthly R1
The GBP/USD currency pair was characterised by a lack of volatility on Monday. The Pound tried to surpass the monthly R1 at 1.3208, but failed to do so for the second consecutive time. Subsequently, it was pressured down to the 55-hoour SMA which managed to support the rate effectively and return it near the aforementioned monthly R1.
Technical indicators suggest that this level should not be surpassed. Nevertheless, the UK CPI release scheduled at 0830GMT might introduce some changes to this assumption, especially if data turn our to be solid.
By and large, the appreciation that was apparent on Tuesday morning should be followed by a decline in price, setting the 100-hour SMA as a possible bottom target for this session.
USD/JPY Analysis: Tests 109.60
In line with expectations, the US Dollar surged against the Yen on Monday, resulting in a 117-pip appreciation within one day. The pair crossed several resistance levels, including the 200-hour SMA at 109.30, and has since showed lack of volatility during this morning. This minor consolidation phase might suggest that bulls have exhausted their upward force and thus give the dominant hand to bears instead.
The upside is guarded by the monthly PP and the upper boundary of a channel down circa 109.80—a level that might be a turning point for the rate. Subsequent direction is expected to be to the downside.
In case no massive events shake the market, the rate might continue its movement sideways for several hours before dashing towards the 100-hour SMA at 108.60.
XAUUSD Analysis: Set For More Losses
The bearish scenario came true on Monday for the yellow metal. The bullion's price fell below the 1,330 mark in the second half of the day's trading session.
If one looks at the hourly chart, a marvelous sight appears, as the metal faces no support as low as the 1,312.43 level on Tuesday morning. However, that is not likely going to be the support, which stops the decline of the commodity price.
It is more likely that the bullion will continue in the angle, in which it has been declining for the past few trading sessions, until it reaches the support of the dominant channel up pattern somewhere between 1,315 and 1,320.
USD/CAD: Canadian Housing Starts
The USD/CAD exchange rate rose modestly, as the Canadian property market revealed positive results for the month of August. The Greenback appreciated against the Canadian Dollar by 12 base points to the 1.2118 mark and continued climbing to touch the daily high of 1.2166.
The Canada Mortgage and Housing Corporation reported on Monday that the country's housing starts increased surprisingly to the seasonally adjusted yearly rate of 223K in August, following an upwardly revised figure of 221K registered in the prior month and holding above the 200K unit mark for eight months in succession. The surge was driven by higher multiple building construction, which managed to offset a decrease starts of single detached houses.
AUD/USD: NAB Business Confidence
The report showing weakened business confidence in Australia triggered a short-lived decrease in AUD/USD. The Aussie depreciated against the Greenback by 0.12% to be seen trading near the 0.8000 level and then retreated to the 0.8013 mark.
The NAB monthly survey revealed that Australian business confidence deteriorated unexpectedly to show the weakest reading of 2017, indicating the biggest concerns surrounding government policy, consumer demand as well as both wages and energy cost pressures. Moreover, the report showed most industries performed well, while retail sectors conditions continued to languish in negative territory. This trend is set to be watched closely to determine further growth trends.
GBP Better Bid As Brexit Bill Passes First Test
GBP edges higher ahead of inflation data
UK August inflation gauge is due for release alter today and is expected to have accelerated further in August. The consumer price index should print at 2.8%y/y, reflection both rising fuel price and a weak pound sterling. The core gauge, which excludes the most volatile components, should also overshoot the BoE target of 2% (median forecast of 2.5%y/y).
Given the fact the BoE made clear it is ready to tolerate higher inflations level as the negative effects of the Brexit are still to come, it is unlikely that the pound sterling appreciates sharply should inflation accelerates more than expected. Similarly, a disappointing reading won’t trigger a sell-off in the pound as it will only bring the gauges closer to the BoE’s target.
On the political side, Theresa May’s Brexit bill made an advance yesterday as lawmakers approved her bill, which is aiming at repealing the 1972 European Communities Act. This is just the beginning of May’s long journey to take Britain out of the EU.
The pound sterling was trading broadly higher on Tuesday morning amid an improving overall risk sentiment. The cable was up 0.20% to 1.3190 and getting closer to the next resistance that lies at 1.3267 (high from August 3rd). The pound rose the most against the Japanese yen as the pair rose 0.225% to 144.42.
ECB: Vice President Constancio set to speak
A week after the ECB meeting where the rates remained unchanged, ECB Vice President Constancio is going to hold a speech in Frankfurt. It is worth betting that most of the discussion will be around the Eurozone inflation and in particular the ECB difficulties to boost consumer prices.
Early September, Constancio already mentioned that the lack of inflation is set to persist in particular due to economic difficulties of the United States and geopolitical risks that should weigh on the global economic conditions. One could also say that massive QE does not have the expected results.
Most of the European government bonds in the front end of the yield curve are now trading a negative interest rate and it has been a while since investors are trading bonds for capital appreciation rather than yields because of free money. All of that is underpinning low inflation. Markets expect normalisation and higher asset yields but when the ECB removes it stimulus, good chances are that it could trigger massive losses in different asset classes.
Rumours are that the ECB said should be ready, at the next meeting late October, to reduce their massive asset purchase program from 60 billion euros a month to 20 or 40 billion euros a month. Markets are still largely bullish on the euro even though we do believe that markets are overly optimistic regarding the European Central Bank, for now.
Technical Outlook: EURGBP – Bears May Extend Towards Daily Coud Top After UK CPI Data Further Boosted Pound
Strong bearish acceleration extends into the third straight day and pressures psychological 0.9000 support (reinforced by 55SMA) after better than expected UK CPI numbers in August (2.9% vs 2.8% f/c and 2.6% in July) further boosted sterling.
Pullback from 0.9306 (29 Aug high) broke below 50% of 0.8742/0.9306 upleg (0.9025) and could extend towards key barriers at 0.8952 (top of rising daily cloud / Fibo 61.8% retracement) and 0.8926 (Fibo 38.2% of larger uptrend from 0.8312, 2017 low) on break below 0.9000 pivot.
Bear cross of daily Tenkan-sen / Kijun-sen supports bears, which may show signs of stall on approach to daily cloud as daily studies are oversold but without firmer reversal signal seen for now.
Res: 0.9025, 0.9071, 0.9090, 0.9125
Sup: 0.9000, 0.8952, 0.8926, 0.8875
Trade Idea: GBP/USD – Buy at 1.3170
GBP/USD – 1.3263
Original strategy :
Buy at 1.3125, Target:1.3300, Stop: 1.3065
Position: -
Target: -
Stop: -
New strategy :
Buy at 1.3170, Target:1.3370, Stop: 1.3110
Position: -
Target: -
Stop:-
Cable only eased to 1.3161 before finding renewed buying interest and sterling has surged again today, current breach of previous chart resistance at 1.3269 confirms medium term upmove has resumed, hence further gain to 1.3300-10 and later 1.3350-55 (50% projection of 1.2109-1.3269 measuring from 1.2774) would be seen, however, near term overbought condition should limit upside to 1.3390-00 and price should falter below 1.3440-50, bring retreat later.
In view of this, would not chase this rise here and would be prudent to buy sterling on subsequent pullback as said support at 1.3161 should limit downside, bring another rise later. Only below previous resistance at 1.3080-85 would defer and risk test of 1.3030-33 support, break there would suggest a temporary top is formed instead, risk correction to 1.2990-00 first.
Our preferred count on the daily chart is that cable's rebound from 1.3500 (wave (A) trough) is unfolding as a wave (B) with A ended at 1.7043, followed by triangle wave B and wave C as well as wave (B) has ended at 1.7192, the subsequent selloff is the larger degree wave (C) which is still unfolding with minor wave (III) of larger degree wave 3 ended at 1.1986, hence wave (IV) correction is in progress which could either be a triangle wave (IV) of a complex formation but upside should be limited to 1.3500 and price should falter well below 1.4000, bring another decline in wave (V) of 3 for weakness to 1.1500, then 1.1200.
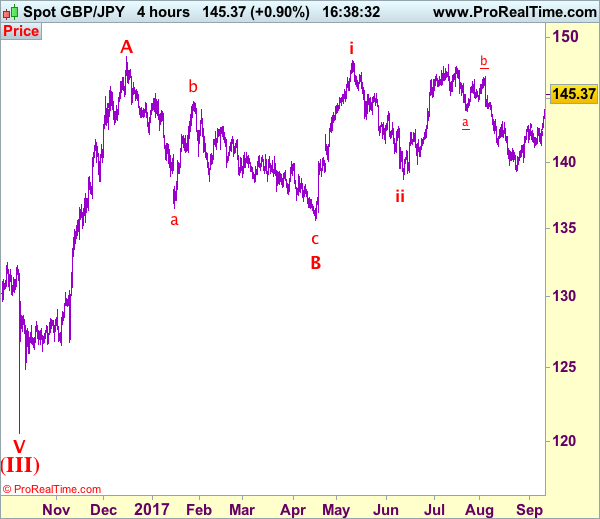
Trade Idea: GBP/JPY – Buy at 144.80
GBP/JPY - 145.60
Original strategy:
Buy at 142.45, Target: 144.45, Stop: 141.85
Position: -
Target: -
Stop: -
New strategy :
Buy at 144.80, Target: 146.80, Stop: 144.20
Position: -
Target: -
Stop:-
As sterling’s upmove has accelerated after breaking above resistance at 143.00, suggesting the entire a-b-c correction from 147.75 ha ended at 139.35 and bullishness remains for this rise from 139.35 to extend further gain towards resistance at 146.80 (b leg top), however, a sustained breach above there is needed to retain bullishness and extend further gain to 147.30-40 and later towards said recent high at 147.75 which is likely to hold from here due to near term overbought condition,
In view of this, we are looking to buy sterling on pullback but at a higher level as 144.80-90 should limit upside. Only below said previous resistance at 143.00 (tentatively wave i top) would abort and signal top is formed instead, bring weakness to 142.50, then 142.20-25, however, reckon support at 141.30-35 would remain intact, bring another rebound later.
Our preferred count is that larger degree wave V with circle is unfolding from 251.12 with wave (I) 219.34, (II): 241.38 and wave (III) is subdivided into 1: 192.60, 2: 215.89 (23 Jul 2008) and wave 3 ended at 118.87 earlier in 2009. The correction from there to 162.60 is wave 4 which itself is a double three and is labeled as first a-b-c ended at 151.53, followed by wave x at 139.03, 2nd a ended at 162.60, 2nd b at 146.75 and 2nd c leg of wave 4 ended at 163.00. Therefore, the decline from 163.00 to 116.85 is now treated as wave 5 which also marked the end of larger degree wave (III), hence wave (IV) major correction has commenced for retracement of the wave (III) from 241.38 and upside target at 183.95-00 (50% Fibonacci retracement of the wave (II) from 241.38) had been met, a drop below 160.00 would suggest wave (IV) has ended at 195.85, bring decline in wave (V) for initial weakness to 130 (already met) and 120.