Sample Category Title
Dovish Draghi Seeks To Weaken Euro
- Exchange rate the key focus of ECB press conference
- Rising currency makes reaching inflation target more problematic
- Important QE decisions should be ready by October but ECB goes softly softly
No major surprises from ECB
There were no major surprises from the ECB policy meeting. Probably, the most notable feature of ECB president Mario Draghi’s press conference was the extent to which he endeavoured – not entirely successfully- to talk down the Euro. However, Mr Draghi’s dovishness did produce a further softening of market interest rates as traders concluded that ECB policy will remain easier slightly longer.
There was no prospect of any immediate change in ECB policy today but there was some expectation that Mr Draghi would provide some indications in relation to future changes in the ECB’s policy stance, particularly in terms of alterations to and/or exit from its Asset Purchase Programme.
Mr Draghi did indicate that there were ‘very preliminary’ discussions on various topic relating to the winding down and eventual exit from QE at today’s ECB meeting but he emphasised these were mostly confined to asking questions about the pros and cons of various scenarios entailing different lengths and purchase amounts that might be considered in the future.
Mr Draghi is right in his assertion that amending or ending the ECB’s ‘current very substantial degree of monetary accommodation’ will entail many complex decisions but the tenor of his comments suggested the key issues occupying the ECB are not technical in nature.
The ECB seems anxious not to tighten prematurely either by altering its QE programme or policy interest rates or, more immediately, by hinting at future policy moves and causing market moves that lead to a tightening of financial conditions. The clear and present danger in this regard is the risk of a further sharp rise in the exchange rate of the Euro.
Euro strength major concern
Unusually, the ECB press statement highlights FX developments - in its opening assessment of the economic environment, noting that ‘the recent volatility in the exchange rate represents a source of uncertainty which requires monitoring with regard to its possible implications for the medium-term outlook for price stability’.
Of course, Mr Draghi and his colleagues aren’t really worried about volatility in the sense of exaggerated twoway moves or choppy market conditions. As diagram 1 below illustrates, the threat that concerns the ECB at present is that expectations of the looming announcement of tighter monetary policy could be the catalyst for a sharp trend move of the sort that has characterised the single currency’s performance since its inception.
Clearly, a rapid or large rise in the Euro’s exchange rate would weigh on economic growth and inflation in the Euro area. While Mr Draghi reiterated that the exchange rate is not a policy target, he added that it is very important for growth and inflation. Some sense of the difficulty a rapidly
rising exchange rate might pose is hinted at in the ECB’s latest projections which encompass a roughly 5% appreciation in the currency relative to the previous forecasts which were published in June.
Growth momentum is strong
Of course, the rise in the exchange rate is not the only notable development in the past three months. In the interim, a range of indicators have testified to the strength of the recovery in the Euro area at present. Economic growth in the second quarter of 2017 is now put at 2.3%, the fastest pace in six years and sufficient to support the strongest employment gains since early 2008. As a result, the ECB has revised up its GDP growth projection for this year from 1.9% to 2.3%. In other circumstance, it might be expected that momentum would build further in coming years but the ECB has maintained its previous estimates of 1.8% in 2018 and 1.7% in 2019.
Although domestic spending is expected to be stronger than was envisaged three months ago and is enhanced by stronger ‘real’ purchasing power, this is offset by a softening in export growth. As the ECB has not altered its outlook for world growth, this pullback is presumably due to the impact of a stronger Euro. Indeed, the press statement adds ‘developments in foreign exchange markets’ to its list of downside risks to growth.
Strong euro hinders return to 2% inflation
More fundamentally, from an ECB perspective, a rising exchange rate reduces its capacity to bring inflation back to target. The new projections are unchanged for 2017 but show a downward revision of 0.1% in each of the next two years to leave inflation at 1.2% in 2018 and 1.5% in 2019. Moreover, the new projections show a slightly larger downgrade to underlying inflation in 2019 from 1.7% to 1.5%, leaving this measure falling well short of the ECB’S target of ‘below, but close to, 2%’.
The coincidence of a strong economy and a strong exchange rate is not unusual but it does put Mr Draghi and his colleagues in a very awkward position at present. ECB research finds that a 1% movement in the exchange rate prompts a movement in consumer prices in the opposite direction of about 0.1% within a year and 0.2-0.3% within three years. In a world characterised by low inflation, further significant FX appreciation might be seen as threatening to prevent the ECB from reaching its inflation any time in the foreseeable future.
Some rationale for a particularly dovish stance in these circumstances might be suggested by ECB research (referred to by Mr Draghi) that suggests the impact of exchange rate movements on inflation varies depending on the cause of the currency move. This research finds that ‘when a monetary policy shock drives the nominal exchange rate, a relatively larger pass-through tends to be generated.’ (ECB bulletin 7 2016, p47).
This research would suggest that ECB policy ‘surprises’ are likely to have a particularly marked impact on inflation and would appear to argue for a ‘softly, softly‘ approach at present. Reflecting such considerations, Mr Draghi hinted that there was some significant discussion at today’s meeting as to the precise factors behind the Euro’s recent strengthening. A sense that opinions might differ on this issue might be hinted at in Mr Draghi’s remark that such considerations needed to take account of ‘the credibility of monetary policy’.
It might be an exaggeration to say the ECB press conference was all about the exchange rate, but it is clear that it is posing Mr Draghi and his colleagues particularly tricky questions at present. This is also postponing any prospect of clarity on when and how quickly the ECB will begin to exit from its QE programme. Mr Draghi indicated that there hadn’t been any discussions today on important issues such as the sequencing of policy changes or possible changes to the features of the Asset Purchase Programme such as issuer or issue limits.
These remarks may have been intended to emphasise that the point of departure remains some time away but, in an important sense, these sorts of uncertainty may be adding to pressure on the Euro as markets may have already priced the currency on the expectation of a looming first step away from QE.
If, as Mr Draghi suggested, many of the important decisions should be agreed by the ECB’s October policy meeting on October 26th, the reaction of interest rate or FX markets may not be that dramatic. Traders should be able to cope with the impact of a gradual phasing back of QE during 2018 to be followed by modest rate rises that wouldn’t commence until ’well past the horizon of our net asset purchases’.
Is ECB moving too slow?
However, problems could arise if the ECB delays too long in setting out some broad contours for its exit path. Such problems would be aggravated if Eurozone growth or inflation were to strengthen in coming months and these or other factors were to drive the Euro exchange rate higher. It is entirely understandable that the ECB would want to prepare properly for its exit from QE but there is a risk that in trying to be too careful, it ends up having less room for manoeuvre than it wants.
Mr Draghi repeatedly urged the need for ‘patience’, a commodity frequently in short supply in markets. However, he also indicated that he expected the ECB’s inflation target would be met by 2020- an outcome that should be revealed when formal forecasts for that year are produced in December.
In coming months, markets may begin to debate whether such an outcome would warrant a material shift in the required monetary stance of the ECB- perhaps on a larger scale than the ECB now envisages. Such developments could prompt notably more volatile conditions in FX and interest rate markets than either the ECB or investors now envisage
Risk Aversion Creeping Back In As USD Tumbles
- Traders seek shelter with weekend risk heightened by North Korean holiday;
- USD hits lowest since start of 2015;
- EURUSD higher as Draghi’s hawk is doves clothing act falls short;
- Safe haven Gold breaks above $1,350.
Risk aversion is creeping back into the markets on Friday as traders prepare for what could be another troubling weekend in the ongoing stand-off between the US and North Korea.
Weekend risk has been ramped up in recent months as tensions between the two countries has escalated. As recent as last weekend, a hydrogen bomb test from North Korea triggered safe haven flows at the open on Monday which caused a number of markets to gap at the open. It’s this that traders are concerned about, especially as the size of such gaps will be much larger should the outcome of these tests lead to a significant escalation.
What makes this weekend more concerning than others is that North Korea celebrates founding day on Saturday, which would be the perfect opportunity for it to display a show of strength, as it did on the same day last year. With that in mind, it will be interesting to see just how people trade into the close and whether the flight for safety starts early this week. We’re already seeing signs of this today with safe havens Gold, yen and the Swiss franc all higher. Equity markets are also a little mixed in a sign that risk appetite remains weak.
The US dollar is on course for its worst week since the end of June, down more than 1.5% at the moment and around 0.5% on the day. Traders have been bearish the dollar for the entire year so far and rather than ease up, this looks to have intensified this week. The US dollar index had stabilised around 92-93, which has repeatedly been a support zone since the start of 2015, but this eventually caved yesterday and more losses have followed.
Mario Draghi’s failed efforts to stem the euros rise against the dollar on Thursday with dovish remarks – well, as dovish as he could manage without intentionally misleading – has made matters worse for the greenback. With key technical levels now broken in a number of dollar pairs, I struggle to see any reason to be bullish on the currency. While other central banks are becoming less dovish, or in the case of the Bank of Canada more hawkish, the Fed is doing the opposite and the greenback is in freefall.
There is a danger when there’s such a broad market consensus such as this, that the market is primed for a correction, but I don’t think we’re quite there yet. Gold and other commodities are certainly feeling the benefit of the dollar’s decline and with the yellow metal now trading above $1,350 for the first time in over a year, further upside may lie ahead, with the next test coming around $1,375.
Draghi Tries To Jawbone EUR, But The Currency Does Not Obey
Yesterday, the European Central Bank decided to keep all three of is interest rates unchanged as was widely expected. In the statement accompanying the decision, the Bank left untouched the sentence saying that the QE can be expanded in needed, which was also more or less expected following last week's sources. EUR/USD slid only 30 pips at the time of the release, but surged less than an hour later on Draghi's comments at the press conference following the decision.
At the conference, Draghi tried to jawbone the common currency several times. He noted that the recent volatility in the euro requires close monitoring, and that it is a source of uncertainty. When asked by journalists if the recent appreciation of the bloc's currency has tightened financial conditions, the President replied that it has “unquestionably” done so, but conditions remain supportive. As for the QE program, everything he said was more or less in line with what last week's sources suggested, expect from the part that the ECB should be ready to take the bulk of a decision in October, which may be the main reason behind the euro's surge.
EUR/USD shot up at the time of the conference, broke above the psychological hurdle of 1.2000 (S1), and continued to trade north even in the aftermath of the event. During the Asian morning Friday, the pair hit resistance fractionally below 1.2100 (R1). The price structure continues to suggest a medium-term uptrend and thus we would expect a clear break above 1.2100 (R1) to open the way for our next resistance of 1.2170 (R2).
Now looking ahead, our own view is that the Bank may indeed slim down its monthly purchases to EUR 40bn in October, but we expect it to keep intact the aforementioned sentence with regards to QE extension, in order to maintain flexibility to adjust if unpredicted risks materialize. Basically, we expect the Bank to act in a similar manner as it did in December. The risks to that view relate to the euro, which if it continues to appreciate in such a rapid pace may weigh further on the inflation outlook and thus, prevent policymakers to take a decision at the October gathering.
As for today's events:
The most noteworthy data set we get is Canada's employment report for August. Expectations are for the unemployment rate to have remained unchanged, while the net change in employment is expected to have risen. On Wednesday, the BoC decided to hike rates by another 25bps, while it noted that future policy decisions will be guided by incoming economic data and financial developments as they inform the outlook for inflation. They also noted that consumer spending remains robust, underpinned by continued solid employment and income growth. As such, investors are likely to pay extra attention to this report as they try to assess the probability for another rate hike in 2017. At the time of writing, that probability is around 60% according to Canada's Overnight Index Swaps, and could rise further if the jobs report shows another month of stellar employment gains.
USD/CAD continued trading south yesterday, breaking below the support (now turned into resistance) barrier of 1.2120 (R1), marked by the low of the 18th of June 2015. The medium-term outlook of the pair remains negative and thus, we expect the dip below the 1.2120 (R1) hurdle to set the stage for extensions towards the psychological zone of 1.2000 (S1). The catalyst for such a slide may be a strong employment report from Canada today.
We also get the UK industrial production for July. IP is expected to have slowed in monthly terms, but to have accelerated on a yoy basis, as the expected monthly print is still higher than the one dropping out of the calculation.
We have two speakers on the agenda: RBA Governor Philip Lowe and Philadelphia Fed President Patrick Harker.
EUR/USD
Support: 1.2000 (S1), 1.1950 (S2), 1.1880 (S3)
Resistance: 1.2100 (R1), 1.2170 (R2), 1.2250 (R3)
USD/CAD
Support: 1.2000 (S1),1.1920 (S2), 1.1800 (S3)
Resistance: 1.2120 (R1), 1.2260 (R2), 1.2335 (R3)
EUR/JPY Elliott Wave Analysis
EUR/JPY - 129.83
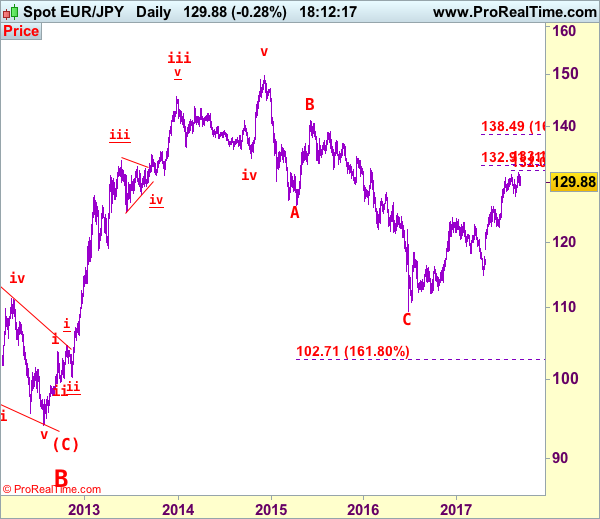
Although the single currency recovered after finding good support at 129.37 this week, as renewed selling interest emerged at 131.09 yesterday and euro has retreated again, retaining our view that further consolidation below recent high at 131.71 would take place and as long as 131.09 holds, mild downside bias is seen for test of said support at 129.37, break there would bring test of previous resistance at 129.18, below there would suggest top is possibly formed, bring further fall to 128.45-50, break there would bring retracement of recent rise to 128.00-10, then towards previous support at 127.56 which is likely to hold from here. In the event euro drops below 127.56, this would signal correction of recent upmove has commenced and bring subsequent fall to 126.45-50 and later towards previous resistance at 125.82 which is likely to remain intact.
The daily chart is labeled as attached, early selloff from 169.97 (July 2008) to 112.08 is wave (A) of B instead of end of entire wave B and then the rebound from there to 139.26 is wave (B), hence, wave (C) has possibly ended at 94.12 with a diagonal triangle as labeled in the daily chart, hence upside bias is seen for further gain. Recent rally above indicated retracement level at 116.69 (50% Fibonacci retracement of the intermediate fall from 139.26-94.12) adds credence to this view and signal major reversal has commenced but first leg of this wave C has possibly ended at 149.79, hence wave 2 has commenced with wave A ended at 126.09, followed by wave B at 141.06, wave C commenced and could have ended at 109.49, above 126.00 would add credence to this view, then headway to 130.00 would follow.
On the upside, whilst recovery to 130.50-60 cannot be ruled out, said resistance at 131.09 should remain intact, bring another retreat later. A daily close above 131.09 would suggest the retreat from 131.71 has ended instead, bring retest of this level, however, euro needs to penetrate this resistance to revive bullishness and signal the major rise from 109.49 low (2016 low) has resumed for headway to 132.00-10, then 132.50-60 but overbought condition should prevent sharp move beyond 133.10–15 (61.8% projection of 122.40-131.40 measuring from 127.56) and price should falter well below previous chart resistance at 134.59, bring retreat later.
Recommendation: Sell at 130.50 for 128.50 with stop above 131.50.
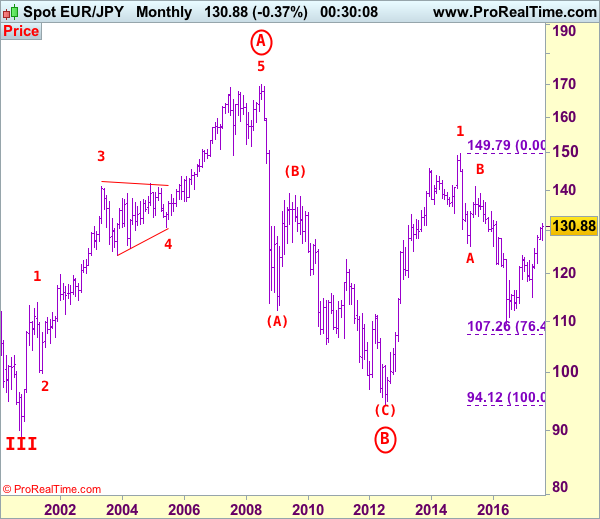
To re-cap the corrective upmove from the record low of 88.93 (18 Oct 2000), the wave A from there is subdivided as: 1:88.93-113.72, 2:99.88 (1 Jun 2001), 3:140.91 (30 May 2003), 4:124.17 (10 Nov 2003) and 5 ended at record high of 169.97 (21 Jul 2008). The brief but sharp selloff to 112.08 is viewed as a-b-c x a-b-c wave (A) of B. The subsequent rebound to 139.26 is (B) of B and (C) of (B) has possibly ended at 94.12 and in any case price should stay well above previous chart support at 88.93, bring rally in larger degree wave C towards 150.00.
USD/CHF Elliott Wave Analysis
USD/CHF – 0.9470
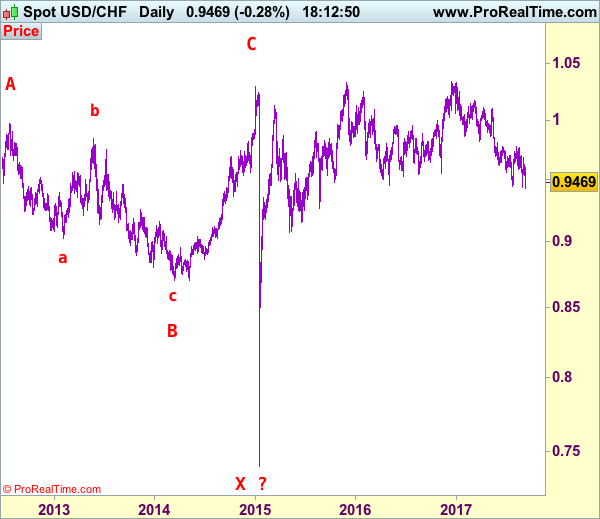
Although the greenback has retreated after running into resistance at 0.9680 last week and initial downside risk of marginal weakness towards 0.9400, loss of near term downward momentum should limit downside and bring rebound later. Above 0.9570 would bring rebound to 0.9615-20, break there would encourage for test of indicated resistance at 0.9680 but break there is needed to suggest low is formed, bring a stronger rebound towards resistance at 0.9773. Looking head, only break of this level would provide confirmation and bring retracement of recent decline to resistance at 0.9808 but previous support at 0.9859 should hold from here.
Our preferred count on the daily chart is that early selloff to 0.9630 is an end of the larger degree wave III and major correction is unfolding from there with a leg ended at 1.2298 (Nov 2008 with (a): 1.0625, (b):1.0011 and (c):1.2298), wave b ended at 0.9910 with (a): 1.0370, (b): 1.1967, (c): 0.9910. The rise from there to 1.1730 is the wave c which also marked the end of wave IV and wave V has possibly ended at 0.7068.
On the downside, whilst marginal weakness from here cannot be ruled out, reckon downside would be limited to 0.9390-00 and reckon 0.9350 would hold. If decline gathers momentum, this would indicate medium term erratic decline from 1.0344 top (formed back in late 2016) is still in progress and may extend further weakness to 0.9300, however, loss of downward momentum should prevent sharp fall below 0.9250-60 and 0.9200-10 should hold, risk from there has increased for a rebound to take place later.
Recommendation: Stand aside for this week.
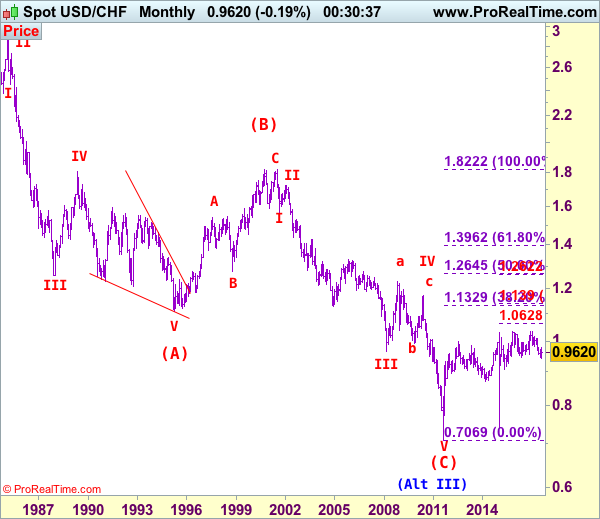
Dollar's long-term downtrend started from 2.9343 (Feb 1995) and it was unfolding as a (A)-(B)-(C) with (A): 1.1100, (B): 1.8310 (26 Oct 2000), then followed by another impulsive wave (C) with wave III ended at 0.9630 (Mar 2008). Under this count, correction in wave IV has possibly ended at 1.1730 and wave V already broke below support at 0.9630 and met indicated downside target at 0.7500 and 0.7400. The reversal from 0.7068 suggests the wave V has possibly ended and the breach of resistance at 0.9595 add credence to this view and indicated upside target at 1.0000 had been met, however, the sharp retreat from 1.0296 to 0.7401 suggests choppy trading would be seen but price should stay above said record low at 0.7068.
Forex Technical Analysis: EUR/USD, USD/JPY, GBP/USD
EUR/USD
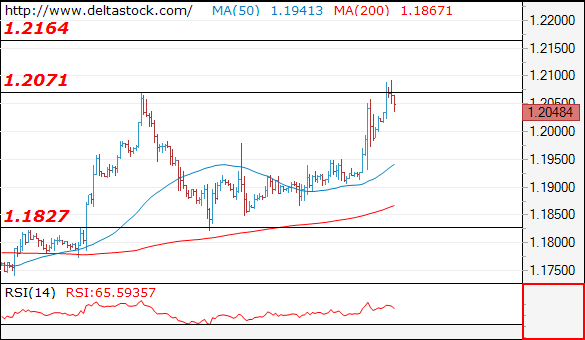
Current level - 1.2048
The break through 1.1985 resistance unleashed a renewal of the uptrend and the bias is positive above 1.1950, for an attack of 1.2160 area.
| Resistance | Support | ||
| intraday | intraweek | intraday | intraweek |
| 1.2100 | 1.2160 | 1.1950 | 1.1830 |
| 1.2160 | 1.2500 | 1.1830 | 1.1660 |
USD/JPY
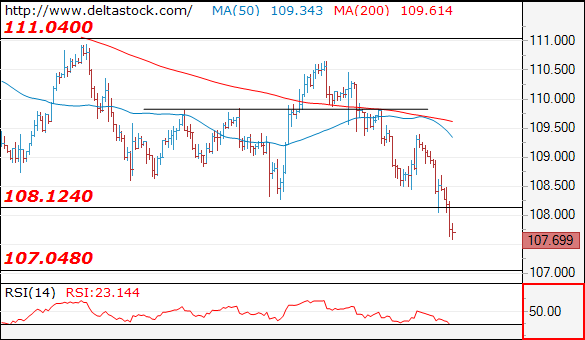
Current level - 107.69
The pair broke through 108.12 low and the bias is bearish, for a slide towards the main target at 107.00.
| Resistance | Support | ||
| intraday | intraweek | intraday | intraweek |
| 108.12 | 111.00 | 107.00 | 107.00 |
| 109.50 | 112.20 | 107.00 | 105.50 |
GBP/USD
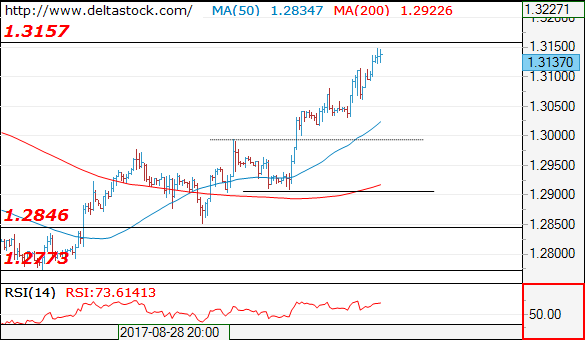
Current level - 1.3137
The uptrend has reached the resistance around 1.3157 and the bias is still positive, as only a violation of 1.3060 will signal a reversal of the upmove. A dive below the latter will challenge 1.2990 and 1.2910.
| Resistance | Support | ||
| intraday | intraweek | intraday | intraweek |
| 1.3157 | 1.3157 | 1.3060 | 1.2773 |
| 1.3190 | 1.3260 | 1.2990 | 1.2606 |
US Futures Lower | Gold Touched Year High
Sterling Strength and Economic Data Out of Sink
Tapering Ahead
US futures and European markets are trading lower as investors are anxious about the impact and costs of Hurricanes Harvey, Irma and Jose. The Japanese final GDP q/q which missed the forecast isn't helping the sentiment either. The Chinese trade balance also took a wrong turn choking the bulls further.
Sterling Strength and Economic Data Out of Sink
Many thought that the weakness in the British pound would not only stimulate the export but also the growth for the UK economy. That could have been the case if Brexit wasn't the major hurdle and given that the politicians have returned from their holidays, they are still stuck on the very same issue as before they left. The British Chamber of Commerce has also acknowledged that the weakness in the pound is not providing the kind of tailwind which was initially expected. The Consumer spending is simply abated and inflation is outpacing the job growth, an environment which is toxic for the economy. The UK GDP is going to see less colour from the net trade and this would be the primary confirmation of how a lower currency failed to add the amount of value which was widely expected.
The UK soft data, the PMI's and business survey, initially confirmed that investors can weather the Brexit storm relatively better, but the current trend in the manufacturing and industrial production numbers is worrisome. At 09.30 BST, we have the manufacturing production number and the forecast is relatively more optimistic with the reading of 0.3%. If you look at the construction output and industrial production, then the picture becomes duller and the forecast for today for both numbers (0.3% and 0.2% respectively) isn't something to cheer about.
Do not be fooled by the strength of the Sterling-dollar which is trading above 1.31, a lot of this is simply the weakness in the dollar. The price is retracing from its highs and if it breaks the support of 1.31, the move to the level of 1.3060 is highly likely.
Tapering Ahead
If you think that Draghi has failed to keep the lid on the euro's strength in his press conference yesterday, then certainly you are making a mistake. Draghi certainly has the ability to punch above his weight and we know that very well. The policy maker did make a reference to the currency's volatility and exchange rate. However, the primary and significant focus remained towards more pressing affairs such as domestic strength. The Euro dollar algos went bananas as Draghi started to speak despite the fact that the president was reluctant to spell out the month, date and pace of the tapering process.
Technical Outlook: WTI Oil – Daily Cloud Top Should Contain Correction Before Bulls Resume
WTI oil price eased below $49.00 on Friday after repeated upside rejections at $49.40/31 in previous two days and Thursday’s action being shaped in Doji, signaling indecision.
In addition, strong build in crude inventories last week added to pressure on oil price which was inflated by increased demand for oil on restart of Texas refineries which were shut on Hurricane Harvey.
Current easing could be seen as correction of larger bull-leg from $45.57 on overbought studies and ahead of attack at strong barriers at $49.62 (200SMA) and psychological $50.00 barrier.
Dips should be ideally contained by supports at $48.00 zone, provided by daily cloud top and Fibo 38.2% of $45.57/$49.40 upleg).
Focus is shifting to three other hurricanes that are approaching the US Gulf coast and may disrupt refining process again and reduce demand for oil again that would further boost oil prices.
Another supportive factor for oil price would be decision of Saudi Arabia to cut supplies in October by 350.000 barrels per day.
Res: 49.24, 49.40, 49.62, 50.00
Sup: 48.72, 48.50, 48.00, 47.65
USD Keeps Falling, EUR Gains Momentum After ECB Meeting
Draghi plays for time, all eyes on Yellen
In spite of huge market expectations, Mario Draghi gave little information about the future of the QE and played for time once again. As broadly anticipated the European Central Bank did not change the level of any of its three key interest rates. However, investors were hoping Draghi will come with a plan regarding the future of the central bank's quantitative easing program. The ECB's president chose to leave if for the end of the year as he declared the QE will run until December and beyond if necessary.
Investors were also expecting a reaction to the euro appreciation of the last few months. They were quite disappointed again as Draghi only declared that the “euro volatility represents a source of uncertainty.” That's it that's all. Investors will have to wait until the next meeting in October or most likely in December to get answers to their questions.
EUR/USD spiked to $1.2059 during the press conference and continued to rally during the Asian session, hitting $1.2092. The fact that Draghi appeared not too concerned about the euro strength was interpreted as a bullish signal by investors and they quickly forgot that he did not provide any hint about tapering.
With the ECB meeting behind us, investors will focus on the next big event that is the FOMC meeting of September 20th. Although the Fed hiking cycle seems on pause for now as the market is not pricing any interest rate hike before next year, investors are impatiently awaiting the Fed to finally reveal the starting date of its balance sheet unwinding programme.
On Friday the greenback kept losing ground against most of its peers as US rates dipped lower. The dollar index slid to 91.01, its lowest level since January 2015. The US 10-year treasury yield accelerated its debasement and 2.0144% this morning while the monetary policy sensitive 2-year yield was down 1.25%.
Markets dump USD on artificial comfort level
Great article in Bloomberg highlighting the disappearance of volatility in FI due to central bank's interventionist policy. To reiterate a well-understood fact, central banks are suppressing the true price of risk in rates, which in turn are distorting all other market risk measures. Worryingly investors are significantly underpricing the real price of risk. Seven months ago Greece 2-year yields were at 9.5%, now stand at 2.67%, on par with dysfunctional Argentina and only 60bp above AA New Zealand. In terms of Greece there is the view that ECB convergence trade is back on (thanks to Merkel clear pro-EU platform and yesterday's Macron speech on EU integration), making Greek sovereign debt ultimately backstopped by the ECB.
In broader terms, rightly so investors are aware that Central banks have discovered the miracle solution for managing debt and default avoidance, unadulterated raw capital creation. So if there is no longer credit risk (currency risk can be hedged) any return is a good return. This is also why the Swiss National Bank stock (yes the SNB is a publicly traded company) continues to rally. Printing CHF to buy asset such as EUR and equites (over chf60bn in stocks) is a great business model. VIX index is trading at 12 despite the lingering concern of potential nuclear war. Capital continues to flow out of the USD and into emerging markets as risk sentiment remains strong.
Technical Outlook: USDJPY – Close Below Weekly Cloud To Confirm Bearish Continuation As Risk Aversion Intensifies Ahead Of North...
The pair remains firmly in red and extends strong fall of the previous day through key supports at 108.11 (2017 low, posted on 17 Apr) and round-figure 108.00.
Risk aversion over North Korea tensions continues to heavily weigh on the pair, with rising fears of another incident during the weekend when North Korea will be celebrating National Day.
Such scenario could further accelerate yen's bulls as break below 108 handle also triggered a number of stops parked below.
Bear-leg from 110.66 (31 Aug lower top) could extend to 106.51 (Fibo 61.8% of 98.99/118.66 ascend) as bears see no obstacles en-route after 108.11 pivot was taken out.
The pair is on track for strong bearish weekly close (the biggest one-week fall since early April), with close below 108.83 (weekly cloud base which was cracked several times but without clear break) to confirm bearish continuation.
Corrective action could be anticipated in the near-term as slow stochastic entered oversold territory, with weekly cloud base now offering strong resistance and expected to cap.
Res: 108.11, 108.48, 108.83, 109.26
Sup: 107.34, 107.00, 106.77, 106.51