
Sample Category Title
Swiss Franc Trading On A Weaker Footing, Ahead Of Key Economic Releases In Switzerland
For the 24 hours to 23:00 GMT, the USD rose 0.3% against the CHF and closed at 0.9547.
In the Asian session, at GMT0300, the pair is trading at 0.9554, with the USD trading 0.07% higher against the CHF from yesterday’s close.
The pair is expected to find support at 0.9465, and a fall through could take it to the next support level of 0.9377. The pair is expected to find its first resistance at 0.9606, and a rise through could take it to the next resistance level of 0.9659.
Ahead in the day, market participants will closely monitor Switzerland’s UBS consumption indicator for July, followed by the nation’s ZEW expectations index and KOF leading indicator, both for August.
The currency pair is trading above its 20 Hr and 50 Hr moving averages.

Loonie Trading Flat In The Asian Session
For the 24 hours to 23:00 GMT, the USD slightly declined against the CAD and closed at 1.2510.
In the Asian session, at GMT0300, the pair is trading at 1.2510, with the USD trading flat against the CAD from yesterday’s close.
The pair is expected to find support at 1.2451, and a fall through could take it to the next support level of 1.2393. The pair is expected to find its first resistance at 1.2559, and a rise through could take it to the next resistance level of 1.2609.
The currency pair is showing convergence with its 20 Hr moving average and trading above its 50 Hr moving average.

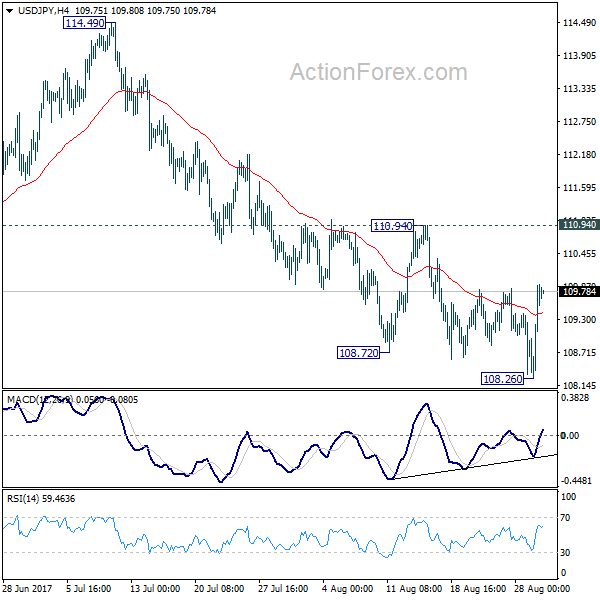
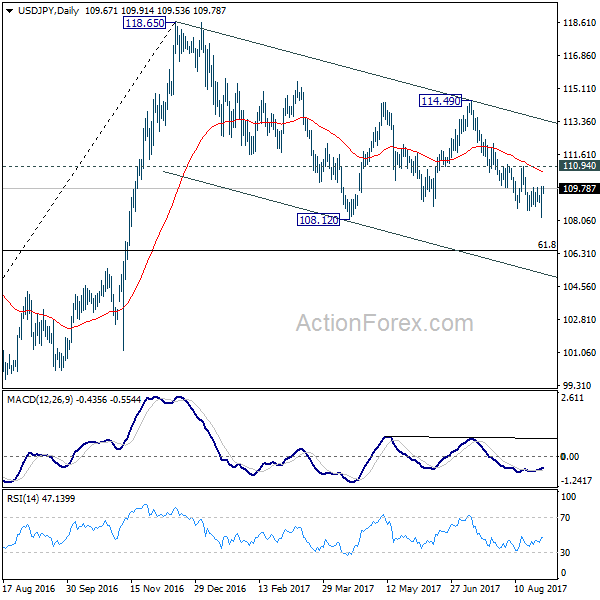
USD/JPY Daily Outlook
Daily Pivots: (S1) 108.69; (P) 109.30; (R1) 110.34; More...
USD/JPY staged a strong rebound after dipping to 108.26 and intraday bias is turned neutral first. Near term stays bearish as long as 110.94 resistance holds and deeper fall is expected. Firm break of 108.12 will resume the whole corrective decline from 118.65. In that case, USD/JPY will target 61.8% retracement of 98.97 to 118.65 at 106.48. Nonetheless, considering bullish convergence condition in 4 hour MACD, break of 110.94 will indicate near term reversal and bring stronger rebound back towards 114.49 resistance.
In the bigger picture, the corrective structure of the fall from 118.65 suggests that rise from 98.97 is not completed yet. Break of 118.65 will target a test on 125.85 high. At this point, it's uncertain whether rise from 98.97 is resuming the long term up trend from 75.56, or it's a leg in the consolidation from 125.85. Hence, we'll be cautious on topping as it approaches 125.85. If fall from 118.65 extends lower, downside should be contained by 61.8% retracement of 98.97 to 118.65 at 106.48 and bring rebound.
Sentiments Stabilized as US Didn’t Escalate North Korea Tension Further, Stocks and Dollar Rebound
Risk appetite returned as DOW staged the a 200 points swing in the biggest intraday comeback in near nine months overnight. Major indices ended higher with DOW gained 0.26%, S&P 500 rose 0.08% and NASDAQ added 0.30%. 10 year yield dived to as low as 2.091 but pared back much losses to close down -0.023 at 2.136. Dollar also stabilized and recovered after intraday selloff. Some analysts attributed the rebound to the lack of escalation out of US regarding North Korea's firing of missile over Japan. US President just said that all options are on the table, without any follow up. Nikkei follows by gaining near to 100 pts in Asia at the time of writing. Gold also retreated from intraday high at 1331.9 and is back below 1320.
UNSC condemned North Korea for its outrageous actions
The United Nations Security Council issued a condemned Presidential Statement and condemned North Korea for its "outrageous actions. This is in response to the ballistic missile launch yesterday over Japan and a series of launches on August 25. UNSC demanded that the North-East Asia country "immediately cease all such actions." UNSC warned that the actions were "not just a threat to the region" but to "all UN Member States". And such actions "deliberately undermining regional peace and stability and have caused grave security concerns around the world." UNSC also demanded North Korea to "abandon all nuclear weapons and existing nuclear programs in a "in a complete, verifiable and irreversible manner, and immediately cease all related activities".
Fed fund futures pricing in Fed cut again
After the destruction by hurricane Harvey in US and the sudden intensification of geopolitical tensions, markets are starting to price in Fed cut again. Current fed fund futures are pricing 2.7% chance of a cut in September FOMC meeting, and 97.3% chance of standing pat. There is 0% chance priced in for a hike. For December FOMC meeting, there is 1.7% chance for a cut, 61.9% chance of standing pat, and 36.4% chance of a high. Fed is still widely expected to continue with its plan to announce unwinding of balance sheet in September. But low inflation and uncertainty over growth could keep Fed's hands tied. And some interprets fed fund futures pricing as Fed won't move until end at least June. And between now and the end of 2018, there could be just one more rate hike.
No constructive news from Brexit negotiation yet
As the third round of Brexit negotiation carries on in Brussels, there is so far no constructive news out of the meeting yet. It's reported that UK's Brexit Secretary David Davis is demanding legal clarification on the principles EU uses to calculate the divorce bill. And UK is determined not to table a figure as it's perceived as a poor negotiation tactic. UK Prime Minister Theresa May's spokeswoman Alison Donnelly reiterated that May would like to move on to "future relationship" as there are lots of issues that "you can't separate between withdrawal and future relationship." And she reiterated that "our desire is to discuss both at the same time: we've repeatedly said that, and that's what we're working towards."
On the other hand, European Commission President Jean-Claude Juncker criticized that "none" of UK's positions papers on Brexit is "satisfactory. He complained that "the UK government is hesitant in showing all its cards." EU is also clear that there will be no talks on trade agreement before settling some key issues, including the divorce bill. Juncker emphasized again that "first of all we settle the past before we look forward to the future."
There are only two more rounds of talks scheduled before EU summit in October. EU officials would then decide whether significant progress is made to move on to trade agreements. But based on the current lack of progress, it's highly unlikely to for the negotiations to meet the deadline. It's reported that UK wants to squeeze in more sessions to pick up the pace.
China hit back on IMF criticism on debt
Earlier in the month, IMF criticized China for boosting growth with cost of "further large and continuous increases in private and public debt" that increases downside risks in the medium term. And IMF warned that China's credit growth was on a "dangerous trajectory". But said Yu Yongding, an economist of the Chinese Academy of Social Sciences, hit back and said that IMF's conclusion was "out of line with China's real situation." Yu urged China not to adopt IMF;s suggests on reforms to cut the debt levels. Yu pointed out that China has been resilient in coping with the debt problem. And, a government debt-to-GDP ratio at 36.7% is already lower than most major industrialized and emerging-market economies. On the other hand, rushing to solve the debt problem in hasty manner could risk dampening growth.
Staying in China, the two key phenomena, tightening in liquidity condition and renminbi strength, in the Chinese market have persisted. Last week, PBOC auctioned RMB 80B of 3-month Treasury deposits at 4.51%, the highest since December 2014. This came in after another auction of 3-month Treasury deposits on August 18, at 4.46%. Higher interest rates signaled that the government is trying to increase the borrowing cost, tightening money supply. Indeed, liquidity conditions have remained tight in China, with both interbank rates and bond yields higher. Renminbi firmed, thanks to the broad-based weakness in the greenback and the Chinese government's capital control measures. USDCNY fixing has fallen to 6.6293, lowest level since August 2016, on Tuesday. The current liquidity environment and renminbi strength are in line with PBOC's "prudent and neutral" monetary policy stance, with the main goal of "deleveraging". More in China's Monetary Conditions Remain Tight as Deleveraging in Progress.
On the data front
Japan retail sales rose 1.9% yoy in July. Australia construction work done rose 9.3% in Q2, building approvals dropped -1.8% mom in July. New Zealand building permits dropped -0.7% mom in July. UK BRC shop price index dropped -0.3% yoy in August. Swiss UB consumption indicator and KOF leading indicator will be featured in European session. UK will release mortgage approvals and M4 money supply. Eurozone will release confidence indicators. German will release August CPI flash. From US, main focus will be on ADP employment and GDP revision.
USD/JPY Daily Outlook
Daily Pivots: (S1) 108.69; (P) 109.30; (R1) 110.34; More...
USD/JPY staged a strong rebound after dipping to 108.26 and intraday bias is turned neutral first. Near term stays bearish as long as 110.94 resistance holds and deeper fall is expected. Firm break of 108.12 will resume the whole corrective decline from 118.65. In that case, USD/JPY will target 61.8% retracement of 98.97 to 118.65 at 106.48. Nonetheless, considering bullish convergence condition in 4 hour MACD, break of 110.94 will indicate near term reversal and bring stronger rebound back towards 114.49 resistance.
In the bigger picture, the corrective structure of the fall from 118.65 suggests that rise from 98.97 is not completed yet. Break of 118.65 will target a test on 125.85 high. At this point, it's uncertain whether rise from 98.97 is resuming the long term up trend from 75.56, or it's a leg in the consolidation from 125.85. Hence, we'll be cautious on topping as it approaches 125.85. If fall from 118.65 extends lower, downside should be contained by 61.8% retracement of 98.97 to 118.65 at 106.48 and bring rebound.
Economic Indicators Update
| GMT | Ccy | Events | Actual | Forecast | Previous | Revised |
|---|---|---|---|---|---|---|
| 22:45 | NZD | Building Permits M/M Jul | -0.70% | -1.00% | -1.30% | |
| 23:01 | GBP | BRC Shop Price Index Y/Y Aug | -0.30% | -0.40% | ||
| 23:50 | JPY | Retail Trade Y/Y Jul | 1.90% | 1.00% | 2.10% | 2.20% |
| 1:30 | AUD | Construction Work Done Q2 | 9.30% | 1.00% | -0.70% | 0.90% |
| 1:30 | AUD | Building Approvals M/M Jul | -1.70% | -5.00% | 10.90% | 11.70% |
| 6:00 | CHF | UBS Consumption Indicator Jul | 1.38 | |||
| 7:00 | CHF | KOF Leading Indicator Aug | 107 | 106.8 | ||
| 8:30 | GBP | Mortgage Approvals Jul | 65.5k | 64.7k | ||
| 8:30 | GBP | M4 Money Supply M/M Jul | 0.40% | -0.20% | ||
| 9:00 | EUR | Eurozone Business Climate Indicator Aug | 1.05 | 1.05 | ||
| 9:00 | EUR | Eurozone Economic Confidence Aug | 111.3 | 111.2 | ||
| 9:00 | EUR | Eurozone Industrial Confidence Aug | 4.7 | 4.5 | ||
| 9:00 | EUR | Eurozone Services Confidence Aug | 13.9 | 14.1 | ||
| 9:00 | EUR | Eurozone Consumer Confidence Aug F | -1.5 | -1.5 | ||
| 12:00 | EUR | German CPI M/M Aug P | 0.10% | 0.40% | ||
| 12:00 | EUR | German CPI Y/Y Aug P | 1.80% | 1.70% | ||
| 12:15 | USD | ADP Employment Change Aug | 188K | 178K | ||
| 12:30 | USD | GDP (Annualized) Q2 S | 2.70% | 2.60% | ||
| 12:30 | USD | GDP Price Index Q2 S | 1.00% | 1.00% | ||
| 14:30 | USD | Crude Oil Inventories | -3.3M |
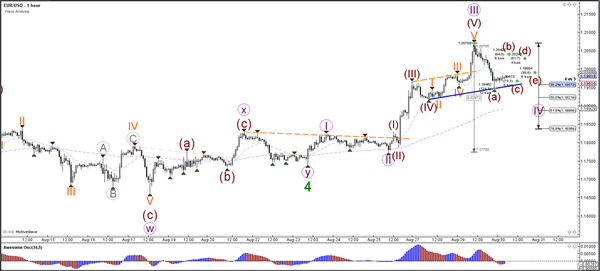
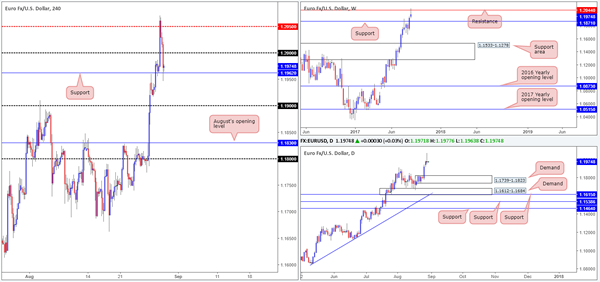
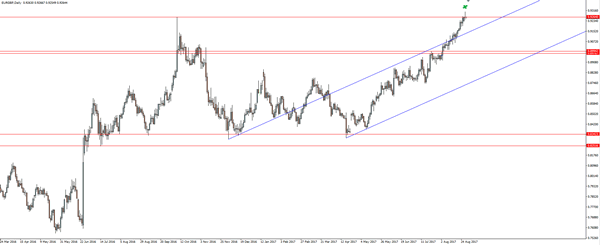
Daily Technical Analysis: EUR/USD Break, Pullback And Continuation Pattern At 1.20 Resistance
Currency pair EUR/USD
The EUR/USD broke above the 1.20 round level resistance and continued its bullish momentum towards the 23.6% Fibonacci target at 1.2075. Price made a strong bearish retracement after hitting this target and fell back to the 38.2% Fibonacci support level of wave 4 (purple), which could be a potential support zone within wave 5 (green).
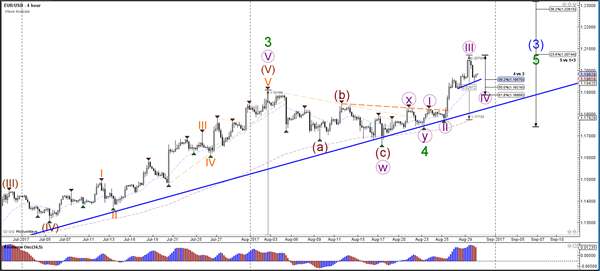
The EUR/USD is most likely in a wave 4 (purple) correction when considering the strong bullish momentum within wave 3 (purple). A break below the 61.8% Fibonacci level of wave 4 vs 3 makes the wave 4 (purple) unlikely. A typical correction pattern for wave 4 (purple) is an ABCDE contracting triangle.
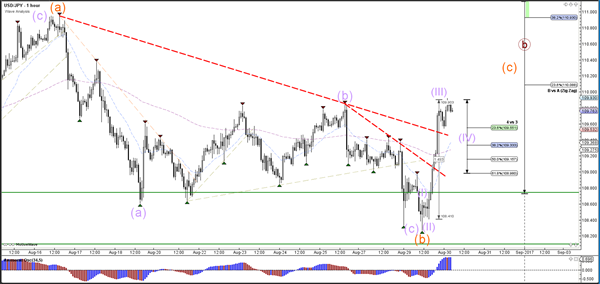
Currency pair USD/JPY
The USD/JPY failed to break the support zone (green) indicated by the green lines. The bearish price action now looks like an ABC (purple) correction within wave B (orange) and price is building a wave C within wave B (brown).
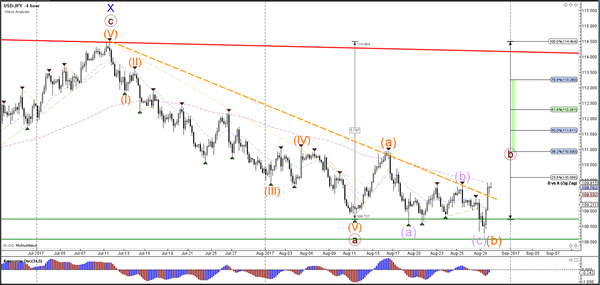
The USD/JPY bullish momentum is probably a wave 3 (purple). Once wave 3 is completed, a wave 4 (purple) correction could take place back to the Fib levels of wave 4 vs 3 which could cause a potential bullish bounce.
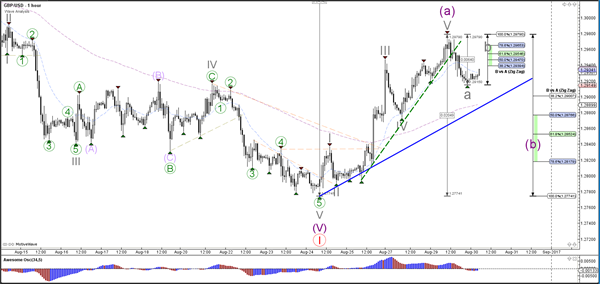
Currency pair GBP/USD
The GBP/USD bullish momentum has probably completed a wave A (purple), which stopped at the 38.2% Fibonacci resistance level. Price could now be building a correction within wave B (purple).
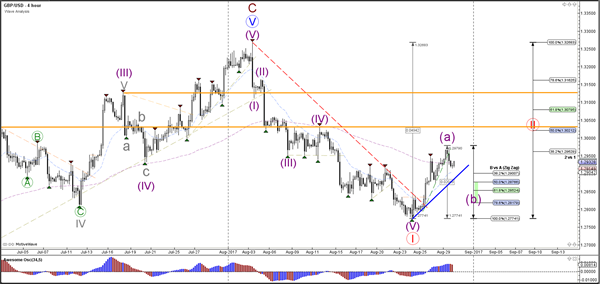
The GBP/USD completed a 5 wave (grey) pattern within wave A (purple). Price is now building a potential ABC correction (grey) within wave B (purple).
Daily Technical Outlook And Review: EUR/USD, GBP/USD, AUD/USD, USD/JPY, USD/CAD, USD/CHF, DOW 30, GOLD
A note on lower timeframe confirming price action...
Waiting for lower timeframe confirmation is our main tool to confirm strength within higher timeframe zones, and has really been the key to our trading success. It takes a little time to understand the subtle nuances, however, as each trade is never the same, but once you master the rhythm so to speak, you will be saved from countless unnecessary losing trades. The following is a list of what we look for:
- A break/retest of supply or demand dependent on which way you're trading.
- A trendline break/retest.
- Buying/selling tails ... essentially we look for a cluster of very obvious spikes off of lower timeframe support and resistance levels within the higher timeframe zone.
- Candlestick patterns. We tend to only stick with pin bars and engulfing bars as these have proven to be the most effective.
We typically search for lower-timeframe confirmation between the M15 and H1 timeframes, since most of our higher-timeframe areas begin with the H4. Stops are usually placed 1-3 pips beyond confirming structures.
EUR/USD
As tensions between North Korea and Japan ease, safe-haven assets reversed on Tuesday.
Going into the early hours of yesterday's London session the single currency struck the H4 mid-level region 1.2050, which resulted in a heavy bout of selling being seen. The psychological band 1.20 was later taken out, permitting H4 price to challenge support at 1.1962 into the closing bell.
The latest downside move may also have something to do with the fact that weekly action recently crossed swords with a resistance line at 1.2044. The next downside target from here can be seen at 1.1871, a support that stretches as far back as 1993! Also of interest, daily flow printed a rather strong-looking selling wick and shows little support until we reach demand printed at 1.1739-1.1823.
Suggestions: With a weekly resistance level in play right now, coupled with a daily selling wick, a sell on any retest seen at 1.20 boundary is attractive. However, waiting for a lower-timeframe sell signal (see the top of this report) to form from this number before pulling the trigger is advised. This is largely due to psychological levels being prone to fakeouts and also because of the strong uptrend the EUR is entrenched within at the moment.
Should this trade come to fruition, we'll be looking for H4 price to close below 1.1962. This will be our cue to reduce risk to breakeven and take partial profits.
Data points to consider: German Prelim CPI figures m/m (all day). US ADP non-farm employment change at 1.15pm, US Prelim GDP q/q at 1.30pm, followed closely by a speech from FOMC member Powell at 2.15pm GMT+1.
Levels to watch/live orders:
- Buys: Flat (stop loss: N/A).
- Sells: 1.20 region ([waiting for a lower-timeframe sell signal to form is advised] stop loss: dependent on where one confirms this number).
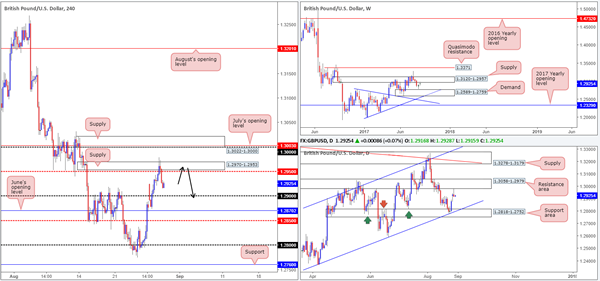
GBP/USD
Following a brief spell above H4 supply at 1.2970-1.2953 during the early hours of London yesterday, the pair underwent a downside correction. A stronger dollar, coupled with price recently shaking hands with both a daily resistance area at 1.3058-1.2979 and a weekly supply at 1.3120-1.2957, also, we believe, heavily contributed to the latest downside move.
With H4 price now seen loitering between 1.2950 and the 1.29 handle, where does one go from here? Well, given the higher-timeframe structures, our desk is only interested in shorts for the time being. So with that being said, we're going to be looking for the H4 candles to retest the recently challenged supply and hold firm. A reasonably sized H4 bearish candle formed at this zone (preferably a full, or near-full-bodied candle) would, for us, be an ideal entry trigger. As for take-profit zones, we'd be looking for the 1.29 handle and June's opening level at 1.2870 as initial targets.
Suggestions: Should H4 price chalk up a bearish candle (preferably a full, or near-full-bodied candle) at 1.2970-1.2953 as per the black arrows, a short trade could be an option.
Data points to consider: US ADP non-farm employment change at 1.15pm, US Prelim GDP q/q at 1.30pm, followed closely by a speech from FOMC member Powell at 2.15pm GMT+1.
Levels to watch/live orders:
- Buys: Flat (stop loss: N/A).
- Sells: 1.2970-1.2953 ([waiting for a reasonably sized H4 bearish candle to form – preferably a full, or near-full-bodied candle – is advised] stop loss: ideally beyond the candle's wick).
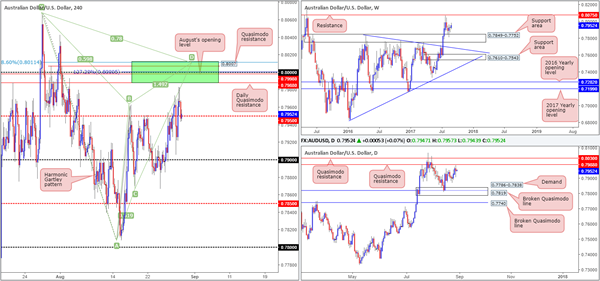
AUD/USD
In recent trading, the commodity currency punched its way back above the H4 mid-level resistance at 0.7950 and clocked a high of 0.7982. As of current price, however, 0.7950 is being retested as a support, which we're hoping will hold firm and lift the unit higher.
For those who have been following previous reports you will likely recall that our desk is eyeing the 0.80 boundary for shorting opportunities. Our reasoning behind liking 0.80, apart from 0.80 being a watched round number, is the several nearby structures:
The daily Quasimodo resistance level at 0.7988.
A H4 Quasimodo resistance level at 0.8007.
A H4 127.2% Fib ext. point at 0.80 taken from the low 0.7807.
August's opening level at 0.7998.
A H4 Harmonic Gartley reversal point at the 78.6% Fib resistance line drawn from 0.8011.
Suggestions: While the above structures (H4 green sell zone) boast attractive confluence, one must take into account the possibility that a fakeout may be seen up to the daily Quasimodo resistance level at 0.8030 sited just above the green zone. Traditionally, when trading the Gartley Harmonic pattern the stop-loss order should go beyond the X point (0.8065). If you were to follow this, a fakeout up to the daily Quasimodo resistance is not a concern. It is more for the aggressive traders who will likely look to position stops just beyond the green zone. Should you be one of those traders, you may want to consider waiting for the H4 candles to prove seller intent from the sell zone (in the form of either a full, or near-full-bodied bearish candle), before pulling the trigger. This will help avoid a fakeout should it occur.
Data points to consider: Australian building approvals m/m at 2.30am. US ADP non-farm employment change at 1.15pm, US Prelim GDP q/q at 1.30pm, followed closely by a speech from FOMC member Powell at 2.15pm GMT+1.
Levels to watch/live orders:
- Buys: Flat (stop loss: N/A).
- Sells: 0.8011/0.7988 (stop loss: either wait for a H4 bearish candle to form in the shape of a full, or near-full-bodied candle, and place stops above the candle's wick. Another option is to simply enter at 0.80 and place stops above the H4 Harmonic X point at 0.8067).
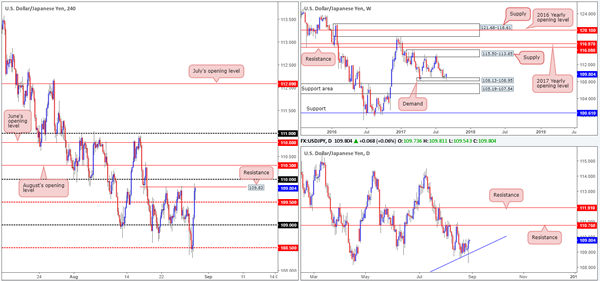
USD/JPY
As tensions between North Korea and Japan subside, a strong recovery in US equities and the USD/JPY market was seen on Tuesday. The advance took H4 price beyond both the 109 handle and the mid-level resistance at 109.50, and ended the day colliding into a resistance level at 109.83.
For traders who are considering selling the noted resistance level, it might be worth noting what you're selling into on the bigger picture. Weekly price remains trading around the demand at 108.13-108.95, alongside daily price seen respecting a trendline support extended from the low 100.08. With the next upside target not being seen until we reach the daily resistance at 110.76, we feel higher prices could be on the cards.
Suggestions: While the higher timeframes suggest further buying could be seen, H4 structure is unfortunately somewhat cramped at the moment. Not only do we have the current resistance in play, we also have the 110 handle seen directly above, which is followed closely by August's opening level at 110.30. In light of this, our team will be remaining on the sidelines today.
Data points to consider: US ADP non-farm employment change at 1.15pm, US Prelim GDP q/q at 1.30pm, followed closely by a speech from FOMC member Powell at 2.15pm GMT+1.
Levels to watch/live orders:
- Buys: Flat (stop loss: N/A).
- Sells: Flat (stop loss: N/A).
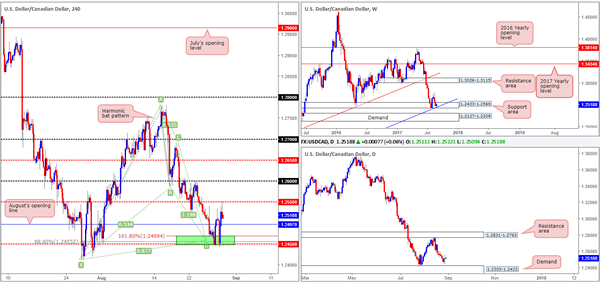
USD/CAD
Trade update: long trade taken from 1.2455 was taken out at breakeven.
Kicking this morning's report off with a look at the weekly timeframe, we can see that price remains bolstered by a support area coming in at 1.2433-1.2569 that unites with a trendline support etched from the low 0.9633. The story on the daily chart, nonetheless, shows price hovering just ahead of a demand base logged at 1.2303-1.2423, which happens to be positioned just beneath the current weekly support area.
Over on the H4 candles, price retested the 1.2450 neighborhood and rallied 100 pips to the 1.2550 region during the course of yesterday's segment. As mentioned in previous reports, 1.2450 is reinforced by not only the weekly structures noted above, but also a H4 Harmonic bat pattern that completes at 1.2455 and a 161.8% H4 Fib ext. point at 1.2469.
Suggestions: In view of the weekly structures in play, August's opening level at 1.2497 may hold firm as support today. Should the line hold ground and print a lower-timeframe buy signal (see the top of this report), we would be interested buyers here, with an initial target objective set at 1.2550.
Data points to consider: US ADP non-farm employment change at 1.15pm, US Prelim GDP q/q at 1.30pm, followed closely by a speech from FOMC member Powell at 2.15pm. Crude oil inventories at 3.30pm GMT+1.
Levels to watch/live orders:
- Buys: 1.2497 region ([waiting for a lower-timeframe buy signal to form is advised] stop loss: dependent on where one confirms this number).
- Sells: Flat (stop loss: N/A).
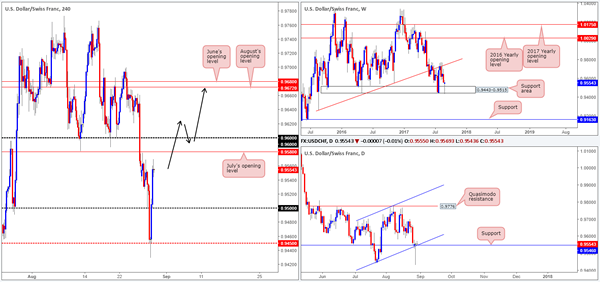
USD/CHF
Fresh trading shows daily price whipsawed through support at 0.9546, which happens to unite with a channel support etched from the low 0.9438. The candle ended with price forming a beautiful-looking buying tail, which to candlestick traders, may be considered a buy signal. A little higher up on the curve, weekly price also bounced strongly from a support area coming in at 0.9443-0.9515. This zone has held price higher multiple times in the past, so we may see history repeat itself here. Over on the H4 timeframe, price stormed back above the 0.95 neighborhood amid yesterday's US segment, and closed the day just ahead of July's opening level at 0.9580.
Suggestions: Technically speaking, a sell at either 0.9580 or 0.96 is out of the question for us. Selling into potential weekly and daily buyers (see above) is not really our cup of tea! Therefore, we're going to wait patiently and see if H4 price can close above 0.96. This – coupled with a retest and a reasonably sized H4 bullish candle in the shape of a full, or near-full-bodied candle would, in our opinion, be enough to validate a buy, targeting June/August's opening levels at 0.9680/0.9672.
Data points to consider: US ADP non-farm employment change at 1.15pm, US Prelim GDP q/q at 1.30pm, followed closely by a speech from FOMC member Powell at 2.15pm GMT+1.
Levels to watch/live orders:
- Buys: Watch for H4 price to engulf beyond 0.96 and then look to trade any retest seen thereafter ([waiting for a H4 bullish candle to form following the retest is advised] stop loss: ideally beyond the candle's tail).
- Sells: Flat (stop loss: N/A).
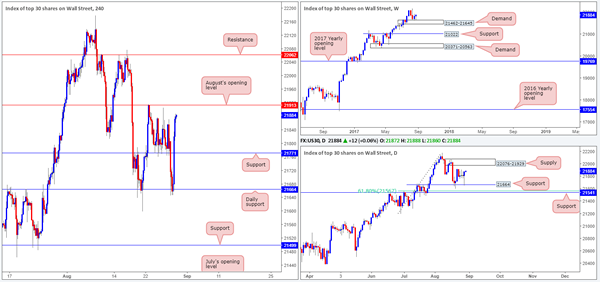
DOW 30
Risk-off momentum reversed on Tuesday as tensions between North Korea and Japan eased. H4 price recovered beautifully from daily support at 21664, which led to the unit engulfing resistance at 21771 and closing the day just ahead of August's opening level at 21913. Now, considering how well this monthly band held on the 22nd August, would this be a line worthy of shorting? The short answer, at least in our opinion, is no. Our reasoning stems from the higher-timeframe structures. Weekly price remains afloat above demand at 21462-21645, and daily price recently tagged support at 21664 beautifully and formed a strong-looking buying tail.
Our suggestions: The strong underlying trend present in this market, coupled with the supports noted on the bigger picture, promotes a buyers' market. Unfortunately, a H4 close above 21913 would land you a few points away from the underside of a daily supply zone at 22076-21929, thus making it a difficult market to buy at the moment. Although our bias is directed to the upside, we're going to remain flat as buying into a daily supply would, despite where weekly price is trading from, not likely do our account any favors.
Data points to consider: US ADP non-farm employment change at 1.15pm, US Prelim GDP q/q at 1.30pm, followed closely by a speech from FOMC member Powell at 2.15pm GMT+1.
Levels to watch/live orders:
- Buys: Flat (stop loss: N/A).
- Sells: Flat (stop loss: N/A).
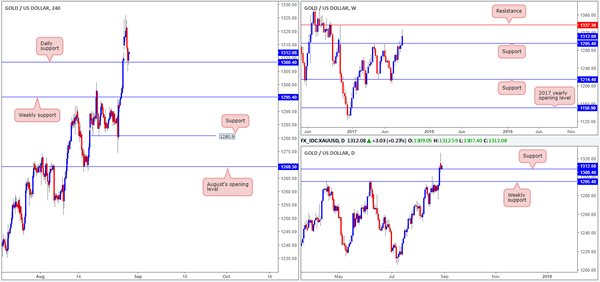
GOLD
Gold prices pulled back on Tuesday as the dollar recovered from lows of 11840. This, as can be seen on the H4 chart, forced price to cross swords with the daily support at 1308.4. At the same time, however, we can also see the USDX H4 candles retesting the underside of a resistance area at 11896-11906, as well as a daily resistance area drawn from 11899-11932.
Given the points above, and the fact that weekly price on gold shows room to extend up to resistance at 1337.3, we have taken a long on the recently closed H4 bullish candle at 1311.9, with a stop planted at 1304.4. The risk/reward is quite substantial should the trade reach the noted weekly resistance level, which will be our ultimate take-profit target.
Our suggestions: Buy the market at current price and look to trail the metal up as far as the weekly resistance level at 1337.3.
Levels to watch/live orders:
- Buys: 1311.9 ([live] stop loss: 1304.4).
- Sells: Flat (stop loss: N/A).
Market Morning Briefing: Fresh Rise In Euro-Yen Past The 131.40 Level
STOCKS
Support near 21675 has held in Dow (21865.37, +0.26%) taking it up sharply to 21865. Narrow range trade is possible within 21900-21675 for a few more sessions before it decides on further direction.
Dax (11945.88, -1.46%) is trading near the lower limit of the 11940-12350 zone mentioned yesterday. Near term looks bearish and we could expect a fall towards 11700 soon.
While support on Dollar Yen holds near 108.00-108.15, it would be difficult for Nikkei (19468.73, +0.55%) to come down sharply just now. A sharp bounce back in the currency pair has helped Nikkei also to recover from yesterday’s low. But while the index trades below 19600, chances of a fall towards 19200 or even lower remains on the cards.
Shanghai (3366.73, +0.05%) is stable above 3350 and could possibly spend some time in a sideways consolidation before again moving up further. While above 350, the upside possibility remains open towards 3400-3500 in the longer term.
Nifty (9796.05, -1.18%) has not been able to break above 9950 and instead came off sharply yesterday to test immediate support near current levels. A break below 9795 could take it down towards 9600 in the next couple of sessions; else a bounce back towards 9900-9950 is again possible. The 9950-9750 region is important and a sustained break on either side would drive the next course of movement.
COMMODITIES
Gold (1318) is trading above 1300 due to the fresh weakness in Dollar index (92.24). Immediate trading range for Gold is 1280-1350 with a pivot at 1300. Gold is highly overbought in near term time frame thus we are not confident about the sustainability beyond 1350 regions at this moment. Similarly Silver (17.42) is also trading within 17.05-17.50, well supported by the bullish momentum in Copper. Both Gold and Silver are out of their short term bearish channel but the supports of 1280 and 16.90 should hold to keep the momentum intact.
Copper (3.11) looks on a firm footing while it is trading above 2.89 levels. Midterm resistances come at 3.12 and 3.25 regions respectively. The only concern is the short term overbought condition thus the Bulls are here by advised to take extra caution at current market price.
We have U.S crude oil inventory today at 8.00 pm with an expectation of a shortage of 1.8MB. This will be the 10th consecutive weeks of shortage in US oil inventory in a row thus we need to be cautious as a minor surplus might cause drastic fall in the whole energy pack. Brent (51.52) is trading within the range of 50.50-52.80 and WTI (46.33) of 45.50-49 as well and a daily close below 50.50 (Brent) and 45.50 (WTI) could resume the short term bearish trend again.
FOREX
As it turns out, easing of tensions over North Korea led to a strong bounce in Dollar-Yen (109.76) from an intra-day low of 108.25. Technically, the market did not close below the 108.60 level mentioned yesterday and the bounce is the strongest seen in the last 14 days. Immediate target for today is 110.20. A Day Close above 109.50 can lead us up to 110.50 firmly establishing a sideways movement as the dominant trend.
Fresh rise in Euro-Yen (131.44) past the 131.40 level mentioned yesterday adds overall confidence to the "Risk ON" trade. Immediate Resistance seen near 132.25. Medium term Support at 130-129 within an overall uptrend.
The Euro (1.1975) saw a high near 1.2070 and is seeing some profit-taking. Overall trend remains bullish with crucial Support at 1.18 now. Resistances come up in the 1.2075-2150 region.
The Pound rose to 1.2979, just short of our target of 1.30, and has come off a bit from there. We are not very clear about the outlook on Pound now. Immediate Resistance at 1.30, Support at 1.28. Trend unclear.
As mentioned yesterday, the Aussie (0.7993) has tested 0.80. Although there is 200-week MA Resistance near 0.80, further rise towards 0.81 is possible while the Support at 0.79 holds.
The Chinese Yuan (USDCNY = 6.5840) has strengthened some more, but may see a corrective bounce. Dollar-Rupee trades at 63.95/97 on the NDF, down from yesterday's closing level of 64.02. Likely establishes sideways range trade between 63.80-64.20 as the dominant trend.
INTEREST RATES
The German-US 2 Yr Spread (-2.09%) and the German-US 10Yr Spread (-1.78%) both moved lower. If they will manage to rebound from current levels and could move up in the near term towards -1.97% and -1.75% then that could possibly pull up the Euro again in the near term.
The benchmark US 10Yr yield moved lower towards 2.10 in line with our expectation. There are rooms for further downside towards 1.97 if the US 10Yr will close below 2.09% on a daily closing basis
The Japanese 5Yr JGB (-0.14%) and the 30Yr JGB (+0.83%) are hovering around their respective supports, suggesting a possible bounce in near term time frame.
UK 5Yr and 30Yr Gilt Yields as they are also testing Supports near current levels (5Yr 0.42% and 30Yr 1.56%) and the 10Yr is trading at 1.00 regions as per expectation.
Harvey Rains On Positive Crude Inventory Data
Harvey's floods continue to submerge the trend of increasingly positive inventory data.
Oil continues to be a game of two halves, with Brent reacting positively to the overnight American Petroleum Institute's (API) crude inventory data, with WTI continuing to sag as Hurricane Harvey induced refinery shutdowns leaving U.S. crude with no home to call its own.
Lost in the winds of Harvey, the API reported another massive drawdown of 5.78 million barrels against an expected 1.75 million overnight. This continues the multi month trend of falling inventories and would normally be positive for crude as we look forward to the official inventory data this evening. However, with fully 20% of the U.S. refining capacity, off-line attention has been focused on potential shortages in refined products with gasoline futures rocketing another four percent higher overnight.
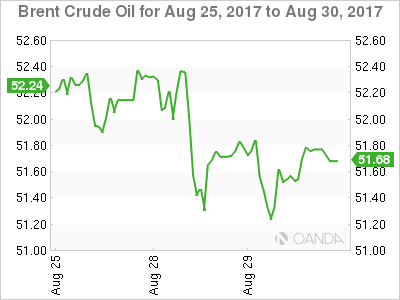
Brent Spot
Brent spot is trading at 51.70, unchanged from its overnight and previous days close. The Brent premium has blown out to multi-year highs of $5.50 due to Hurricane Harvey and sellers of the Brent/WTI spread at these levels maybe capping Brent's gains for now. Nevertheless, it continues to consolidate its gains trading mid-range with support at 51.00 and resistance at 53.70.
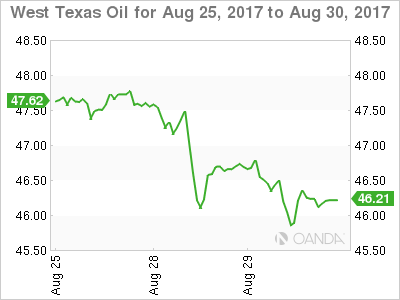
WTI Spot
WTI spot fell 50 cents to close at 46.20 where it trades unchanged this morning, wilting under the flood waters. We expect this state of affairs to continue until we have more visibility time frames for the Texas and Louisiana refineries to restart production, a process that could take more than a week during normal operations. The official crude Inventory data is expected at -1.75 million barrels with a more negative number most likely not having its usual positive effects on prices. A better than expected number in the present circumstance, however, may see WTI come under unwelcome pressure again.
EUR/GBP Prints Indecision Candle At Resistance
HUMP DAY! Let's get us up and over the Wednesday weekly mountain with another look at EUR/GBP.
Remember this EUR/GBP resistance zone? I won't quote the chart, but click the link and take a look at the setup we were watching.
Moving back into the present though, let's have a look at EUR/GBP today:
EUR/GBP Daily:
So the channel wasn't respected but look at the candle that has printed at the very top of our resistance zone!
Almost like it's too good to be true…
Best of probabilities to you.
Dollar Recovers Slightly Ahead Of Private Jobs Data
Hurricane Harvey and concerns with Fed monetary policy keeping USD low
The US dollar is looking forward the release of employment data to turn around the negative trend against major currencies with a sixth monthly fall. Geopolitical anxiety rose after North Korea launched a missile over Northern Japan while in the United States Hurricane Harvey’s damage is yet to be fully assessed but could end up being one of the costliest storms in US history. The Conference Board released its consumer confidence survey results with surprise 122.9 points in the index. The improvement from last month shows a rising optimism from US consumers. The news was not enough to break the USD out against major currencies, but closed the gap ahead of the release of private payroll data.
US payroll processor Automatic Data Processing (ADP) will release its non-farm employment report on Wednesday, August 30 at 8:15 am EDT. The forecast calls for a gain of 186,000 positions which has been a consistent estimate by the consensus this year. The ADP report will be an important data point ahead of the release of Friday’s U.S. non farm payrolls (NFP). The government report includes a larger data set and is more influential. Although the correlation has not been high, the market does take into consideration the information from the private payroll report, specially around wage growth.
The dollar faces an uphill battle this week with the cost of the natural disaster impairing the efforts from the Trump administration to finally deliver on the tax reforms that boosted the greenback back in November. After the central bank summit in Jackson Hole left few insights on the monetary policy plans of the U.S. Federal Reserve and the European Central Bank (ECB) it is back to the hard employment data released this week to add clarity to currency valuations.
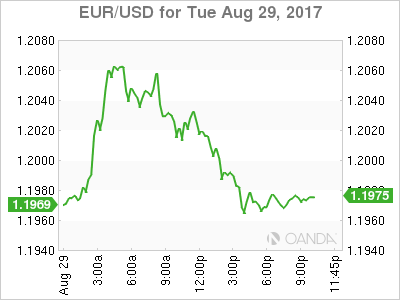
The EUR/USD gained 0.199 percent on Tuesday. The single currency is trading at 1.2001 after touching a high of 1.2070. The 1.21 price level proved to be a bridge too far and just breaking the psychological level of 1.20 took most of the wind of the EUR move. The move in the currency pair has been mostly on USD weakness as there have been few economic releases on either side of the ocean. The Trump administration’s timing on its tax reform push could have been better but could be one of the few silver linings for the dollar this week.
Political capital has been squandered in more divisive policies in 2017 and it is time to wonder if the Trump administration has anything left to push through the tax reform, deregulation and infrastructure spending policies that were promised right after winning the White House. The budget cuts to FEMA after what will be a very expensive clean up and rescue operation will not sit well with voters and could further politicians to seek some distance with the President, once again hurting the chances of republican majorities making the process straight forward.
Threats on the US debt ceiling, the NAFTA and North Korea have boosted safe haven assets this week. Fed Chair Janet Yellen offered little support for the big dollar with no comments on monetary policy, speaking instead about the importance of strong regulation on the eve of Trump’s deregulation policies. It is now almost a given that she will not get a second term at the helm of the Fed with Gary Cohn one of the most likely candidates to lead the central bank after Febraury.
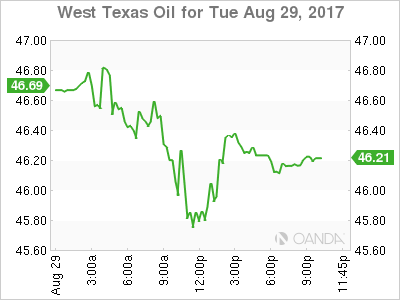
US Energy gained 0.017 on the last 24 hours. The price of West Texas Intermediate is trading at 46.21 after the heavier rains from Hurricane Harvey have subsided. The aftermath of the storm still leaves close to 20 percent of oil production offline causing a glut of crude, but not enough refineries to turn it into gasoline prompting a spike in prices of the distillate.
Oil prices recovered on Tuesday ahead of the weekly inventories report due on Wednesday, at 10:30 am EDT. The estimate is for a drawdown of 1.9 million barrels last week before Hurricane Harvey hit Texas. Unlike Hurricane Katrina, Harvey has missed offshore platforms but hit refineries. This week’s data will paint a different picture as the shutdown in refineries has led to a surplus of crude that took a toll on the price of WTI. The disruption is expected to be temporary with the recovery coming in the next couple of weeks.
Market events to watch this week:
Wednesday, August 30
8:15 am USD ADP Non-Farm Employment Change
8:30 am USD Prelim GDP q/q
10:30 am USD Crude Oil Inventories
9:30 pm AUD Private Capital Expenditure q/q
Thursday, August 31
8:30 am CAD GDP m/m
8:30 am USD Unemployment Claims
9:45 pm CNY Caixin Manufacturing PMI
Friday, September 1
4:30 am GBP Manufacturing PMI
8:30 am USD Average Hourly Earnings m/m
8:30 am USD Non-Farm Employment Change
10:00 am USD ISM Manufacturing PMI