Sample Category Title
US Dollar Makes A Stand
Whether it is just a month-end wobble or something more, the US dollar deployed a robust Tuesday reversal on positive economic signs. The Swiss franc was the top performer Tuesday while the yen lagged. Japanese retail sales are up next. Our Premium short in #EUROSTOXX50 hits the final 3380 target following the 3520 entry. Gold and silver hit their final targets yesterday. The upcoming moves will be discussed in the next Premium video due out in Wednesday Europe morning.
USD/JPY struggled early on Tuesday after North Korea launched a missile test that crossed Japanese airspace. The pair fell to a four-month low of 108.27 but later reversed higher to 109.90 – a 12-day high. It was a similar story across the board as the risk trade quickly faded and the dollar captured a bid. That was despite US 10-year yields falling to the US election.
The reversals in gold, USD/CAD, cable, USD/JPY and elsewhere muddle the picture. Quietly, EUR/JPY also rose to the highest since January in a break of the eight-week range. Whether the daily candle in gold is a true doji or gravestone doji remains to be seen. Ashraf's Premium video will shed more insight tomorrow.
USD strength emerged after the Conference Board's August consumer confidence rose to 122.9 compared to 120.7 expected. It was the second-best reading since 2000 and was driven by the 'current conditions' index, which is more reliable than the 'expectations' index because the latter has become more of a political-happiness gauge.
It's far too early to claim any kind of US dollar turn. Washington and the Fed are likely to be near-term headwinds. In addition, even the technical reversal is tenuous. Aside from USD/JPY, the US dollar basically finished flat.
The days ahead will be key as non-farm payrolls draw closer, but before that we have the ISM and ADP.
Looking ahead, Japanese retail sales are due up at 2350 GMT and expected to rise 1.0% y/y, a slowdown from the 2.2% pace in June. That's not likely to be a market mover but the rest of the day has some high-tier data including German CPI, ADP employment and the second look at Q2 US GDP.
Gold Rally Continues on North Korea Jitters
Gold continues to make gains against the dollar, and has moved higher for a third consecutive day. In North American trade, spot gold is trading at $1314.58, up 0.35% on the day. In economic news, CB Consumer Confidence improved to 122.9, above the forecast of 120.9 points. On Wednesday, the US releases two key events – ADP Nonfarm Employment Change and Preliminary GDP for the second quarter. The markets are expecting a strong gain of 2.7% from GDP, and a surprise reading could have a strong impact on gold prices.
Geopolitical events are once again driving the markets, with the US dollar under pressure. After a brief hiatus, North Korea is back in the news again, as the rogue country fired a missile over Japanese territory on Tuesday. Japan and the US have sharply condemned the missile launch, and with tensions once again climbing in the Korean peninsula, nervous investors have moved a way from stocks in favor of safe-haven assets such as gold. If the crisis continues, we can expect the gold rally to continue. Since Friday, gold prices have climbed 1.9 percent.
At the Jackson Hole meeting last week, Yellen did not discuss interest rate policy, choosing instead to emphasize that the financial regulations put in place since the financial crisis in 2008 should not be undermined. Her message appeared aim at Donald Trump, who has expressed his intention to relax banking and financial regulations which he has argued are hampering business. The markets remain skeptical about a third and final rate hike this year, as the odds of an increase in December have been falling – currently, the odds a December hike are at 35%, down from 42% a month ago.
Pound Subdued, Markets Eye UK Net Lending to Individuals
The British pound is showing limited movement in the Tuesday session. In North American trade, the pair is trading at 1.2938, up 0.05% on the day. On the release front, British Nationwide HPI declined 0.1%, just shy of the estimate of 0.0%. In the US, CB Consumer Confidence improved to 122.9, above the forecast of 120.9 points.
The US dollar remains under pressure, as the markets remains focused on the crisis in the Korean peninsula. After a brief hiatus, North Korea is back in the news again, as the rogue country fired a missile over Japanese territory on Tuesday. Japan and the US have sharply condemned the missile launch, and with tensions once again climbing in the Korean peninsula, nervous investors have moved a way from stocks in favor of the safe-haven Japanese yen. If the crisis continues, the yen could make further gains against the greenback.
The Brexit negotiations have resumed in Brussels, as the two sides are meeting for a third round of talks this week. There are large gaps between the sides, and the EU's chief negotiator, Michel Barnier, has urged the UK to show more "seriousness" in its positions. For its part, the British team has called for more flexibility from the Europeans. Britain wants to discuss a future trading relationship with the EU at the same time that points in contention are dealt with, but the Europeans insist on solving the contentious issues first, such as the size of Britain's bill and the jurisdiction of the European High Court on European citizens living in the UK. With plenty of bad blood and distrust between the sides, the negotiations promise to be slow and challenging.
At the Jackson Hole meeting last week, Yellen did not discuss interest rate policy, choosing instead to emphasize that the financial regulations put in place since the financial crisis in 2008 should not be undermined. Her message appeared aim at Donald Trump, who has expressed his intention to relax banking and financial regulations which he has argued are hampering business. The markets remain skeptical about a third and final rate hike this year, as the odds of an increase in December have been falling – currently, the odds a December hike are at 35%, down from 42% a month ago.
Consumer Confidence Remains Buoyant
Consumer confidence climbed further in August as continued strengthening in the labor market bolstered views of current economic conditions. Inflation expectations edged down and remain a challenge for the Fed.
A Better Present and a Better Future
Consumer confidence remained buoyant in August according to the latest survey by the Conference Board. The Conference Board's index rose 2.9 points to 122.9, beating the market's expectations for a reading of 120.7. At this level, consumer confidence is just a shade below the 16-year high set in March and well above last year's average of 99.8.
Pushing the index higher this month were improved assessments of both current conditions and expectations about the future. The expectations component rose one point to 104.0, but remains below the cycle high set in March. While the expectations component surged in the wake of last year's election, assessments of the present situation have been improving more gradually. In August, however, the present situation index rose nearly 6 points, putting it at the highest level since 2001.
The Consumer Confidence Index puts more emphasis on labor market conditions than other sentiment measures, which is a major reason why the index remains at a high level. Views of the labor market continued to improve in August as hiring has remained strong and job openings are at record highs. The share of respondents reporting jobs as "plentiful" rose to 35.4 percent in August, while the share believing jobs were "hard to get" fell to 17.3 percent. The difference between these two series—the labor differential—jumped to 18.1 percentage points and suggests further tightening in the labor market. Views of business conditions also improved in August, with more respondents rating business conditions as "good."
The favorable view of labor market conditions has lent support to consumers' views of future income. The share of consumers expecting to see incomes increase over the next six months continued to move up, while the share expecting a decrease shrunk further.
Inflation expectations headed down a tick over the month and are back at the lows of this cycle. While expectations for higher income alongside weaker inflation imply consumers expect to see real income gains, depressed views of future inflation remain a hurdle for the Fed.
Harvey Headaches to Come
The cutoff date for the survey was August 16, ahead of the havoc wrought by Hurricane Harvey and continued rain fall along the Gulf Coast. As a result, we would not be surprised to see the index fall in September. In the month following Hurricane Katrina, the index tumbled 18 points. That said, the hit to confidence was relatively short lived. Within five months, the consumer confidence index rebounded to its pre-Katrina level. While it is still too early to tell the extent of the damage done by Hurricane Harvey, we expect continued strength in the labor market to help overcome the near term setbacks related to the storm.
Missile from North Korea Spikes Demand for Gold
The main event on the market came from the missile launched by North Korea that flew over Japanese air space and fell just East of the country. This resulted in a spike in volatility and demand for safe haven assets like the yen and gold has increased drastically.
The EUR/USD overcame the psychologically important level of 1.2000 as interest rose in the euro as a funding currency. The positive impulse accelerated also due to the price hitting stop orders after breaking through 1.2000.
The German Gfk consumer climate index increased to 10.9 in September that is 0.1 above the expected level and the preliminary report on French GDP showed an increase of 0.5% for the second quarter which was in line with the forecast. The situation for the greenback slightly improved after the release of the Conference Board consumer confidence index, which has grown to 122.9 in August, 2.0 above the predicted figure.
On the background of geopolitical tensions, investors have turned to gold as a defensive asset. Alongside we have the rising possibility of the Fed looking like it might not raise interest rates again this year and this stimulated the bulls to push the price far above the important level of 1,300 US dollars per troy ounce.
Tomorrow volatility on the currency markets will remain high due to the release of the preliminary report on US Gross Domestic Product for the second quarter of 2017 and from the Reserve Bank of New Zealand Governor's speech.
EUR/USD
The EUR/USD was able to overcome the important resistance line at 1.2000 that opened the way for the continued increase up to 1.2200. The RSI on the 15-minute chart has left the overbought zone and the upward dynamics may continue after the end of the current correction. In order to switch to a negative trend, the quotes need to break through the local low near 1.1950.
USD/JPY
The USD/JPY broke through the inclined support line and the 108.85 mark, and fixing below it may lead to further drops to 108.00 and 106.60. On the 15-minute chart we see the divergence between the price and MACD signal line, this points to a possible increase, sooner rather than later. In this case the price may return to 109.60 and 110.30.
XAU/USD
After overcoming the psychologically important 1300 mark, we have seen growth accelerate and price fixing above 1315. This may become a signal to buy with the growth potential up to 1330 and 1350. On the other hand, breaking through 1315 and the SMA100 on the 15-minute chart may stimulate the bears to pull the quotes down to potential targets at 1305 and 1295.
Yen Posts Gains as Korea Tensions Climb
USD/JPY has posted gains for a third straight day on Tuesday. In North American trade, the pair is trading at 108.76, down 0.36% on the day. On the release front, Japanese Household Spending posted a strong gain of 0.8%, well above the forecast of -0.2%. The Japanese unemployment rate remained unchanged at 2.8%, matching the forecast. In the US, CB Consumer Confidence improved to 122.9, beating the estimate of 120.9 points. Later in the day, Japan releases Retail Sales, which is expected to slow to 1.1%. On Wednesday, there are two key events in the US – ADP Nonfarm Payrolls and Preliminary GDP.
North Korea is back in the news again, as the rogue country fired a missile over Japanese territory on Tuesday. Japan and the US have sharply condemned the missile launch, and with tensions once again climbing in the Korean peninsula, nervous investors have moved a way from stocks in favor of the safe-haven Japanese yen. If the crisis continues, the yen could make further gains against the greenback.
At the Jackson Hole meeting last week, Yellen did not discuss interest rate policy, choosing instead to emphasize that the financial regulations put in place since the financial crisis in 2008 should not be undermined. Her message appeared aim at Donald Trump, who has expressed his intention to relax banking and financial regulations which he has argued are hampering business. The markets remain skeptical about a third and final rate hike this year, as the odds of an increase in December have been falling – currently, the odds a December hike are at 35%, down from 42% a month ago.
Like other Western economies, Japan remains gripped with low inflation. This has resulted in the Bank of Japan keeping in place its ultra-accommodative monetary policy. Unlike the US and Europe, however, the BoJ has given no indications of tightening policy anytime soon, insisting that that inflation must first rise closer to its target of 2%. The economy is headed in right direction, as GDP has expanded for six consecutive quarters. In the second quarter, GDP impressed with a gain of 1.0%, well above the forecast of 0.6%. Still, with inflation nowhere near the BoJ's target, the bank's radical stimulus program is likely to remain in place for the foreseeable future.
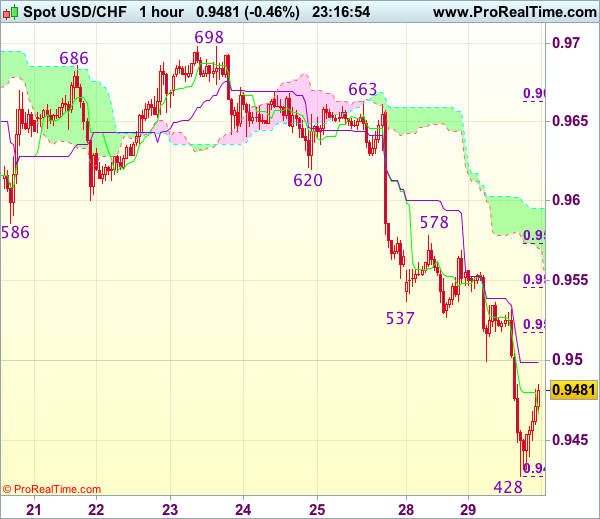
Trade Idea Wrap-up: USD/CHF – Sell at 0.9530
USD/CHF - 0.9475
Most recent candlesticks pattern : N/A
Trend : Down
Tenkan-Sen level : 0.9466
Kijun-Sen level : 0.9499
Ichimoku cloud top : 0.9595
Ichimoku cloud bottom : 0.9570
Original strategy :
Sell at 0.9520, Target: 0.9420, Stop: 0.9555
Position : -
Target : -
Stop : -
New strategy :
Sell at 0.9530, Target: 0.9430, Stop: 0.9565
Position : -
Target : -
Stop : -
As the greenback has recovered after falling to 0.9428, suggesting minor consolidation above this level would be seen and test of the Kijun-Sen (now at 0.9499) and then 0.9515-20 (38.2% Fibonacci retracement of 0.9663-0.9428), however, previous support at 0.9537 should limit upside and bring another decline later, below said support at 0.9428 would extend recent decline to 0.9400, however, loss of momentum should prevent sharp fall below 0.9370-75 and reckon 0.9350 would hold.
In view of this, would not chase this fall at current level and we are looking to sell dollar on recovery as previous support at 0.9537 should turn into resistance and limit dollar’s upside, bring another decline. Only above resistance at 0.9578-83 would abort and signal low is formed, bring a stronger rebound towards 0.9620.
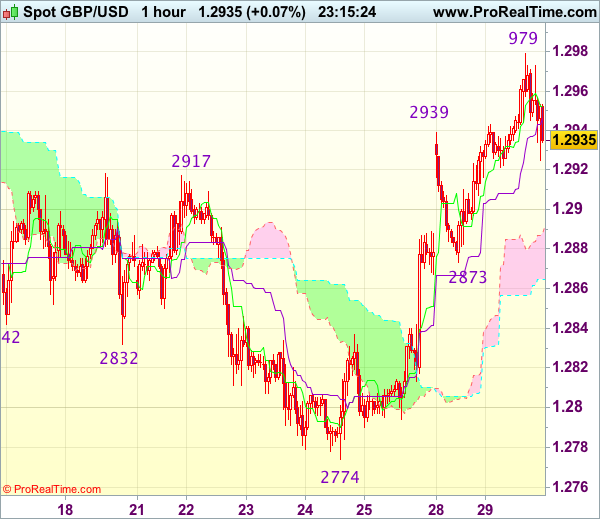
Trade Idea Wrap-up: GBP/USD – Buy at 1.2880
GBP/USD - 1.2940
Most recent candlesticks pattern : N/A
Trend : Near term up
Tenkan-Sen level : 1.2952
Kijun-Sen level : 1.2946
Ichimoku cloud top : 1.2888
Ichimoku cloud bottom : 1.2865
Original strategy :
Buy at 1.2900, Target: 1.3000, Stop: 1.2865
Position : -
Target : -
Stop : -
New strategy :
Buy at 1.2880, Target: 1.2980, Stop: 1.2845
Position : -
Target : -
Stop : -
As cable has eased after intra-day rise to 1.2979, suggesting minor consolidation below this level would be seen and pullback to 1.2920 and then 1.2900 cannot be ruled out, however, still reckon support at 1.2873 would contain downside and bring another rise later, above said resistance would add credence to our view that a temporary low has been formed at 1.2774 last week and extend this rise for retracement of recent decline to 1.3000 and later towards previous resistance at 1.3032 which is likely to hold from here.
In view of this, we are looking to buy sterling on pullback as support at 1.2873 should limit downside. Below the lower Kumo (now at 1.2865) would defer and signal first leg of upmove from 1.2774 has ended, risk weakness to 1.2840-45 but support at 1.2813 should remain intact, bring another rebound later.
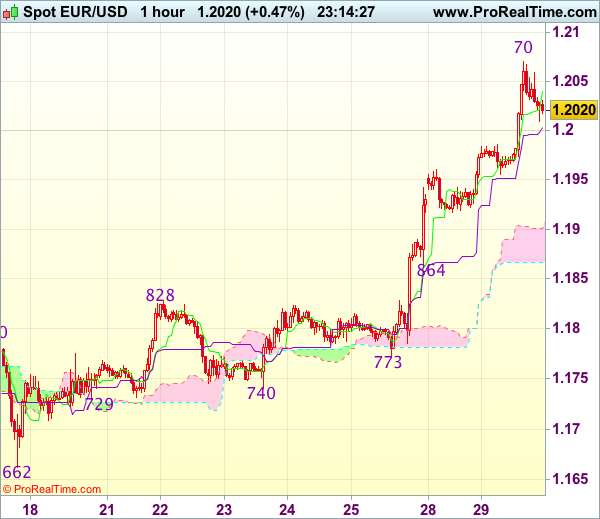
Trade Idea Wrap-up: EUR/USD – Buy at 1.1965
EUR/USD - 1.2025
Most recent candlesticks pattern : N/A
Trend : Up
Tenkan-Sen level : 1.2040
Kijun-Sen level : 1.2003
Ichimoku cloud top : 1.1901
Ichimoku cloud bottom : 1.1867
Original strategy :
Buy at 1.1965, Target: 1.2065, Stop: 1.1930
Position : -
Target : -
Stop : -
New strategy :
Buy at 1.1965, Target: 1.2065, Stop: 1.1930
Position : -
Target : -
Stop : -
As euro’s upmove accelerated after last week’s anticipated rally above previous resistance at 1.1910 (now support), adding credence to our bullish view that recent upmove is still in progress and may extend headway to 1.2070 and then 1.2095-00, however, near term overbought condition should limit upside and reckon 1.2150-55 (61.8% projection of 1.1119-1.1910 measuring from 1.1662) would hold from here, bring retreat later.
In view of this, would not chase this rise here and would be prudent to reinstate long on pullback as 1.1955-65 should limit downside. Only below 1.1930 would defer and risk test of support area at 1.1910-13 which is likely to hold from here.
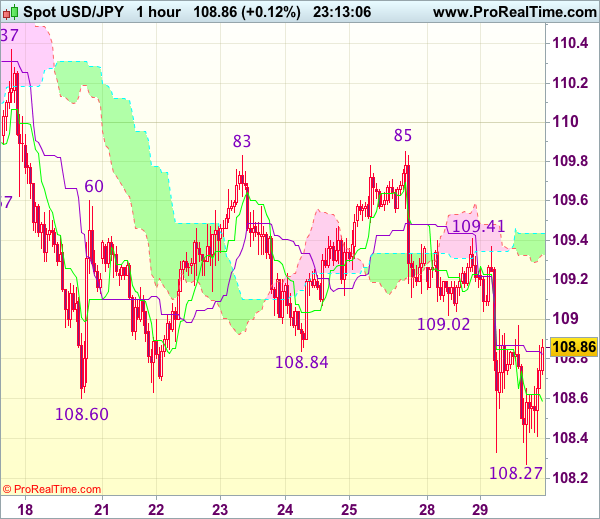
Trade Idea Wrap-up: USD/JPY – Stand aside
USD/JPY - 108.85
Most recent candlesticks pattern : N/A
Trend : Near term down
Tenkan-Sen level : 108.59
Kijun-Sen level : 108.82
Ichimoku cloud top : 109.44
Ichimoku cloud bottom : 109.33
Original strategy :
Sell at 109.15, Target: 108.15, Stop: 109.50
Position : -
Target : -
Stop : -
New strategy :
Stand aside
Position : -
Target : -
Stop : -
Although the greenback fell marginally to 108.27, as dollar has rebounded after holding above previous support at 108.13, suggesting consolidation above this level would be seen and another corrective bounce to 109.15-20 cannot be ruled out, however, reckon resistance at 109.41 would limit upside and bring another decline later, below said support at 108.27 would bring retest of 108.13 but only break of this 2017 low confirm early decline from 118.66 top has resumed and bring subsequent fall to 108.05-06 (50% projection of 114.50-108.73 measuring from 110.95) and later 117.70, having said that, 117.35-40 (61.8% projection) would hold.
In view of this, would not chase this fall here and would be prudent to stand aside for now. Only break of resistance at 109.41 (yesterday’s high) would signal low is formed, bring a stronger rebound to 109.60, then towards resistance at 109.85.