Sample Category Title
Trade Idea Update: USD/CHF – Sell at 0.9520
USD/CHF - 0.9457
Original strategy :
Sell at 0.9520, Target: 0.9420, Stop: 0.9555
Position : -
Target : -
Stop : -
New strategy :
Sell at 0.9520, Target: 0.9420, Stop: 0.9555
Position : -
Target : -
Stop : -
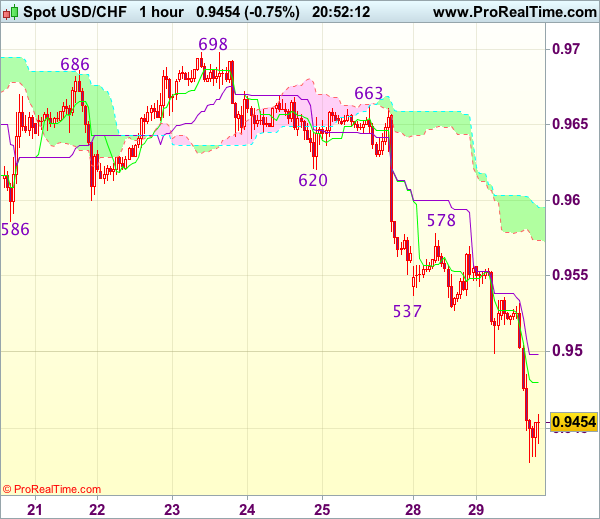
As the greenback has dropped again after brief recovery, adding credence to our view that top has been formed at 0.9773 earlier and bearishness is seen for the erratic decline from there to extend weakness to 0.9400-10, however, near term oversold condition should prevent sharp fall below 0.9370-75 and reckon 0.9350 would hold from here, risk from there has increased for a rebound later.
In view of this, would not chase this fall at current level and we are looking to sell dollar on recovery as previous support at 0.9537 should turn into resistance and limit dollar’s upside, bring another decline. Only above resistance at 0.9578-83 would abort and signal low is formed, bring a stronger rebound towards 0.9620.
GBP/USD Rejected from 50 Day Moving Average
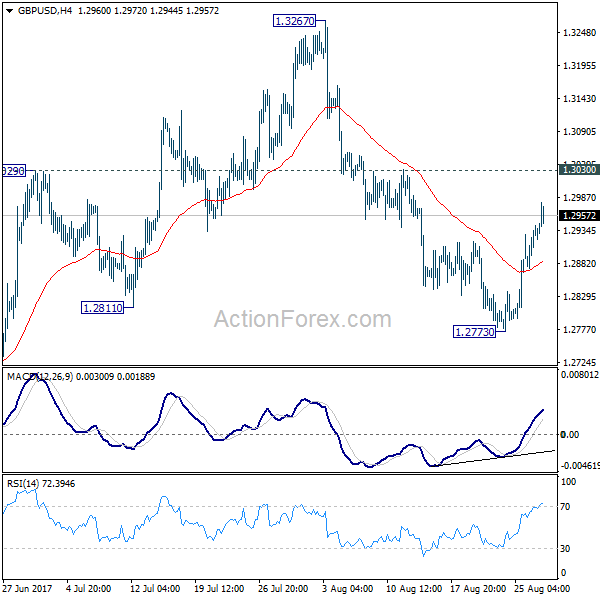
Broad-based U.S dollar weakness provoked a bullish move above the 1.2920 level, however, sterling has been strongly rejected from 1.2979 level, which represents the GBPUSD pairs daily time frame, 50 period moving average.
At present, the pair is trading around the 1.2950 level, as traders await the start of the U.S trading session, with North Korea and a key speech Federal Reserve voting member Charles Evans in focus.
GBPUSD is strongly bullish on an intraday basis, with the pair now trading back above both 100-day and 200-day moving averages.
Technical resistance is found at 1.2980, while the1.3000 level offers strong psychological resistance. Above the 1.3000 level, the 50 percent Fibonacci retracement of the 1.2773 price low, to the 1.3268 high, is found at 1.3020.
To the downside, the M5 time frame, 200 period moving average is found at 1.2940. The 100-day moving average offers solid intraday support, at 1.2920, with the 1.2890 level acting as critical weekly support.
EUR/USD Hits 1.2070
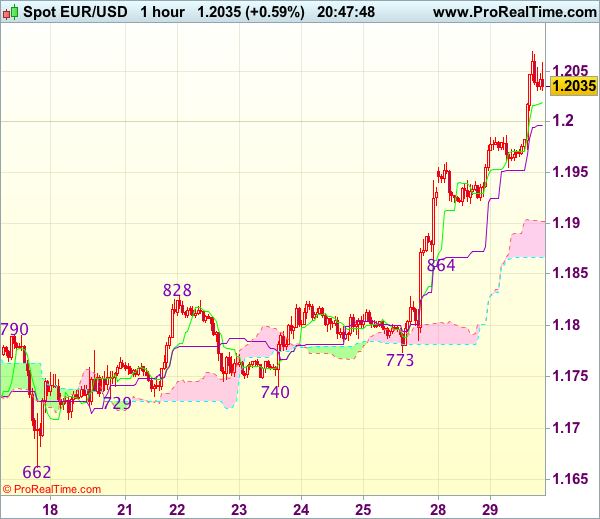
The single currency has broken above the psychological 1.20 level, hitting 1.2070, in a busy European trading session, that saw the euro move to a 27-month trading high against the U.S dollar.
During the upcoming U.S trading session, the euro may soon start to challenge to the 1.2100 level, as selling in the U.S dollar index accelerates, with the greenback now firmly technically and fundamentally bearish.
Going forward, if the EURUSD pair can hold price action above the key 1.2030 support level, buyers should take the pair for a further attempt at the 1.2070 level.
Key technical resistance above the 1.2070 level is located at 1.2100, 1.2120, with historical EURUSD Fibonacci resistance found at the 1.2160 level.
To the downside, the July 2012 price low is now critical EURUSD resistance turned support, at 1.2030. Below 1.2030, the 1.2000 level is strong psychological support, with the 1.1960 level now offering the foremost support below 1.2000.
Trade Idea Update: GBP/USD – Buy at 1.2900
GBP/USD - 1.2950
Original strategy :
Buy at 1.2920, Target: 1.3020, Stop: 1.2885
Position : -
Target : -
Stop : -
New strategy :
Buy at 1.2900, Target: 1.3000, Stop: 1.2865
Position : -
Target : -
Stop : -
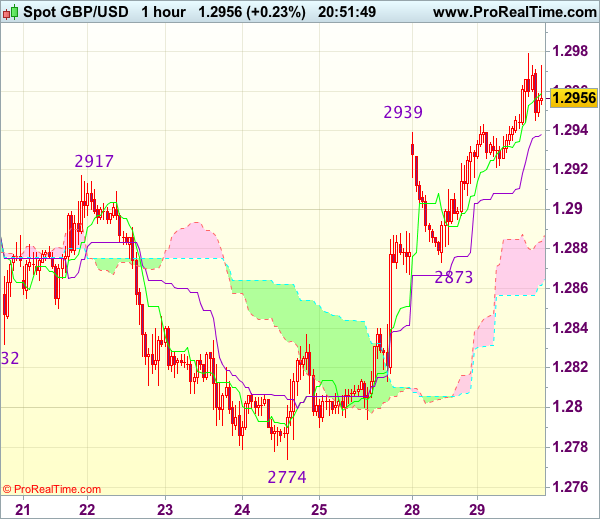
As cable surged again after finding renewed buying interest at 1.2873 yesterday, adding credence to our view that a temporary low has been formed at 1.2774 last week and bullishness remains for the rise from there to bring retracement of recent decline, hence further gain to 1.3000 and later towards previous resistance at 1.3032 would be seen, however, near term overbought condition should limit upside and reckon 1.3075-80 would hold from here.
In view of this, we are looking to buy sterling on pullback as 1.2900 should limit downside. Below 1.2895-00 would defer and risk test of said support at 1.2873 but only break there would signal first leg of upmove from 1.2774 has ended, risk weakness to 1.2840-50 but support at 1.2813 should remain intact, bring another rebound later.
Trade Idea Update: EUR/USD – Buy at 1.1965
EUR/USD - 1.2032
Original strategy :
Buy at 1.2000, Target: 1.2100, Stop: 1.1965
Position : -
Target : -
Stop : -
New strategy :
Buy at 1.1965, Target: 1.2065, Stop: 1.1930
Position : -
Target : -
Stop : -
As euro’s upmove has accelerated after last week’s anticipated rally above previous resistance at 1.1910 (now support), adding credence to our bullish view that recent upmove is still in progress and may extend headway to 1.2070 and then 1.2095-00, however, near term overbought condition should limit upside and reckon 1.2150-55 (61.8% projection of 1.1119-1.1910 measuring from 1.1662) would hold from here, bring retreat later.
In view of this, would not chase this rise here and would be prudent to reinstate long on pullback as 1.1955-65 should limit downside. Only below 1.1930 would defer and risk test of support area at 1.1910-13 which is likely to hold from here.
Gold Flies Alongside North Korea’s Missile
Overnight, North Korea fired a missile that flew over Japan, violating the nation's airspace. This marked further escalation in the region's geopolitical tensions, which triggered a classic risk-off market reaction. Safe haven assets such as gold, the Japanese yen, and the Swiss franc rallied on the news, while major equity indices edged lower.
In the short-term, we expect market action to be driven by incoming headlines on the subject. Japanese PM Abe already called for fresh UN sanctions on North Korea, which we view as a "soft" and diplomatic approach. Nonetheless, key US officials (such as the President) have not yet commented on this latest show of force by the North Korean regime. If we were to see another round of hard rhetoric from the US administration, or some form of action, then risk-aversion could continue to drive markets. Specifically, gold and other safe havens could gain further, while riskier assets could remain under pressure. Having said that, unless the situation intensifies to the degree of military intervention, we don't expect this negative sentiment to remain the main market theme for too long.
Gold surged during the European afternoon Monday, to break above the key psychological barrier of 1300 (S2). The metal gapped further up during the Asian morning Tuesday after North Korea fired a missile over Japan to hit resistance at 1325 (R1). The price structure on the 4-hour chart suggests a short-term uptrend marked by the uptrend line taken from the low of 10th of July. Thus, we would expect a clear break above 1325 (R1) to set the stage for more bullish extensions, perhaps towards our next resistance level of 1340 (R2). The trigger for further advances may be further escalation in geopolitical tensions.
Having said that though, given that the latest rally appears overextended, and also taking account our proximity to the return line drawn from the peak of the 7th of July, we stay careful of a possible retreat before the bulls decide to take charge again. A dip below 1313 (S1) may confirm the case and is possible to open the way for a test near the 1300 (S2) zone as a support this time. Our short-term oscillators enhance our concerns. The RSI shows signs that it could top within its above-70 zone, while the MACD, although above both its zero and trigger lines, shows signs that it could start topping as well.
Zooming out to the daily chart, we see that the 1300 (S2) zone acted as the upper bound of the wide range the yellow metal has been trading within since the 31st of January, between that hurdle and the 1200 territory. As such, its clearing make us confident that the medium-term outlook may have also turned somewhat positive.
EUR/USD Mid-Day Outlook
Daily Pivots: (S1) 1.1935; (P) 1.1959 (R1) 1.2002; More...
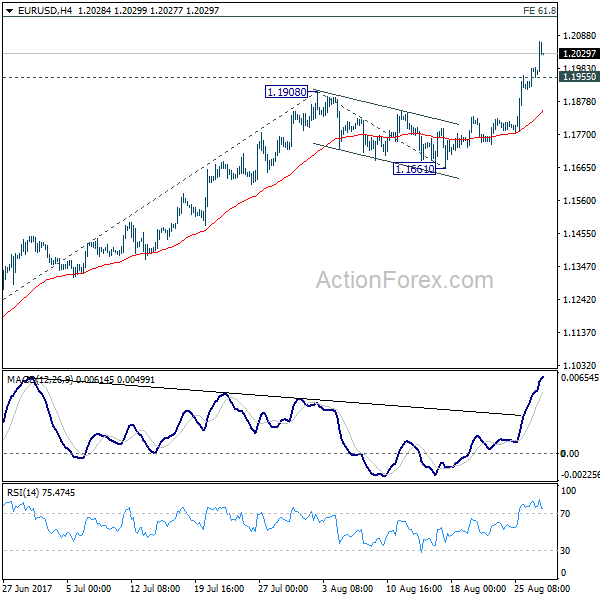
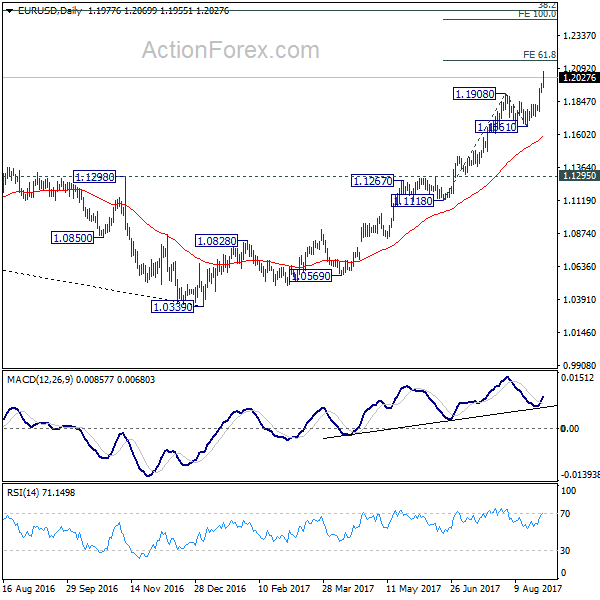
EUR/USD's rally extends to as high as 1.2069 so far. Intraday bias remains on the uprise for 61.8% projection of 1.1118 to 1.1908 from 1.1661 at 1.2149 first. Break there will target 100% projection at 1.2451 next. On the downside, below 1.1955 minor support will turn intraday bias neutral first. But retreat should be contained above 1.1661 support and bring rise resumption.
In the bigger picture, an important bottom was formed at 1.0339 on bullish convergence condition in weekly MACD. Sustained trading above 55 month EMA (now at 1.1768) will pave the way to key fibonacci level at 38.2% retracement of 1.6039 (2008 high) to 1.0339 (2017 low) at 1.2516. While rise from 1.0339 is strong, there is no confirmation that it's developing into a long term up trend yet. Hence, we'll be cautious on strong resistance from 1.2516 to limit upside. For now, medium term outlook will remain bullish as long as 1.1295 support holds, in case of pull back.
GBP/USD Mid-Day Outlook
Daily Pivots: (S1) 1.2889; (P) 1.2915; (R1) 1.2959; More...
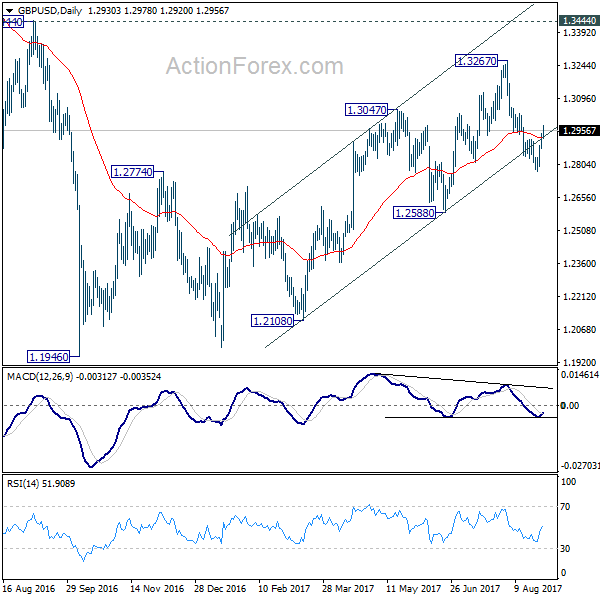
No change in GBP/USD's outlook as it's staying below 1.3030 resistance. Intraday bias remains neutral with mildly bearish outlook. We're favoring the case that correction from 1.1946 is completed at 1.3267. Below 1.2773 will target 1.2588 key near term support first. Decisive break of 1.2588 will confirm our view and target a test on 1.1946 low. Though, break of 1.3030 will dampen this bearish view and turn bias back to the upside for retesting 1.3267.
In the bigger picture, overall, price actions from 1.1946 medium term low are seen as a corrective pattern. While further rise cannot be ruled out, larger outlook remains bearish as long as 1.3444 key resistance holds. Down trend from 1.7190 (2014 high) is expected to resume later after the correction completes. And break of 1.2588 will indicate that such down trend is resuming.
Trade Idea Update: USD/JPY – Sell at 109.15
USD/JPY - 108.51
Original strategy :
Sell at 109.15, Target: 108.15, Stop: 109.50
Position : -
Target : -
Stop : -
New strategy :
Sell at 109.15, Target: 108.15, Stop: 109.50
Position : -
Target : -
Stop : -
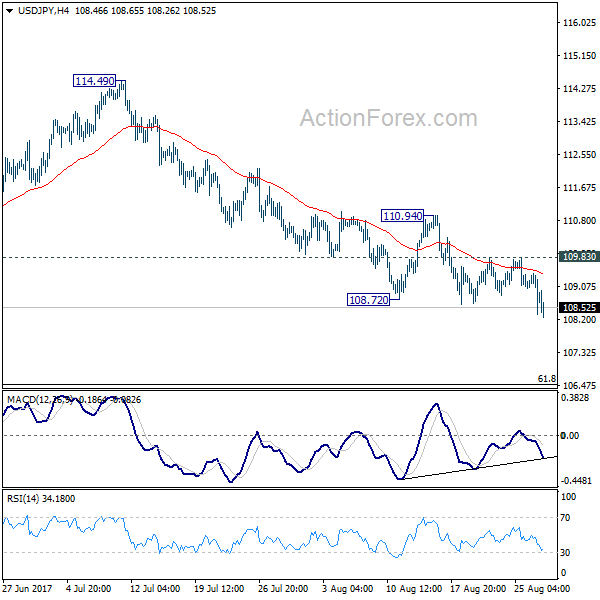
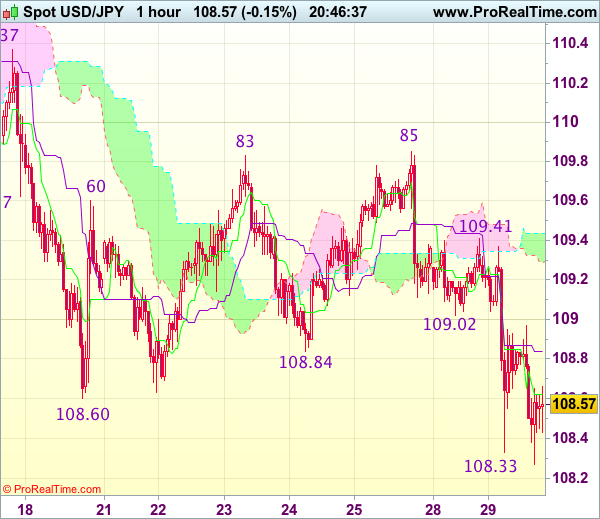
Dollar’s initial selloff below previous support at 108.60 signals recent decline from 114.50 is still in progress and further weakness to previous chart support at 108.13 (this year’s low) would be seen, break there would confirm early decline from 118.66 top has resumed and bring subsequent fall to 108.05-06 (50% projection of 114.50-108.73 measuring from 110.95) but reckon near term oversold condition would limit downside to 117.70 and 117.35-40 (61.8% projection) would hold from here, bring rebound later.
In view of this, would not chase this fall here and would be prudent to sell dollar on subsequent rebound as resistance at 109.41 (yesterday’s high) would cap upside and bring another decline. Only break of resistance at 109.85 would abort and signal a temporary low is formed instead.
USD/JPY Mid-Day Outlook
Daily Pivots: (S1) 109.04; (P) 109.23; (R1) 109.43; More...
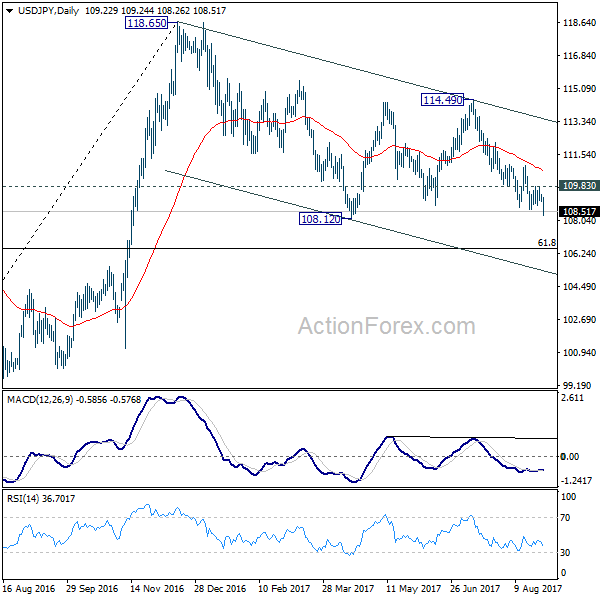
Intraday bias in USD/JPY remains on the downside as fall from 114.49 is in progress for 108.12 support. Whole corrective decline from 118.65 is possibly resuming and break of 108.12 will target 61.8% retracement of 98.97 to 118.65 at 106.48. On the upside, break of 109.83 resistance is needed to indicate short term bottoming. Otherwise, outlook will remain bearish in case of recovery.
In the bigger picture, the corrective structure of the fall from 118.65 suggests that rise from 98.97 is not completed yet. Break of 118.65 will target a test on 125.85 high. At this point, it's uncertain whether rise from 98.97 is resuming the long term up trend from 75.56, or it's a leg in the consolidation from 125.85. Hence, we'll be cautious on topping as it approaches 125.85. If fall from 118.65 extends lower, downside should be contained by 61.8% retracement of 98.97 to 118.65 at 106.48 and bring rebound.