Sample Category Title
CRUDE OIL Short-Term Bearish
Crude oil is trading lower. Hourly support is given at 45.40 (17/08/2017 high). Strong resistance can be found at 50.41 (31/07/2017). Expected to show continued short-term bearish move.
In the long-term, crude oil has recovered after its sharp decline last year. However, we consider that further weakness are very likely. Strong support lies at 35.24 (05/04/2016) while resistance can now be found at 55.24 (03/01/2017 high).
SILVER Bullish Increase
Silver's bullish pressures are strong. Hourly resistance is given at 17.32 (18/08/2017 high) while support can be found at 16.58 (15/08/2017 high). The commodity lies in a short-term uptrend channel. Expected to show another leg higher.
In the long-term, the death cross indicates that further downsides are very likely. Resistance is located at 25.11 (28/08/2013 high). Strong support can be found at 11.75 (20/04/2009).
GOLD Strong Bullish Momentum
Gold is surging. Hourly support is given at a distance 1251 (08/08/2017 low). Stronger support lies at 1204 (10/07/2017 high). Expected to show continued increase.
In the long-term, the technical structure suggests that there is a growing upside momentum. A break of 1392 (17/03/2014) is necessary ton confirm it, A major support can be found at 1045 (05/02/2010 low)
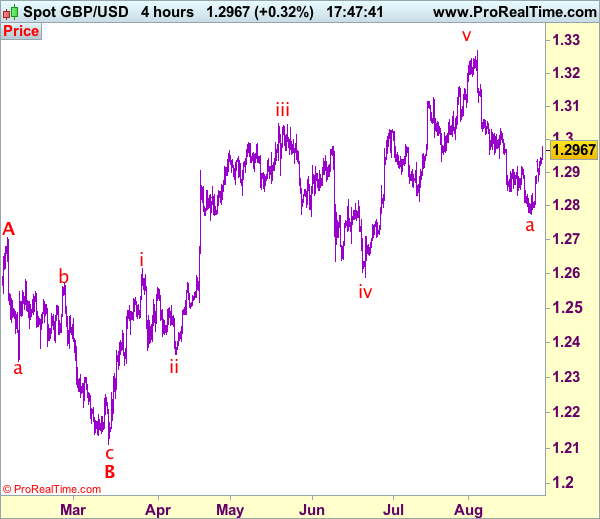
GBP/USD Elliott Wave Analysis
GBP/USD – 1.2955
Despite falling to 1.2774 (exactly 38.2% Fibonacci retracement of 1.1986-1.3269), the subsequent stronger-than-expected rebound suggests first leg of decline from 1.3269 has ended there and consolidation with initial upside bias would be seen for further gain to 1.3020-25 (50% Fibonacci retracement of 1.3269-1.2774), however, reckon upside would be limited to 1.3080 (61.8% Fibonacci retracement) and price should falter below 1.3165, bring another decline in late Q3.
Our preferred count on the daily chart is that cable's rebound from 1.3500 (wave (A) trough) is unfolding as a wave (B) with A ended at 1.7043, followed by triangle wave B and wave C as well as wave (B) has possibly ended at 1.7192, below support at 1.4232 would add credence to this count, then further fall to 1.4000 level would follow but reckon downside would be limited to 1.3655 support and price should stay above previous support at 1.3500.
On the downside, whilst initial pullback to 1.2900-10 and possibly 1.2870-75 is likely, if our view that a temporary low formed at 1.2774 is correct, downside should be limited to 1.2810-20 and bring another rebound later to aforesaid upside target. Below 1.2800 would risk test of 1.2774, however, break there is needed to extend the fall from 1.3269 top to 1.2700 and later towards 1.2620-30 (50% Fibonacci retracement), however, price should stay well above previous chart support at 1.2589, bring rebound later.
Recommendation: Exit short entered at 1.2910 and stand aside for this week.
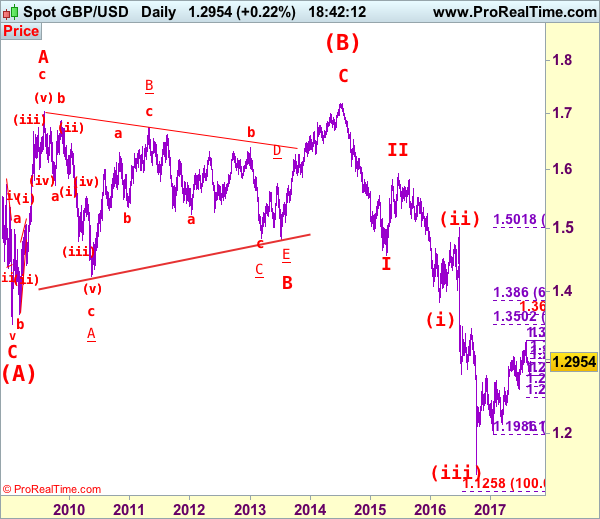
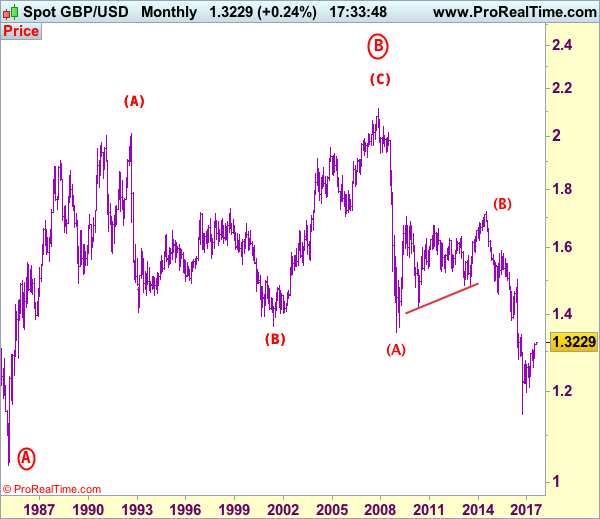
Longer term - Cable's rise from 1.0520 (Feb 1985) to 2.0100 (September 1992) is seen as [A], the decline to 1.3682 is labeled as (B) and (C) wave rally has ended at 2.1162 (9 Nov, 2007) which is also the top of larger degree wave B with circle. The selloff from there is a 5-waver with wave (A) ended at 1.3500 (23 Jan 2009), wave (B) itself is labeled as A: 1.6733, triangle wave B: 1.4813 and wave C as well as top of wave (B) ended at 1.7192 (2014), hence the selloff from there is an impulsive wave (C) with wave I : 1.4566, wave II 1.5930, an extended wave III is unfolding and already exceeded our downside target at 1.3500 and 1.3000, hence weakness to 1.2500 and possibly 1.2000 cannot be ruled out, however, price should stay well above psychological level at 1.0000.
GBP/JPY Elliott Wave Analysis
GBP/JPY – 146.05
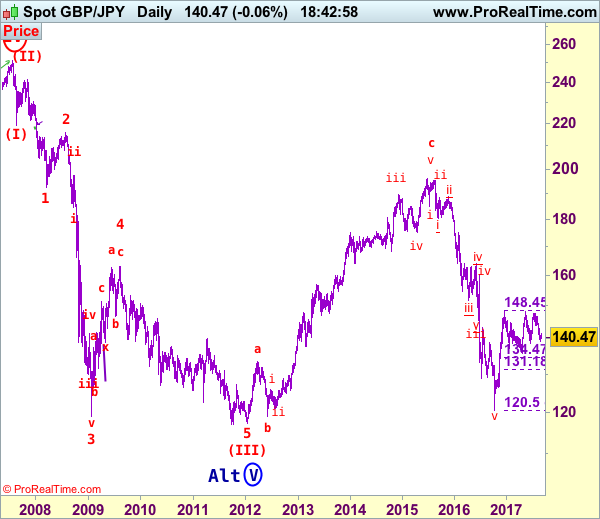
Sterling only recovered to 143.20 before dropping again, the pair exceeded all our downside targets (including 141.25, 140.00 and 139.85), however, as the British pound found support at 139.35 and has rebounded, suggesting consolidation above this level would be seen and another bounce to 141.40-45, then 142.00 cannot be ruled out, however, reckon said resistance at 143.20 would limit upside and bring another decline. A break of said support at 139.35 would signal the fall from 147.75 is still in progress and bring test of previous chart support at 138.70 which is likely to hold on first testing.
Our preferred count is that larger degree wave V with circle is unfolding from 251.12 with wave (I) 219.34, (II): 241.38 and wave (III) is subdivided into 1: 192.60, 2: 215.89 (23 Jul 2008) and wave 3 ended at 118.87 earlier in 2009. The correction from there to 162.60 is wave 4 which itself is a double three and is labeled as first a-b-c ended at 151.53, followed by wave x at 139.03, 2nd a ended at 162.60, 2nd b at 146.75 and 2nd c leg of wave 4 ended at 163.00. Therefore, the decline from 163.00 to 116.85 is now treated as wave 5 which also marked the end of larger degree wave (III), hence wave (IV) major correction has commenced for retracement of the wave (III) from 241.38 and upside target at 183.95-00 (50% Fibonacci retracement of the wave (II) from 241.38) had been met, a drop below 160.00 would suggest wave (IV) has ended at 195.85, bring decline in wave (V) for initial weakness to 130 (already met) and 120.
On the upside, although current rebound from 139.35 may bring initial recovery to 142.00 and possibly 142.40-50, reckon upside would be limited and renewed selling interest should emerge around 143.20 resistance, bring another decline later. A daily close above 143.20 would defer and suggest the fall from 147.75 has formed a temporary low and bring a stronger rebound to 144.00 and possibly towards 144.50-60 before prospect of another decline next month.
Recommendation: Sell again at 143.15 for 140.15 with stop above 145.50.
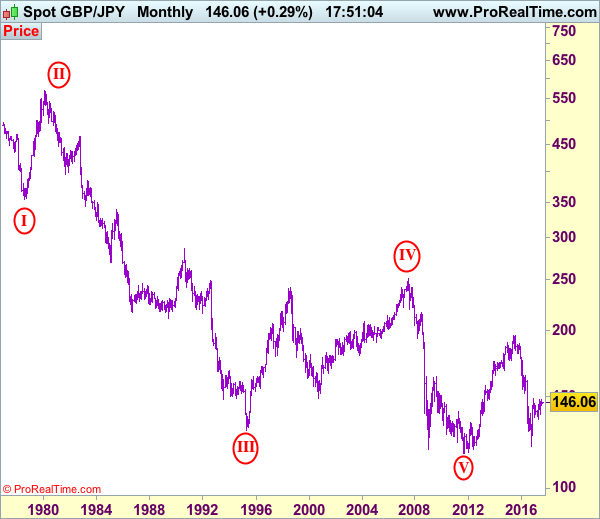
The long-term downtrend from 570.99 (29 Feb 1980) is labeled as an impulsive wave with III with circle ended at 129.77 (20 Apr 1995) and the corrective rebound to 251.12 (20 Jul 2007) is treated as wave IV with circle and the wave V with circle selloff from 251.12 has possibly ended at 116.80 (almost reached our indicated target at 116.00) and major correction has commenced from there and indicated upside target at 183.90-00 (50% Fibonacci retracement of 251.10-116.85) had been met, reckon upside would be limited to 199.80-90 (61.8% Fibonacci retracement) and bring wave (V) decline in later part of 2017.
BITCOIN Monitoring 4500 For The Third Time
Bitcoin bullish rise continues after short pause. Resistance is at all-time high at 4480 (17/08/2017 high) is within sight. Hourly support lies very far at 2403 (26/07/2017 low). The road is wide open for another bullish move.
In the long-term, the digital currency has had an exponential growth. There are decent likelihood that the asset will consolidate above $1500. Long-term support is given at $1464 (04/05/2017 low).
EUR/CHF Consolidation Around 1.14
EUR/CHF recovery bounce has stalled below downtrend resistance located at 1.1407. Hourly support is located at 1.1260 (04/08/2017 low). Expected to show further consolidation.
In the longer term, the technical structure has reversed. Strong resistance at 1.1200 (04/02/2015 high) has been broken. Yet,the ECB's QE programme is likely to cause persistent selling pressures on the euro, which should weigh on EUR/CHF. Supports can be found at 1.0184 (28/01/2015 low) and 1.0082 (27/01/2015 low).
EUR/GBP Buying Pressures Continue
EUR/GBP's buying pressures continues. Hourly resistance lies at 0.9415 (10/07/2017 high). Hourly support is given at 0.9189 (24/08/2017 low). Downside risks are nonetheless important.
In the long-term, the pair has largely recovered from recent lows in 2015. The technical structure suggests a growing upside momentum. The pair is trading above from its 200 DMA. Strong resistance can be found at 0.9500 psychological level.
Trade Idea: GBP/USD – Stand aside
GBP/USD – 1.2963
Original strategy :
Sold at 1.2910, stopped at 1.2970
Position: - Short at 1.2910
Target: - 1.2710
Stop: - 1.2970
New strategy :
Stand aside
Position: -
Target: -
Stop:-
As cable found renewed buying interest at 1.2873 yesterday and staged a stronger-than-expected rebound, suggesting a temporary low has been formed at 1.2774 last week and consolidation with upside bias is seen for this rebound to bring retracement of recent decline from 1.3269, hence further gain to 1.3000 and possibly towards resistance at 1.3032 would be seen, however, near term overbought condition should limit upside to 1.3080, bring retreat later.
In view of this, would not chase this rise here and would be prudent to stand aside in the meantime. Below 1.2900-10 would bring pullback to 1.2870-75, however, reckon downside would be limited and if our new that temporary low has been formed at 1.2774 is correct, downside should be limited to 1.2820-30 and bring another rebound later.
Our preferred count on the daily chart is that cable's rebound from 1.3500 (wave (A) trough) is unfolding as a wave (B) with A ended at 1.7043, followed by triangle wave B and wave C as well as wave (B) has ended at 1.7192, the subsequent selloff is the larger degree wave (C) which is still unfolding with minor wave (III) of larger degree wave 3 ended at 1.1986, hence wave (IV) correction is in progress which could either be a triangle wave (IV) of a complex formation but upside should be limited to 1.3500 and price should falter well below 1.4000, bring another decline in wave (V) of 3 for weakness to 1.1500, then 1.1200.
AUD/USD Heading Higher
AUD/USD has broken downtrend channel. Hourly support can be found at 0.7786 (18/07/2017 low). Hourly resistance is given at 0.8066 (27/07/2017 high). Expected to further consolidate.
In the long-term, we are waiting for further signs that the current downtrend is ending. Key supports stand at 0.6009 (31/10/2008 low) . A break of the key resistance at 0.8295 (15/01/2015 high) is needed to invalidate our long-term bearish view.