
Sample Category Title
USD/CHF Candlesticks and Ichimoku Analysis
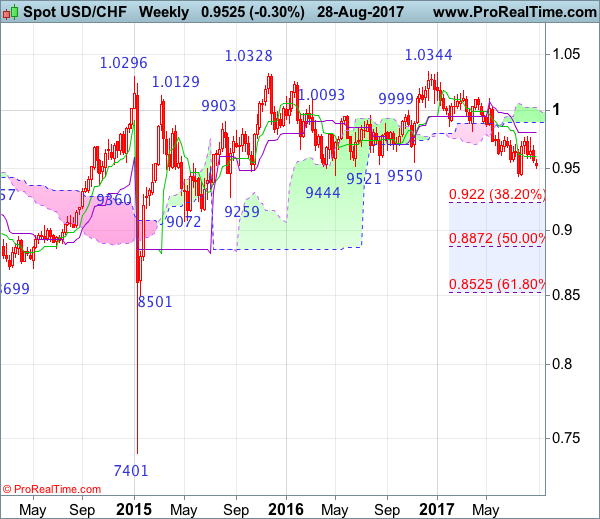
Weekly
• Last Candlesticks pattern: Shooting star
• Time of formation: 7 Mar 2017
• Trend bias: Sideways
Daily
• Last Candlesticks pattern: Morning star
• Time of formation: 9 May 2017
• Trend bias: Near term up
USD/CHF – 0.9468
As the greenback has remained under pressure after breaking below indicated previous support at 0.9583, adding credence to our bearish view that the erratic decline from 0.9773 is still in progress, hence test of another previous support at 0.9438 would be seen, break there would signal early fall from 1.0344 (2016 high) has resumed and extend weakness to 0.9390-00, then towards 0.9330-35, having said that, near term oversold condition should prevent sharp fall below previous support at 0.9259 and reckon 0.9220 (38.2% Fibonacci retracement of entire rise from 0.7401-1.0344) would hold, risk from there is seen for a rebound to take place later.
On the upside, whilst recovery to 0.9530-40 cannot be ruled out, said previous support at 0.9583 should turn into resistance and limit dollar’s upside and bring another decline to aforesaid downside targets. Above 0.9620 would defer and risk a stronger rebound to 0.9663 and possibly test of resistance at 0.9698, however, upside should still be limited and price should falter below said resistance at 0.9773, bring another selloff next month.
Recommendation: Sell at 0.9520 for 0.9320 with stop above 0.9620
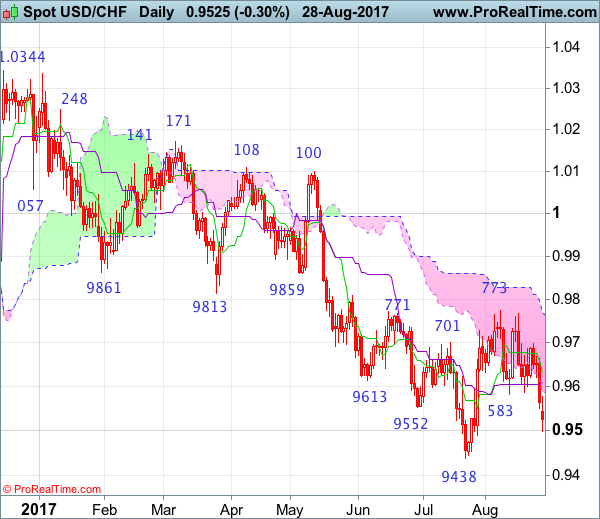
On the weekly chart, the greenback opened lower this week after breaking below previous support at 0.9583, suggesting the erratic decline from 1.0344 top has resumed and break of another previous support at 0.9438 would confirm and extend the aforesaid fall for further weakness to 0.9350, then towards previous support at 0.9259, however, near term oversold condition should prevent sharp fall below 0.9220 (38.2% Fibonacci retracement of 0.7401-1.0344) and reckon 0.9150 would hold from here, risk from there is seen for a rebound later.
On the upside, expect recovery to be limited to 0.9530-40 and said previous support at 0.9583 should turn into resistance and limit upside. A weekly close above the Tenkan-Sen (now at 0.9606) would defer and risk a stronger recovery to 0.9698 resistance, however, still reckon upside would be limited and resistance at 0.9773 should remain intact, bring another decline. Only a break of the Kijun-Sen (now at 0.9805) would abort and signal a temporary low is formed instead, bring a stronger rebound to the lower Kumo (now at 0.9894) but upside should be limited to the upper Kumo (now at 1.0023), price should falter well below resistance at 1.0100.
Geopolitics Reignites Risk Off Mode | Hurricane Harvey Impacting Oil And Dollar
Oil And Dollar To Gain From Harvey
More Bullish Move Still On Cards
Stock markets have rattled over in Asia and things are looking ugly over in Europe as well. It is a risk off mode and safe havens such as gold and the Japanese Yen extended their gains due to the recent escalation of tensions over in Asia. Investors have panicked after the North Korean missiles have flown over Japan and the president of Japan has called the action reckless. The Asian markets have felt the pain of this event and we are expecting this pain to become even starker as the counter-reaction from the US would make investors only more nervous. Statements such as "fire and fury" are the most worrying.
US futures are trading sharply lower because investors are either staying on the side lines for this dust to settle or are booking their gains.
Oil And Dollar To Gain From Harvey
The effects of Hurricane Harvey are still going to remain prominent as the flooding process continues over in the US. Less and less refineries can work and this is pushing the price of the refined products higher. Both Brent and crude oil are still holding on to their gains and we still do expect them to score more gains.
In currencies, the dollar weakness continues and the aftermath of the Jackson Hole meeting is still very much influencing the price of the dollar index. The index is more likely to continue its journey to the 91 mark and the Euro-dollar pair could touch the likes of 1.25 by the end of the third quarter.
Hurricane Harvey is going to have some serious economic impact and just how large that would be is still unclear. However, the upcoming jobs reports are likely to show one element which is that more people would be filing for unemployment benefits. If history serves us correctly, it is that in the past when a similar catastrophe occurred, the initial jobless claims spiked in the following weeks. We need to have a strong number when it comes to the labour market as that would continue to support the dollar but in the absence of such, it simply means more weakness for the dollar index.
More Bullish Move Still On Cards
The yellow metal has rallied to the highest point this year due to the geopolitical tensions and the dollar weakness. We have witnessed the highest intraday price level of 1322.41 which had not been seen since Nov 9. The price could easily touch the level of 1350 because the worst is still to come, which would be a reaction from the US. If North Korea decides to retaliate further to that reaction, it would only add fuel to the fire.
Another Wave Of Escalation In North Korean Crisis
This morning, North Korea fired what was likely to have been an intermediate range ballistic missile over Japan into the Pacific. After a short period of calm, the North Korean crisis is again escalating.
How serious is this? The missile test is clearly a strengthening show of force from North Korea to show it is not bending to US demands. That the missile is flying over Japanese territory is a clear provocation, although not the first time it has happened. As recently as 2016, North Korea fired a rocket over Okinawa. At the same time, North Korea did not go through with its plans to send the missiles close to the waters of Guam as indicated on 9 August. Kim Jong-un had said he was reconsidering this and the missiles into the Pacific could be seen as a moderation compared to the initial plans. Japanese Foreign Minister Taro Kono said the launch to the east rather than to the south towards Guam was a sign that Pyongyang had ‘flinched' in the face of US warnings.
North Korea had warned that the annual military exercises of US and South Korea taking place during these weeks would trigger a reaction. The so-called Ulchi-Freedom Guardian military exercises started earlier this month. It is not unusual that these exercises escalate tensions. Last year, North Korea launched a missile from a submarine around the time of the exercises and put its military on high alert. China asked the US and South Korea to suspend the drills this year in order to ease the conflict and pave the way for diplomatic talks.
What's next? Following today's launch, Japan has asked the United Nations Security Council to hold an emergency meeting. More sanctions may be imposed but we still see war as a very low probability as the risks involved on both sides are simply too big. Ultimately, we believe that we will have talks between the involved parties. However, before this, both sides will need to illustrate a big show of force to strengthen the positon at the negotiating table. What the response might be from the US this time is not clear. However, a military strike does not seem likely.
A diplomatic solution will be difficult to find as it will involve on the one hand North Korean demanding an end to the annual military exercises, which will be difficult to obtain given that the US and South Korea see a big threat from North Korea. Similarly, the demand from the US for North Korea to back down from its nuclear ambition is also difficult as long as North Korea sees the US as a major threat. However, a diplomatic solution would be the best outcome, as a military conflict would entail severe losses on both sides. The road will not be easy and we are likely to see continued waves of escalations before the parties are finally pushed to the negotiating table.
Market outlook. The markets reacted again with the usual safe haven flows sending equities and bond yields lower. Asian stocks took a hit again as after the recent escalation. However, things are likely to calm down again soon and markets will recover. Overall, though, the crisis is keeping risk appetite dented as long as we see these continued waves of escalation. In combination with the looming US debt limit deadline coming closer, there is a risk that markets will find it hard to gain real momentum despite positive growth numbers overall at the moment.
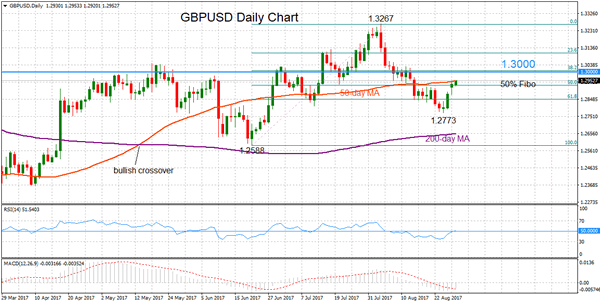
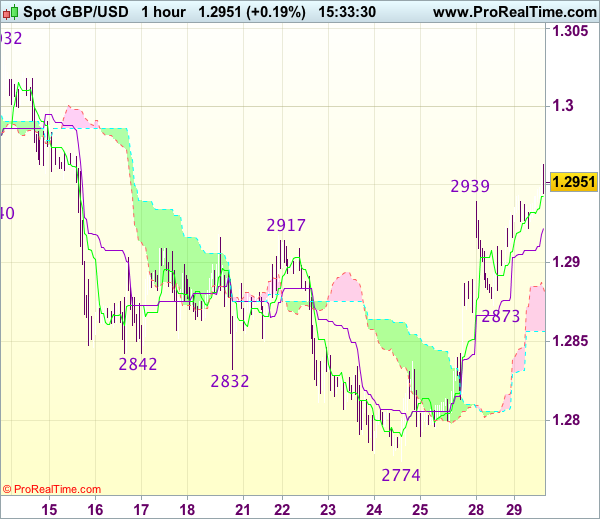
GBPUSD Tests 2-Week Highs, Neutral Outlook Remains For Medium-Term
GBPUSD is testing fresh 2-week highs at 1.2951. The pair has made a sharp recovery following a bounce from 1.2773 last week but has met resistance at the 50-day moving average (MA). The broader picture on the daily chart shows that the market is neutral.
GBPUSD is currently at a critical level with immediate support at 1.2925 – the 50% Fibonacci retracement level of the upleg from 1.2588 to 1.3267. As long as resistance holds at the 50-day MA, prices are expected to resume the downtrend from 1.3267 (August 3 high).
A move below 1.2925 would shift focus to the downside to target 1.2773 (August 24 low) and from here the next target would be the 200-day MA at 1.2655 before reaching 1.2588 (June 21 low). Such a move would shift the medium-term outlook from neutral to bearish.
Alternatively, a sustained move above the current level of the 50-day MA at 1.2953 would target the key psychological level at 1.3000. This would favor further strength with the potential to re-test the August 3 peak at 1.3267.
The neutral outlook for the medium-term is expected to hold as long as GBPUSD remains capped by the 50-day MA and if upside momentum fades. RSI has been rising towards the 50 level. A continued move higher by the indicator into bullish territory would indicate risk is to the upside for GBPUSD.
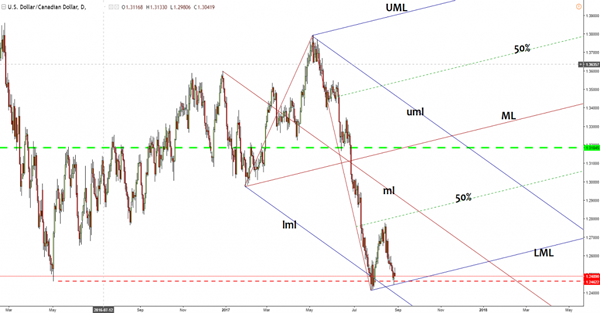
USD/CAD Another Leg Higher?
USD/CAD decreased again in the last hours and erased the early morning gains, could come back down to retest the 1.2460 static support. I’ve drawn an ascending pitchfork hoping that I’ll catch another leg higher. Price has come down and retested the lower median line (LML) and closed much above it, signaling a rebound. Only a valid breakdown below the LML will confirma further drop in the upcoming period.
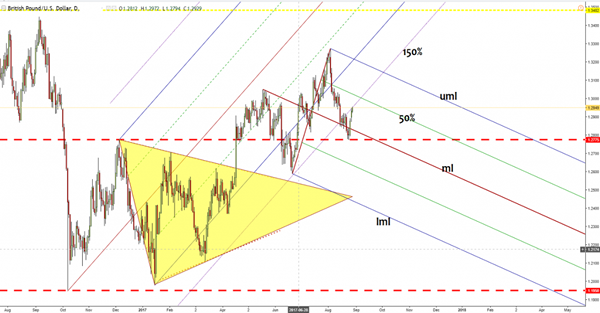
GBP/USD Bulls On The Run
GBP/USD rallied after the retest of the 1.2775 horizontal support and now is pressuring the 150% Fibonacci line (ascending dotted line). Remains to see if we’ll have a valid breakout or not, but you need to know that the perspective is bullish on the short, should reach at least the 50% Fibonacci line.
Could be attracted by the confluence between the 150% line with the 50% line. Will climb much higher if the USDX will slide further.
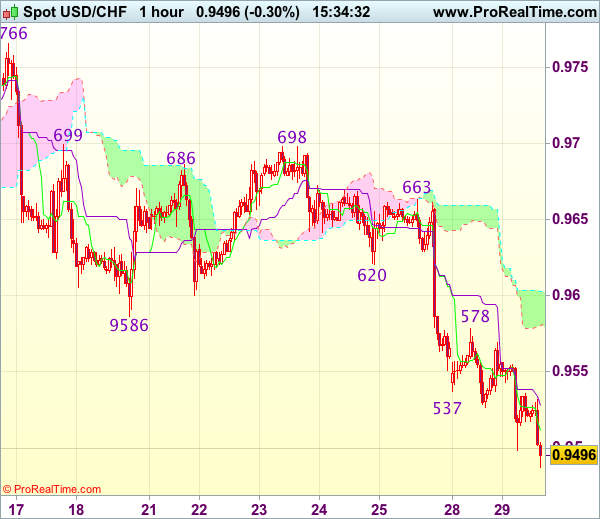
Trade Idea : USD/CHF – Sell at 0.9520
USD/CHF - 0.9467
Most recent candlesticks pattern : N/A
Trend : Down
Tenkan-Sen level : 0.9500
Kijun-Sen level : 0.9517
Ichimoku cloud top : 0.9603
Ichimoku cloud bottom : 0.9581
Original strategy :
Sell at 0.9590, Target: 0.9490, Stop: 0.9625
Position : -
Target : -
Stop : -
New strategy :
Sell at 0.9520, Target: 0.9420, Stop: 0.9555
Position : -
Target : -
Stop : -
As the greenback has dropped again after brief recovery, adding credence to our view that top has been formed at 0.9773 earlier and bearishness is seen for the erratic decline from there to extend weakness to 0.9450, then towards previous chart support at 0.9438, however, near term oversold condition should prevent sharp fall below 0.9400 and risk from there has increased for a rebound later.
In view of this, would not chase this fall at current level and we are looking to sell dollar on recovery as previous support at 0.9537 should turn into resistance and limit dollar’s upside, bring another decline. Only above resistance at 0.9578-83 would abort and signal low is formed, bring a stronger rebound towards 0.9620.
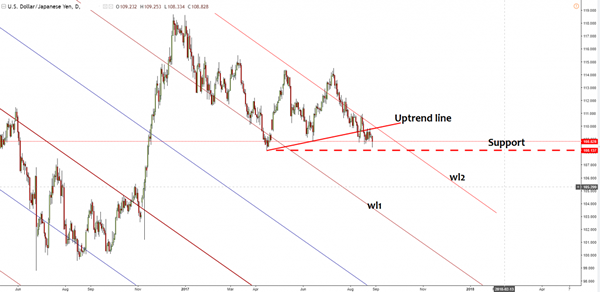
USD/JPY Additional Drop Expected
The currency pair has dropped significantly in the morning and seems too heavy to be stopped on the short term. USD is going down versus all its rivals as the dollar index is under massive selling pressure. The index could approach and reach the nxt downside target from the 91.91 static support, we’ll see how will react after will hit this level.
The 91.91 level represents a crucial support, a valid breakdown will confirm a medium term drop and a USD’s massive depreciation versus all its rivals. The Japanese Yen rallied on the mixed economic data, the Household Spending dropped by 0.2% in the previous month, even if the economists have expected to see a 0.8% growth. Moreover the Unemployment Rate remains steady at 2.8% for the second month in July, matching expectations.
The price should drop further after the retest of the minor red uptrend line, the next downside target will be at the 108.13 horizontal support. Technically is expected to drop much deeper after the failure to stabilize above the second warning line (wl2) of the descending pitchfork. You can see that has retested the wl2, signaling a further decrease. The next major downside target will be at the first warning line (wl1), will approach it only if the Nikkei stock index will slide further.
Trade Idea : GBP/USD – Buy at 1.2920
GBP/USD - 1.2963
Most recent candlesticks pattern : N/A
Trend : Near term up
Tenkan-Sen level : 1.2946
Kijun-Sen level : 1.2924
Ichimoku cloud top : 1.2880
Ichimoku cloud bottom : 1.2857
Original strategy :
Buy at 1.2850, Target: 1.2950, Stop: 1.2815
Position : -
Target : -
Stop : -
New strategy :
Buy at 1.2920, Target: 1.3020, Stop: 1.2885
Position : -
Target : -
Stop : -
As cable has surged again after finding renewed buying interest at 1.2873 yesterday, adding credence to our view that a temporary low has been formed at 1.2774 last week and bullishness remains for the rise from there to bring retracement of recent decline, hence further gain to 1.3000 and later towards previous resistance at 1.3032 would be seen, however, near term overbought condition should limit upside and reckon 1.3075-80 would hold from here.
In view of this, we are looking to buy sterling on pullback as 1.2920-25 should limit downside. Below 1.2895-00 would defer and risk test of said support at 1.2873 but only break there would signal first leg of upmove from 1.2774 has ended, risk weakness to 1.2840-50 but support at 1.2813 should remain intact, bring another rebound later.
Dollar Under Pressure After North Korean Missile Test, Euro Breaks 1.20
The dollar and risk assets were retreating during Tuesday’s Asian session after a new ballistic missile test by North Korea. The novel feature of the latest missile test by North Korea compared to previous tests was that it flew over the Northern Japanese island of Hokkaido before landing in the Pacific Ocean, which seems to be a first. This caused grave concern in Japan.
Despite the fact that Japan was the country that the missile had overflown, the yen gained against both the dollar as well as the euro, although the euro managed to regain some ground as the session progressed. Dollar/yen was last at 108.83 after having spiked as low as 108.31; a 4 ½ -month low. Euro/yen fell well below the key 130 level to 129.62 before recovering to just below 130.60.
In the session’s key economic releases, household spending numbers out of Japan for July disappointed as they came in well below expectations. Spending year-on-year contracted by 0.2% from a 0.7% expansion forecast by economists. Labor market indicators met expectations with jobs/applications for July coming in at 1.52 and the unemployment rate holding at a low 2.8%. The Bank of Japan’s core year-on-year inflation measure rose to 0.4% from 0.3% the previous month.
In other forex developments, the euro took advantage of the dollar’s weakness to break through the 1.20 level, which was its highest level since December of 2014. The dollar has been plagued not only by doubts whether the Fed will carry through with a third rate hike this year but by worries that the US is also heading towards a government shutdown at the end of September due to disagreements between the President and Congress over fiscal policy. The dollar index also plunged to fresh lows by falling below the 92 level to as low as 91.77; a level also not seen since December of 2014. In German economic news, the GfK German Consumer Climate rose to 10.9 compared to 10.8 the previous month, countering worries that the strong euro was hurting the Eurozone economy.
In the UK, the Nationwide House Price Index showed a drop of 0.1% during August versus analyst expectations of a gain of 0.1%. Euro/pound continued its march higher to make a high of 0.9285.
Gold was another beneficiary of North Korea’s actions and the dollar’s weakness, as it challenged its post-US election high by rising to $1324.52 an ounce. Gold’s attributes as a safe haven and as an anti-dollar asset have made it a favorite with investors lately.
Stocks and other risk assets reacted negatively to the North Korean missile test but investors were cautious of making too much out of this recent development as tensions regarding North Korea in the recent past quickly fizzled out and proved to be a buying opportunity in the end. Still, geopolitical uncertainty in that area of the world continues to be brewing despite investor complacency.
Looking ahead to the remainder of the day, the main focus will be on the Conference Board measure of Consumer Confidence in the United States as well as a speech by Chicago Fed President Charles Evans a little later on.