
Sample Category Title
EUR/GBP Daily Outlook
Daily Pivots: (S1) 0.9238; (P) 0.9252; (R1) 0.9276; More
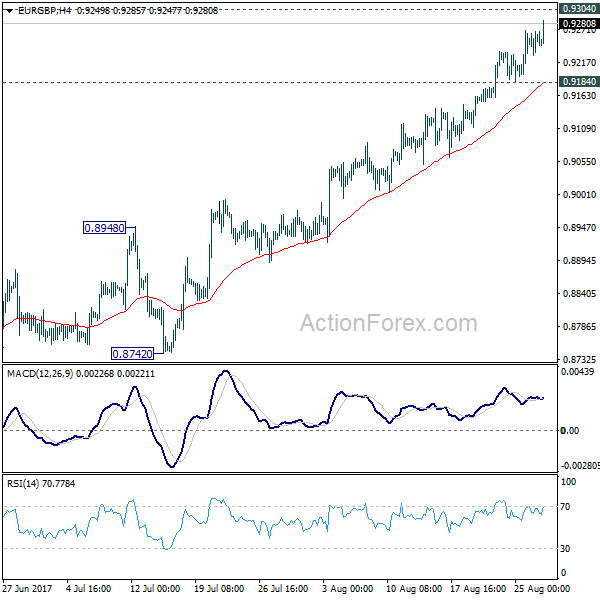
EUR/GBP's rally is still in progress and intraday bias stays on the upside for 0.9304 key resistance. We'd remain cautious on rejection from 0.9304 to extend the medium term consolidation pattern. Break of 0.9184 will turn bias back to the downside for pull back to 55 day EMA (now at 0.8959). However, sustained break of 0.9304 will confirm up trend resumption and pave the way to 0.9799.
In the bigger picture, price actions from 0.9304 are viewed as a medium term corrective pattern. It's uncertain whether it is finished yet. But in case of another fall, we'd expect strong support from 0.8116 cluster support (50% retracement of 0.6935 to 0.9304 at 0.8120) to contain downside and bring rebound. Whole up trend from 0.6935 is expected to resume after consolidation from 0.9304 completes. Firm break of 0.9799 high will target 61.8% projection of 0.5680 to 0.9799 from 0.6935 at 1.1054.
EUR/AUD Daily Outlook
Daily Pivots: (S1) 1.5003; (P) 1.5034; (R1) 1.5069; More...
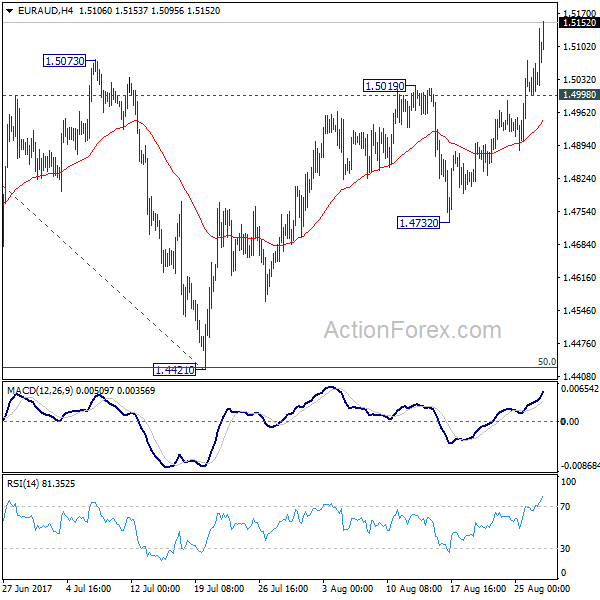
EUR/AUD's rally continues today and reaches as high as 1.5151 so far. The break of 1.5073 resistance affirmed our bullish view that correction from 1.5226 has completed with three waves down to 1.4421. Intraday bias stays on the upside for retesting 1.5226 first. Break there will resume whole rebound from 1.3624 and target 61.8% projection of 1.3624 to 1.5226 from 1.4421 at 1.5411 next. On the downside, below 1.4998 minor support will turn intraday bias neutral first.
In the bigger picture, we're holding on to the view that corrective decline from 1.6587 medium term has completed at 1.3624. Rise from 1.3624 is expected to extend to retest 1.6587. The corrective structure of the fall from 1.5226 is affirming this view. Above 1.5226 will target a test on 1.6587 key resistance. However, break of 1.4421 will dampen our view and would drag EUR/AUD lower to retest key support zone around 1.3624.
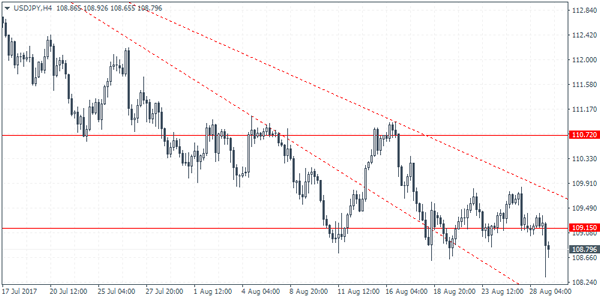
USDJPY Intraday Analysis
USDJPY (108.79): The USDJPY slipped past 109.15 support earlier today. The declines came on the news report of the North Korea's missile launch. The price fell to lows of 108.32 before pulling back. The breakdown below 109.15 could, however, suggest further declines in USDJPY. A retest of 109.15 as resistance could confirm this move as the next support near 108.00 could be inevitably tested. However, the fact that USDJPY has been strongly consolidating near 109.15 - 108.20 levels could suggest a near-term bottoming pattern being formed.
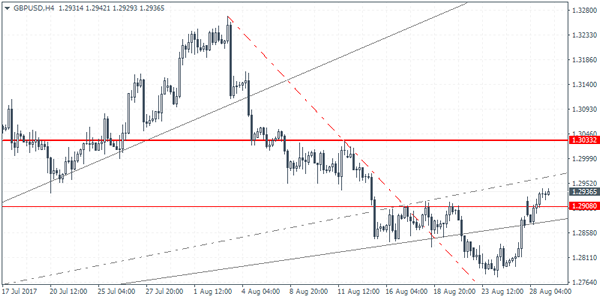
GBPUSD Intraday Analysis
GBPUSD (1.2936): The British pound was seen posting gains for a second consecutive day. Price action gapped higher on yesterday's open but briefly pulled back to test Friday's close. Further upside is expected in the cable which could now be heading towards the resistance level of 1.3033. With the resistance level of 1.2908 being cleared, any pullback is likely to be limited at this level. A retest of support at 1.2908 will confirm the upside towards 1.3033 level. However, in the event that the support at 1.2908 fails to contain prices we could expect to see some near-term downside.
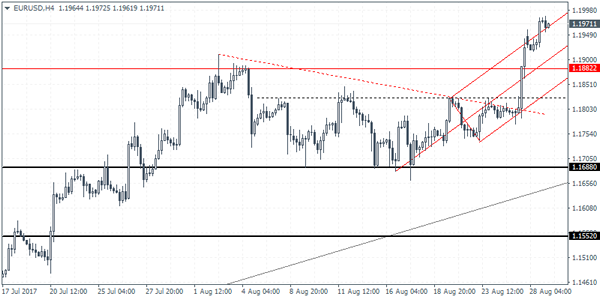
EURUSD Intraday Analysis
EURUSD (1.1971): The euro broke fresh highs yesterday as prices closed at 1.1977. The rebound came after a modest retracement, but price action turned bullish quite quickly. EURUSD looks to be all set to test the $1.2000 handle in the near term. However, the risk of a short term decline could see the common currency testing the support level at 1.1882 and 1.1824 levels. The bias in the EURUSD remains strongly supported to the upside until the gap around 1.2000 will be filled. This is likely to mark the end of the bullish rally in the euro before we can expect to see some kind of a pullback in prices.
British Pound Extends Losses As GDP Rises 1.7% On The Year
The UK's Office for National Statistics released the second revised estimate for the UK's GDP last week. According to the official data, the economic activity in the UK rose 0.3% in the quarter ending June.
This was broadly in line with the median estimates which expected to see an unchanged print from the first estimates. On a year over year basis, the UK's GDP was seen rising at an annual rate of 1.7% in the June quarter.
The ONS also said that the services sector managed to contribute to the GDP while the manufacturing and construction sectors posted a drag. Household spending was also seen weakening, rising just 0.1%. This was said to be the worst performance in consumer spending since the fourth quarter of 2014.
In the previous quarter, consumer spending was seen at 0.4%. Head of ONS GDP, Darren Morgan said that the weak exchange rate and inflation was hitting the household budgets.
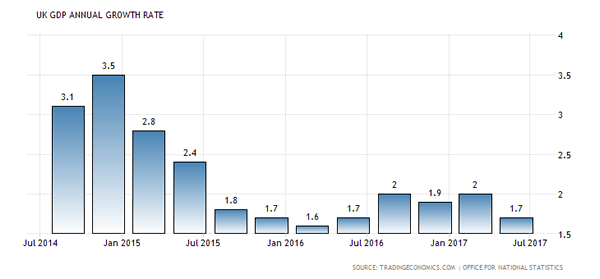
UK Annual GDP Growth Rate: 1.7%, Q2 2017. Source: Tradingeconomics.com
Government spending managed to offset some of the declines from the private consumption. Investments were however seen driven by largely on account of government spending and housing construction. Business investment remained flat for the month. Economists were expecting to see a 0.2% increase.
The UK's economy is expected to continue in this trend for the remainder of the year. Projections show that the UK's economy might average a 1.7% GDP annual growth rate this year. But they forecast that GDP could slow to as much as 1.5% in the next year.
The GDP growth rate also puts the UK as the slowest growing economy among the G7 economies. This was broadly attributed to the decision by the UK to leave the EU. The Brexit referendum was seen hitting business investment strongly and stalling any further plans.
Many financial institutions are also looking at ways to move into the European Union. The UK government is hopeful that it will complete the Brexit negotiations by March 2019.
Currently, preparations are underway by UK officials on how they wish to exit the EU. Key points of debate include retaining access to the single market and immigration.
UK retail sales posts fastest decline in a year
Last week, the Confederation of British Industry (CBI) released the retail sales report survey. According to the report, retail sales in the UK fell at the fastest pace in August. Data showed that 44% of retailers reported weaker sales volumes in August compared to the same month the year before. Anna Leach from CBI said that despite the warm weather, retail sales slowed. This was broadly attributed to the stronger inflation which has continued to put a squeeze on UK households.
Wages have remained broadly flat while inflation has overshot the BoE's 2% inflation target rate, rising to 2.6% last month. Some of the retailers in the survey remained optimistic however noting that they expect retail sales to pick up in September.
Data released a few weeks ago showed that retail sales in July managed to rise 0.3% on the month. This was slightly higher than the forecasts of a 0.2% increase. June’s retail sales figures were also revised down to show a 0.3% monthly increase.
On a year over year basis, retail sales in the UK rose just 1.7%. This was significantly lower from the revised 2.8% increase that was registered in the previous month. Excluding gasoline, retail sales rose 1.5% on the year, which managed to beat the forecasts but was still down from the previous month.
The British pound was seen weakening. The currency had briefly rallied to $1.325 levels in July. The gains came broadly on account of hawkish commentary from the Bank of England back then.
Yen Strengthens On North Korea Missile Launch
The US dollar was seen weakening once again on Monday. The dollar fell against the euro as investors bid up the common currency following Draghi's comments on Friday at the Jackson Hole symposium. Economic data was largely quiet yesterday.
Reports emerged earlier today that North Korea tested a missile which flew over Japan and landed in the sea. Investors rushed to the safe haven of the Japanese yen and gold which was seen strengthening as a result. Further reaction could be expected later in the day as the markets unfold.
Looking ahead on the economic front, the economic calendar today will include the French GDP numbers for the second quarter. No changes are expected as the second quarter GDP is expected to remain steady at 0.5%. In the US the conference board's consumer confidence data is also expected to come out.
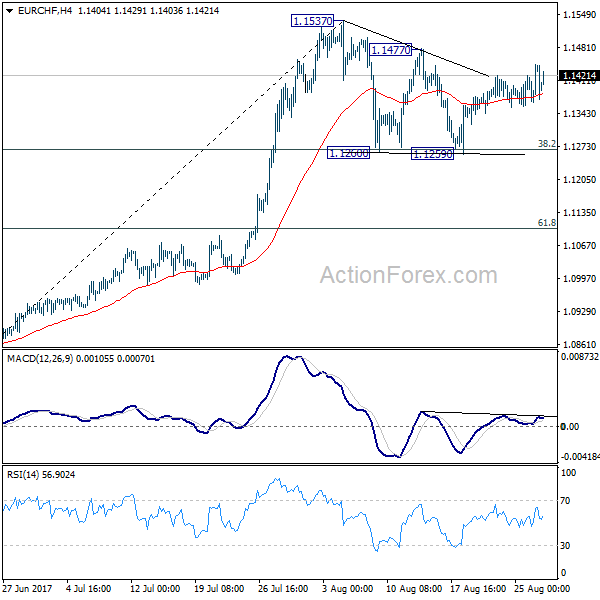
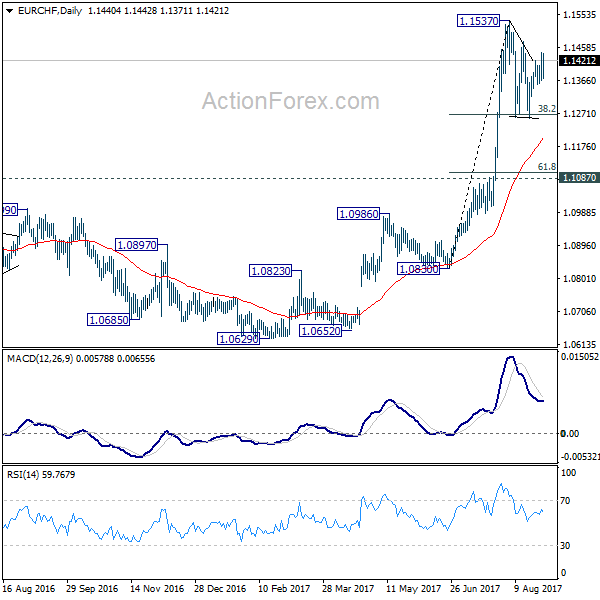
EUR/CHF Daily Outlook
Daily Pivots: (S1) 1.1390; (P) 1.1418; (R1) 1.1469; More...
EUR/CHF is still staying in the consolidation pattern from 1.1537 and intraday bias remains neutral first. On the upside, break of 1.1477 resistance will argue that the consolidation from 1.1537 has completed and larger rise is resuming. Further break of 1.1537 will confirm and target 1.2 key resistance level next. On the downside, however, firm break of 38.2% retracement of 1.0830 to 1.1537 at 1.1267 will extend the correction to 61.8% retracement at 1.1100 before completion.
In the bigger picture, firm break of 1.1198 key resistance confirms resumption of the long term rise from SNB spike low back in 2015. In this case, EUR/CHF would eventually head back to prior SNB imposed floor at 1.2000. For now, this will be the favored case as long as 1.1087 resistance turned support holds.
Currencies: No Safe Haven Bid For The Dollar
Sunrise Market Commentary
- Rates: Geopolitical tensions boost US Treasuries, but for how long?
Risk aversion reigns cross markets overnight following the latest North Korean missile launch. The US Note future tests the contract high overnight. Geopolitical trading themes generally don't last very long. Some investors probably decide to hold a neutral view ahead of key US eco releases and a rumoured speech by US President Trump on his fiscal stimulus plans. - Currencies: no safe haven bid for the dollar
Yesterday, EUR/USD extented the post-Jackson hole gains and neared 1.20. Overnight, markets shifted in risk-off modus as a missile launch of North Korea triggers harsh verbal protest. This is a negative rather than a positive for the dollar. UK-EMU Brexit talks are still in a stalemate preventing a sterling rebound for now.
The Sunrise Headlines
- US equities ended nearly unchanged yesterday with Nasdaq slightly outperforming (+0.26%). Risk aversion reigns overnight following the latest North Korean rocket launch. Main Asian indices lose around 0.5%.
- North Korea has launched a ballistic missile that overflew Japan, undermining protracted US efforts to bring it to the negotiating table with an aggressive step it has not taken in almost 20 years.
- Saudi Arabia and Russia are pushing to extend their deal to limit crude oil production for another three months, which would leave the (non-)OPEC output deal in place through the end of June 2018, people familiar with the matter said.
- The EU's chief Brexit negotiator Barnier accused the UK of not "negotiating seriously" over its withdrawal and called on May's government to remove ambiguity about its stance.
- Romania, one of the fastest growing EU members, may join the euro zone in 2022, once the incomes of its poorest citizens rise, foreign minister Melescanu said.
- Greece must press ahead with implementing its reforms-for-aid programme and become more competitive, German FM Schaeuble was quoted as saying, adding that debt relief for Athens was "currently" not on the agenda.
- Today's eco calendar remains rather thin with only US consumer confidence and S&P housing prices.
Currencies: No Safe Haven Bid For The Dollar
EUR/USD nears 1.20 mark
On Monday, EUR/USD and USD/JPY initially held extremely tight ranges after Friday's ‘Jackson Hole decline of the dollar'. The lack of a correction on Friday's EUR/USD break higher convinced euro bulls of more upside. EUR/USD came within reach of the 1.20 barrier and closed the session at 1.1969. The decline of USD/JPY was more modest as equities performed rather well. The pair closed the session little changed at 109.25.
Overnight, markets shifted into risk-off modus as North Korea fired a missile that few over the north of Japan. The missile provoked a sharp verbal reaction from South Korea, Japan and the US. Japanese premier Abe and US president Trump extensively discussed the issue and agreed to raise the pressure on North Korea. South Korean stocks (-0.4%) and the won are underperforming. The yen plays its safe haven role with USD/JPY trading in the 108.80 area. The losses on Asian equity markets remain modest. The rise of tensions in Asia has little impact on EUR/USD. The pair trades in the 1.1975 area, holding within reach of the MT top.
The EMU calendar contains only French July consumer spending and the final Q2 GDP. No market impact is expected. US consumer confidence is expected to have declined slightly in August, (120.7 from 121.1). Other measures of consumer confidence (Michigan, Bloomberg) improved in August. The expected decline would be no reason of concern and we even don't exclude a rise in confidence instead of a decline. Strong consumer confidence might be lightly USD supportive. However, investors will give more weight to more important data later this week. The N-Korea inspired risk-off sentiment is a wildcard for FX trading. In the recent past, the impact of political event risk on global markets was limited and short-lived. The political rhetoric sounds a bit more harsh this time. That said, geopolitical tensions are currently not supportive for the dollar. Its safe haven appeal is rather low. The dollar needs in the first place data that are strong enough to raise rate hike expectations. This won't occur today. So some consolidation in USD/JPY is likely. A test of EUR/USD 1.20 is becoming ever more likely. Or will a risk-off topping out process in EUR/JPY help to stop the rise in EUR/USD?
Broader context and technical picture. Late June, EUR/USD started a new up-leg as investors anticipated a reduction of ECB bond buying. The Fed was expected to normalize policy only in a very gradual way as US inflation remains soft.
Uncertainty on the policy of the Trump administration was a secondary negative factor for the dollar. EUR/USD set a new correction top north of 1.19 before consolidating in a narrow 1.1662/1.1910 range. The top of this range was broken after Jackson hole. The day-to-day momentum remains euro positive. However, in MT perspective, we assume that the EUR/USD rebound has gone far enough if the recent improvement in US eco situation will be confirmed. A return of EUR/USD to the 1.15/16 area is possible. Pockets of US political risk are a (negative) wildcard for the dollar. We wait for a technical signal.
A downward correction in core (US and European) yields supported the yen in August. USD/JPY declined from mid-114 mid-July to 108.60. The April correction low (108.13) remains the line in the sand. For now, this level won't be easy to break as quite some USD bad news is discounted after the recent protracted setback. A cautious buy-on-dips approach (with stop-loss protection below 108) may be considered.
EUR/USD: ‘by default' euro buying persists. 1.20 within striking distance
EUR/GBP
EUR/GBP holding near the recent top
Yesterday, sterling trading volumes were low as UK markets were closed for the Summer Bank holiday. Cable and EUR/GBP basically maintained the moves after the Jackson hole speeches of Yellen and Draghi on Friday. EUR/GBP held in the mid-0.92 area. EUR/GBP closed the session at 0,9263 on a strong close of the euro. Cable finished the day at 1.2933.
Overnight, the reactions after the start of the third round of the Brexit talks shows that little progress has been made. EU negotiator Barnier repeated that the UK needs to bring clarity on the separation issues. For now, this stalemate in the negotiations has little negative impact on sterling, but UK sterling traders still have to return from a long weekend. The Halifax house prices were slightly softer than expected at -0.1% M/M and 2.1% Y/Y. There are no other UK data, but again plenty of Brexit headlines. For now, they are not sterling supportive. Even so, EUR/GBP already discounts plenty of UK negative news. We look for a signal that the rally slow.
From a technical point of view, EUR/GBP cleared the 0.8854/80 resistance (top end June), opening the way for further gains. The move was the result of euro strength. Simultaneously, UK price data were soft enough to keep the BoE sidelined. MT, we maintain a buy EUR/GBP on dips approach as we expect the combination of relative euro strength and sterling softness to persist. The 0.9415 ‘flash-crash spike' is the next target on the charts. However, we don't jump on the up-trend anymore after the recent rally and wait for a correction, e.g. to the technical support in the 0.88/89 area.
EUR/GBP: holding near recent top on euro strength
Another Wave of Escalation in North Korean Crisis
North Korea this morning fired what was likely an intermediate-range ballistic missile over Japan into the Pacific. After a short period of calm the North Korean crisis is again escalating.
How serious is this? The missile test is clearly a strengthening show of force from North Korea to show they are not bending to US demands. That the missile is flying over Japanese territory is a clear provocation, although not the first time it has happened. As late as 2016 North Korea fired a rocket over Okinawa. At the same time, North Korea did not go through with its' plans to send the missiles close to the waters of Guam as they had indicated on 9 August. Kim Jong Un had said he was reconsidering this and the missiles into the Pacific can to some extend be seen as a moderation compared to the initial plans. Japanese Foreign Minister Taro Kono said the launch to the east rather than to the south towards Guam was a sign Pyongyang 'flinched' in the face of US warnings.
North Korea had warned that the annual military exercises of US and South Korea taking place during these weeks would trigger a reaction. The so-called Ulchi-Freedom Guardian military exercises started earlier this month. It is not unusual that these exercises escalate tensions. Last year North Korea launched a missile from a submarine around the time of the exercises and put its military on high alert. China had asked US and South Korea to suspend the drills this year in order to ease the conflict and pave the way for diplomatic talks.
What's next? Following today's launch Japan has asked the United Nations Security Council to hold an emergency meeting. More sanctions may be imposed but we still see war as a very low probability as the risks involved on both sides are simply too big. Ultimately we believe that we will have talks between the involved parties. But before that both sides will need to illustrate a big show of force to strengthen the positon at the negotiating table. What the response might be from the US side this time is not clear. But a military strike does not seem likely.
A diplomatic solution is difficult as it will require on the one hand that North Korean demands for an end to the annual military exercises are difficult to obtain because US and South Korea sees a big threat from North Korea. Similarly the demand from the US for North Korea backing down from their nuclear ambition is also difficult as long as they see the US as a major threat. Eventually there is only a diplomatic solution to this as a military conflict would entail severe losses on both sides. But the road there will not be easy and we are likely to see continued waves of escalations before the parties are ultimately pushed to the negotiating table.
Market outlook: The markets reacted again with the usual safe haven flows sending equities and bond yields lower. Asian stocks took a hit again as after the recent escalation. But things will likely calm down again soon and markets recover. Overall, though, the crisis is keeping risk appetite dented as long as we see these continued waves of escalation. In combination with the looming US debt limit deadline coming closer risk markets will find it hard to gain real momentum despite overall positive growth numbers at the moment.
Below are an outline of recent events:
29 August:
North Korea fires missile over Japan into the Pacific
16 August:
Trump praises Kim Jong Un for 'wise' decision on Guam
15 August:
Kim Jong Un said he would watch the actions of the US for a while longer before making a decision to strike the area around Guam with missiles.
14 August:
South Korean President Moon Jae-In said Seoul would avoid a second Korean War at all costs and that "Military action on the Korean Peninsula can only be decided by the Republic of Korea and no one may decide to take military action without the consent of the Republic of Korea". US Defence secretary James Mattis said if North Korean missiles were considered to threaten Guam "then it's game on"
11 August:
Trump tweets that "Military solutions are now fully in place, locked and loaded, should North Korea act unwisely. Hopefully Kim Jong Un will find another path!"
9 August:
North Korea army says it plans to launch missiles to hit close to the American island Guam in mid-August. Rex Tillerson says he sees no "imminent threat" of North Korea attack. "Americans should sleep well at night".
8 August:
US intelligence officials concludes that North Korea has successfully produced a miniaturized nuclear warhead that can fit inside its missiles. If true it would mean that North Korea could already have reached their aim of having capability of reaching the US with a nuclear warhead as Intercontinental Ballistic Missiles (ICBM) tested twice in July would have been able to reach US if fired at a lower angle. Trump says that US would respond with "fire and fury like the world has never seen" if North Korea persisted threatening US. The statement was apparently improvised and said to surprise his aides.
5 August:
UN take unanimous decision to launch new sanctions on North Korea. Among other things it introduces a full ban on coal, iron and iron ore to banned commodities for import. Estimates say it may cost up to USD1bn per year for North Korea.
1 August:
US Secretary of State Rex Tillerson says US is willing to talk to North Korea saying North Korea is not the enemy of the US and that US does not seek regime change. The precondition for talks, though, is that North Korea backs down from their nuclear pursuit. North Korea denies to back down and demands that US and South Korea stops annual military exercises (expected to kick off later this month). The US reject this request. Tillerson has generally been the calm and responsible voice on the North Korean issue.