Sample Category Title
AUD/USD Daily Outlook
Daily Pivots: (S1) 0.7930; (P) 0.7952; (R1) 0.7983; More...
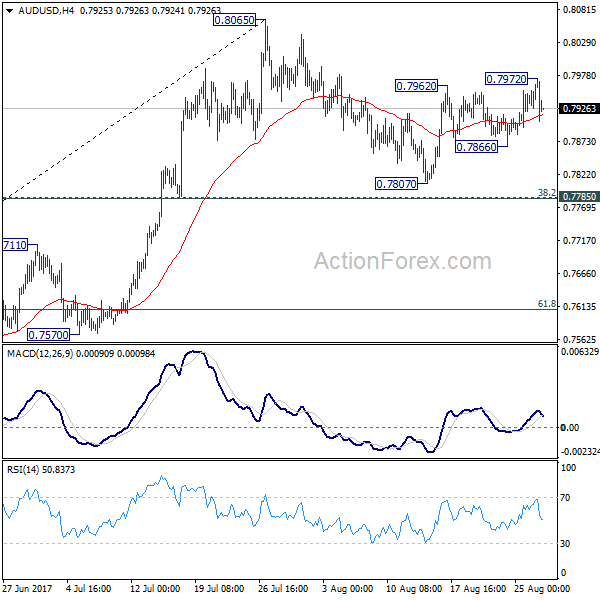
Despite edging higher to 0.7972, AUD/USD quickly retreated back to familiar range. Intraday bias stays neutral first. Correction from 0.8065 might extend and another fall cannot be ruled out. But downside should be contained by 0.7785 cluster support (38.2% retracement of 0.7328 to 0.8065 at 0.7783) to bring rebound. Above 0.7972 will target a test on 0.8065 resistance first. Firm break of 0.8065 will resume the medium term rise and target 100% projection of 0.6826 to 0.7833 from 0.7328 at 0.8335.
In the bigger picture, rise from 0.6826 medium term bottom is still in progress. At this point, there is no confirmation of trend reversal yet and we'll continue to treat such rebound as a corrective pattern. But in any case, break of 55 month EMA (now at 0.8097) will target 38.2% retracement of 1.1079 to 0.6826 at 0.8451. Break of 0.7328 support is needed to confirm completion of the rebound. Otherwise, further rise is now in favor.
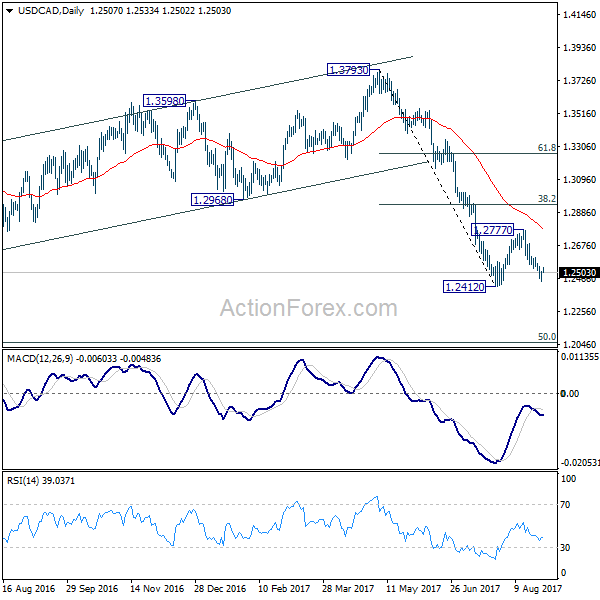
USD/CAD Daily Outlook
Daily Pivots: (S1) 1.2463; (P) 1.2486; (R1) 1.2530; More....
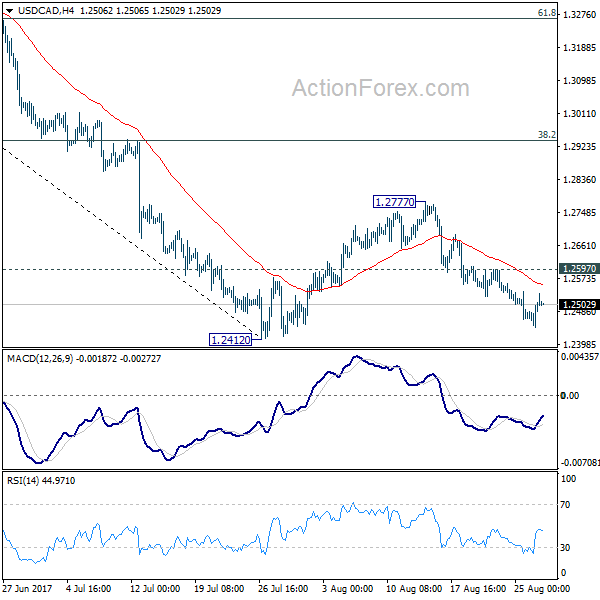
USD/CAD recovers ahead of 1.2412 low and intraday bias is turned neutral first. On the downside, break of 1.2412 will resume recent fall from 1.3793 and target next long term fibonacci level at 1.2048. On the upside, above 1.2597 minor resistance will extend the consolidation from 1.2412 with another rise. But we'd expect upside to be limited by 38.2% retracement of 1.3793 to 1.2412 at 1.2940 to bring fall resumption eventually.
In the bigger picture, price actions from 1.4689 medium term top are seen as a correction pattern. Such corrective fall is still expected to extend to 50% retracement of 0.9406 to 1.4869 at 1.2048. At this point, we'd look for strong support from there to contain downside and bring rebound. Nonetheless, on the upside, sustained break of 1.2968, 38.2% retracement of 1.3793 to 1.2412 at 1.2940 will be the first sign of completion of the correction and will turn focus back to 1.3793 key resistance.
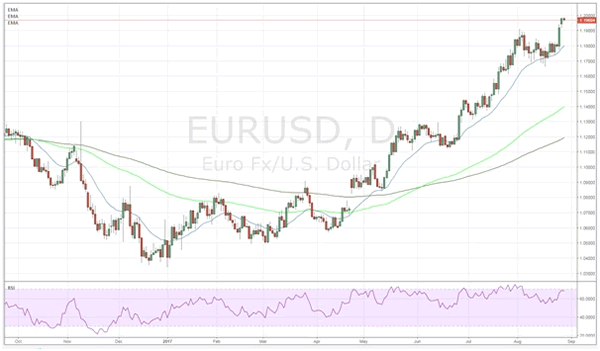
Will The Euro Continue To Rally?
Key Points:
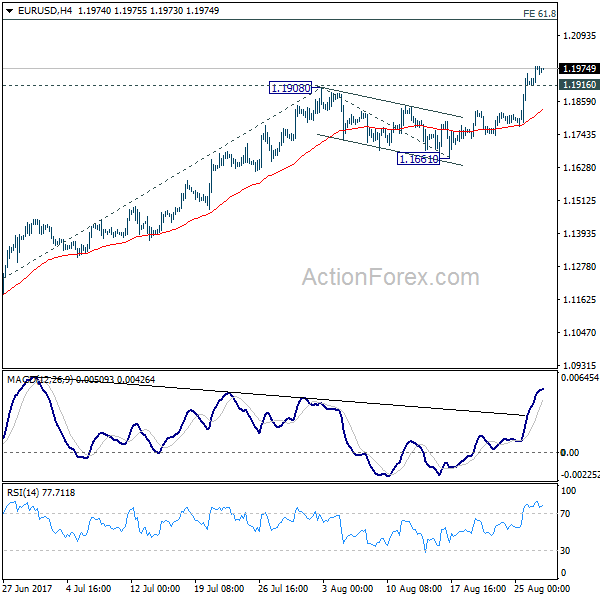
- Price action creeps towards the key 1.20 level.
- RSI Oscillator nearing overbought levels.
- Watch for a period of moderation before a break of 1.20 leads to rapid appreciation.
The Euro has continued to creep higher over the past few weeks as the currency pair has moved to form a new high for 2017. Much of the upward pressure has been to do with a weakening U.S. economy which has spurred capital flows away from the greenback and this has brought with it some robust conditions for the Euro Dollar. However, it remains to be seen if the pair can assail the psychological 1.20 handle, which is acting as some natural resistance, in the coming days.
Presently, the fundamental fear factor around North Korea has been driving capital flows away from the greenback and into safe haven's such as Gold. In addition, the rogue state's recent missile launch over Japan has increased the mounting risk of conflict and this is acting as an additional support for the Euro, amongst other currencies. Additionally, the U.S. Trade Deficit (GOODS) also widened overnight to -65.1B which has had a flow on effect for the USD and adds to the Euro's buoyancy.
However, technical factors for the Euro Dollar are likely to rule the roost in the coming days with the RSI Oscillator nearing overbought levels whilst price action reaches towards the mythical 1.20 resistance level. Subsequently, there is some evidence that a pause is what is needed for the currency pair in the short term. A short period of consolidation would relieve some of the building pressure and allow the Euro to prepare for an assault on the 1.20 level.
At this stage, it's only a matter of time before price action breaches the 1.20 resistance level and when this occurs it could lead to a significant increase for the pair. In fact, the consensus view appears to be that price action could rapidly move towards the 1.22 handle or higher over the next month. Much of this is based on speculation that the ECB will start to wind back its bond buying program in September and this would bring with it sharp gains for the pair. Additionally, the 5-year average for the Euro Dollar sits around the 1.21 mark so gains above this level are not totally unrealistic.
Ultimately, the short term outlook argues for some moderation for the pair whereas the Medium term view is one of strong bullishness. Subsequently, the pair would bear watching over the next few days because when it eventually breaks through resistance at 1.20 the rise will be relatively rapid indeed.
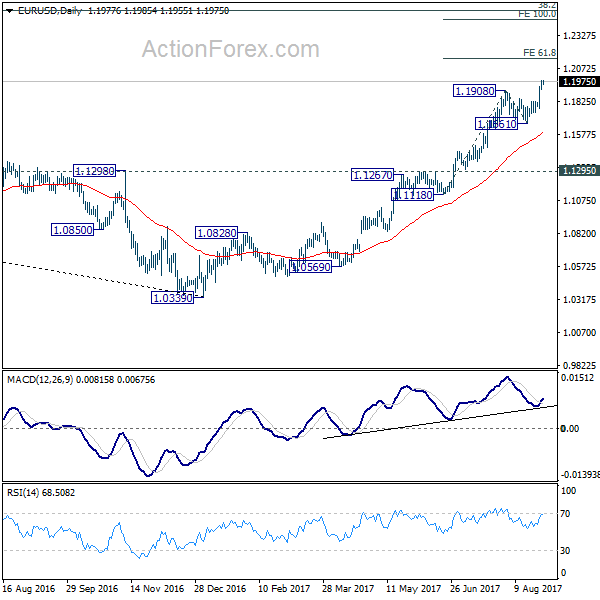
EUR/USD Daily Outlook
Daily Pivots: (S1) 1.1935; (P) 1.1959 (R1) 1.2002; More...
Intraday bias in EUR/USD remains on the upside as recent rally continues. Rise from 1.0339 should target 61.8% projection of 1.1118 to 1.1908 from 1.1661 at 1.2149 first. Break there will target 100% projection at 1.2451 next. On the downside, below 1.1916 minor support will turn intraday bias neutral first. But retreat should be contained above 1.1661 support and bring rise resumption.
In the bigger picture, an important bottom was formed at 1.0339 on bullish convergence condition in weekly MACD. Sustained trading above 55 month EMA (now at 1.1768) will pave the way to key fibonacci level at 38.2% retracement of 1.6039 (2008 high) to 1.0339 (2017 low) at 1.2516. While rise from 1.0339 is strong, there is no confirmation that it's developing into a long term up trend yet. Hence, we'll be cautious on strong resistance from 1.2516 to limit upside. For now, medium term outlook will remain bullish as long as 1.1295 support holds, in case of pull back.
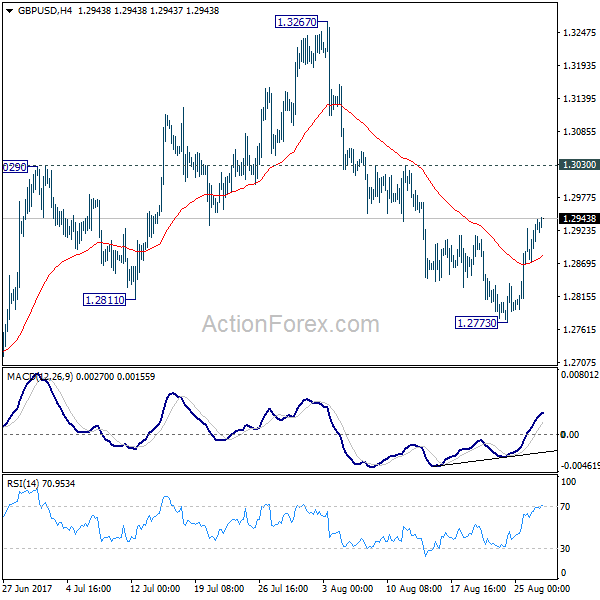
GBP/USD Daily Outlook
Daily Pivots: (S1) 1.2889; (P) 1.2915; (R1) 1.2959; More...
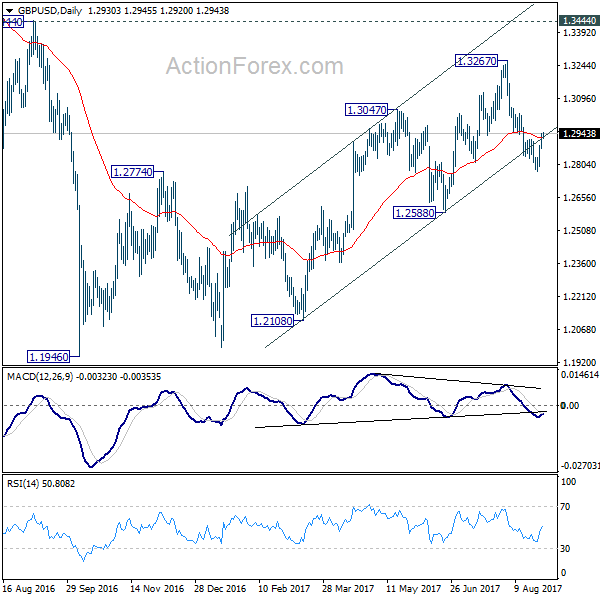
GBP/USD's recovery from 1.2773 is still in progress but it's limited well below 1.3030 resistance. Intraday bias stays neutral for the moment and outlook remains mildly bearish. We're favoring the case that correction from 1.1946 is completed at 1.3267. Below 1.2773 will target 1.2588 key near term support first. Decisive break of 1.2588 will confirm our view and target a test on 1.1946 low. Though, break of 1.3030 will dampen this bearish view and turn bias back to the upside for retesting 1.3267.
In the bigger picture, overall, price actions from 1.1946 medium term low are seen as a corrective pattern. While further rise cannot be ruled out, larger outlook remains bearish as long as 1.3444 key resistance holds. Down trend from 1.7190 (2014 high) is expected to resume later after the correction completes. And break of 1.2588 will indicate that such down trend is resuming.
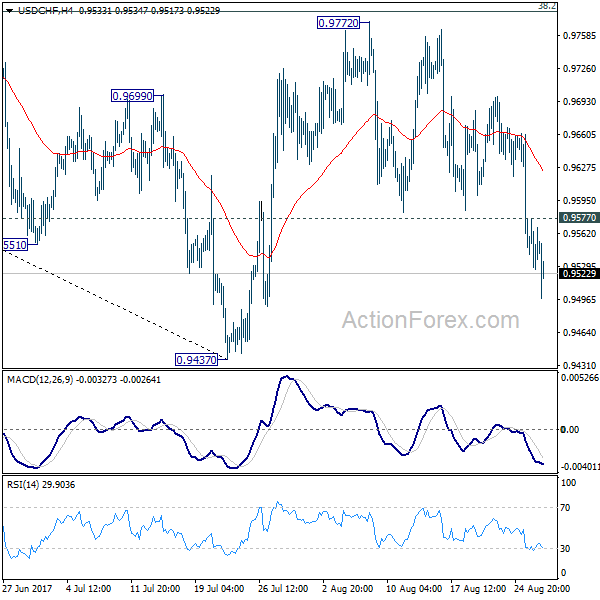
USD/CHF Daily Outlook
Daily Pivots: (S1) 0.9526; (P) 0.9552; (R1) 0.9577; More....
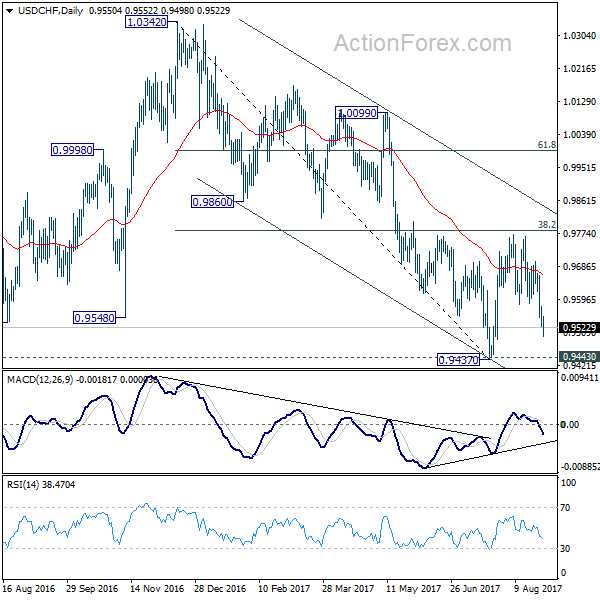
USD/CHF's fall extends to as low as 0.9490 so far. Intraday bias remains on the downside for retesting 0.9437 low. Note again that the pair is bounded in medium falling channel and limited below 38.2% retracement of 1.0342 to 0.9437 at 0.9783. Break of 0.9427 will extend the whole decline from 1.0342 and carries larger bearish implications. On the upside, above 0.9577 minor resistance will turn intraday bias neutral first.
In the bigger picture, we're slightly favoring the case that USD/CHF has successfully defended 0.9443 key support level. And long term range trading in 0.9443/1.0342 is extending with another rise. At this point, there is no sign of an up trend yet. Hence, while further rise is expected in USD/CHF, we'll start to be cautious on loss of momentum above 61.8% retracement of 1.0342 to 0.9437 at 0.9996. However, firm break of 0.9443 will carry larger bearish implication and would target next key support at 0.9072.
USD/JPY Daily Outlook
Daily Pivots: (S1) 109.04; (P) 109.23; (R1) 109.43; More...
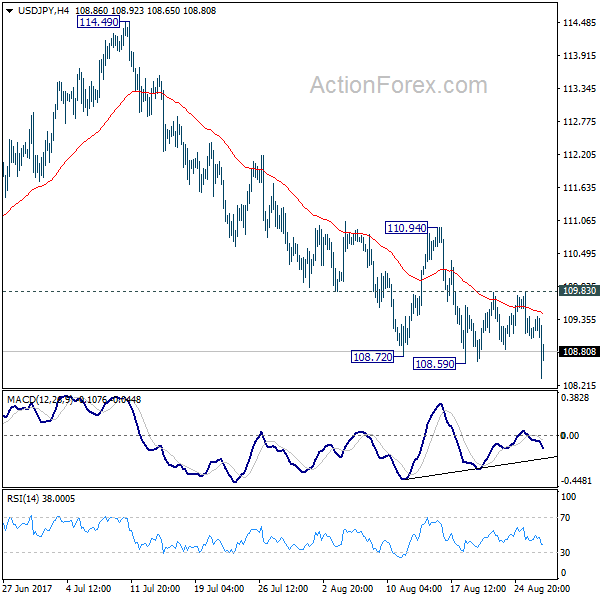
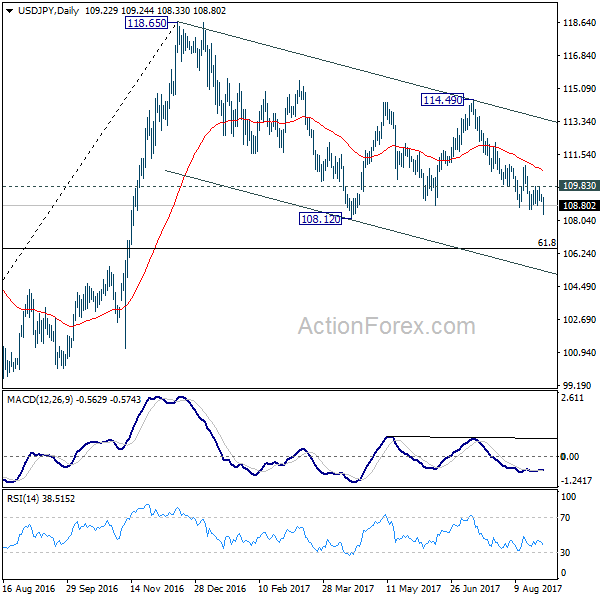
USD/JPY's decline resumed by taking out 108.59 and reaches as low as 108.33 so far. Intraday bias is back on the downside for 108.12 low. Whole corrective decline from 118.65 is possibly resuming and break of 108.12 will target 61.8% retracement of 98.97 to 118.65 at 106.48. Nonetheless, considering bullish convergence condition in 4 hour MACD, break of 109.83 will indicate short term bottoming and turn bias back to the upside for 110.94 resistance and above.
In the bigger picture, the corrective structure of the fall from 118.65 suggests that rise from 98.97 is not completed yet. Break of 118.65 will target a test on 125.85 high. At this point, it's uncertain whether rise from 98.97 is resuming the long term up trend from 75.56, or it's a leg in the consolidation from 125.85. Hence, we'll be cautious on topping as it approaches 125.85. If fall from 118.65 extends lower, downside should be contained by 61.8% retracement of 98.97 to 118.65 at 106.48 and bring rebound.
Yen Surges as North Korea Fired Missile Over Japan
Yen surges broadly, together with Swiss Franc, on risk aversion as tension in the Koreas escalates again. North Korea fired a missile earlier today that flew over Japan and landed in the Pacific Ocean. South Korea military official said that the missile was fired around 5:57 a.m. local time, flew for about 2700 km and reached a maximum altitude of 550 km. US Pacific Command projected that the missile splashed down at around 6:29 a.m. local time. The news sent Yen higher as investors there repatriates their overseas investments on fear of market and exchange rate volatility. USD/JPY dives through 108.59 support to as low as 108.33 and recent selloff resumes. Commodity currencies are hit hardest while Euro is mixed. The news also sent gold sharply higher to 1330 after it takes out of 1300 handle firmly yesterday.
Japan PM Abe: Unprecedented, serious and significant threat
In Japan, public television programs were interrupted with warnings regarding the threat to the country. Several bullet train lines were halted. Similar scale of provocative act was not seen since after 2009. And, it's only the third projectile the fly over Japan since 1998. Japan Prime Minister Shinzo Abe condemned that "this reckless act of firing a missile over our nation is an unprecedented, serious and significant threat, one that seriously diminishes the peace and safety of the region, and as a result we have lodged a firm protest against North Korea." Abe also requests an emergency meeting of UN Security Council to see to "further strengthen pressure against North Korea."
US President Trump warned of pulling out from NAFTA
In the US, President Donald Trump stepped up his rhetorics on the relationships with Canada and Mexico. Trump tweeted that "we are in the NAFTA (worst trade deal ever made) renegotiation process with Mexico & Canada". And he told reporters that "I believe that you will probably have to at least start the termination process before a fair deal can be arrived at. In our opinion, the core of NAFTA renegotiation is to narrow US' trade deficit. With US' trade deficit with Canada on the fall, it would put harder pressure on Mexico in the negotiations.
The market reaction towards NAFTA renegotiation has been muted, overshadowed by other events including North Korean peninsula tensions, US debt ceiling, and central banks' monetary policy outlook. Indeed, we do not expect to see material developments for the rest of the year. However, the parties, especially the US and Mexico, would be eager to complete a deal by mid-2018, ahead of and Mexican election in July and US mid-term election in November." More in Second Round of NAFTA Renegotiation to Begin...
EU Barnier urged UK to start "negotiating seriously"
As the third round of Brexit negotiation starts, EU's chief negotiator Michel Barnier urged UK to start Michel Barnier urged the UK to start "negotiating seriously" as "to be honest, I am concerned. Time passes quickly." He welcomed the papers published by the UK government's papers published before the meeting. But Barnier emphasized that "we need UK positions on all separation issues" to make "sufficient progress". He added that "we need UK papers that are clear in order to have constructive negotiations and the sooner we remove the ambiguity, the sooner we will be in a position to discuss the future relationship and the transitional period."
On the other hand, UK's Brexit Secretary David Davis urged "flexibility and imagination on both sides". He reiterated that "our goal remains the same: we want to agree a deal that works in the best interests for both the European Union and the United Kingdom and people and businesses right across Europe. We're ready to roll up our sleeves and get back to work once more." Davis also depended UK's papers as "product of "hard work and detailed thinking that has been going on behind the scenes"
On the data front
Japan unemployment rate was unchanged at 2.8% in July, household spending dropped -0.2% yoy. UK nationwide house price, German Gfk consumer confidence and French GDP will be featured in European session. Canada IPPI and RMPI, US S&P Case-Shiller house price and consumer confidence will be released later in the day.
USD/JPY Daily Outlook
Daily Pivots: (S1) 109.04; (P) 109.23; (R1) 109.43; More...
USD/JPY's decline resumed by taking out 108.59 and reaches as low as 108.33 so far. Intraday bias is back on the downside for 108.12 low. Whole corrective decline from 118.65 is possibly resuming and break of 108.12 will target 61.8% retracement of 98.97 to 118.65 at 106.48. Nonetheless, considering bullish convergence condition in 4 hour MACD, break of 109.83 will indicate short term bottoming and turn bias back to the upside for 110.94 resistance and above.
In the bigger picture, the corrective structure of the fall from 118.65 suggests that rise from 98.97 is not completed yet. Break of 118.65 will target a test on 125.85 high. At this point, it's uncertain whether rise from 98.97 is resuming the long term up trend from 75.56, or it's a leg in the consolidation from 125.85. Hence, we'll be cautious on topping as it approaches 125.85. If fall from 118.65 extends lower, downside should be contained by 61.8% retracement of 98.97 to 118.65 at 106.48 and bring rebound.
Economic Indicators Update
| GMT | Ccy | Events | Actual | Forecast | Previous | Revised |
|---|---|---|---|---|---|---|
| 23:30 | JPY | Unemployment Rate Jul | 2.80% | 2.80% | 2.80% | |
| 23:30 | JPY | Household Spending Y/Y Jul | -0.20% | 0.70% | 2.30% | |
| 6:00 | GBP | Nationwide House Prices M/M Aug | 0.00% | 0.30% | ||
| 6:00 | EUR | German GfK Consumer Confidence Sep | 10.8 | 10.8 | ||
| 6:45 | EUR | French GDP Q/Q Q2 P | 0.50% | 0.50% | ||
| 12:30 | CAD | Industrial Product Price M/M Jul | -0.50% | -1.00% | ||
| 12:30 | CAD | Raw Materials Price Index M/M Jul | -0.30% | -3.70% | ||
| 13:00 | USD | S&P/Case-Shiller Composite-20 Y/Y Jun | 5.60% | 5.69% | ||
| 14:00 | USD | Consumer Confidence Aug | 120.4 | 121.1 |
Market Morning Briefing: The Aussie Has Decent Support At 0.7900
STOCKS
Dow (21808.40, -0.02%) remained stable below 21900 and has equal chances of moving either towards 21950 or 21700 in the next couple of sessions. Dax (12123.47, -0.37%) on the other hand may remain sideways ranged within 11940-12350 zone as mentioned yesterday.
Nikkei (19334.90, -0.59%) has moved lower and could test our initial target of 19200 on the downside in the next few sessions. A short corrective bounce is possible from 19200 before testing lower levels of 19000 in the longer term. Near to medium term looks bearish.
Shanghai (3364.44, +0.05%) continues to trade higher and we wait to see a break above 3375/80 to ensure bullishness to continue in the near term. Else a short dip is possible from 3380. Overall near term looks bullish just now.
Nifty (9912.80, +0.57%) could possibly test 9950 on the upside today. We need to watch price action closely; in case the index manages to sustain above 9950, it could move up afresh towards 10000-10050 levels again. Else a rejection from 9950 could bring it back towards 9800. For now we give equal chances of movement happening on either side and would like to wait for more clarity. However the weekly charts are indicative of an upmove.
COMMODITIES
Gold (1323) has been stable just above its crucial support of 1300 . The next possible resistance could be 1350. Yesterday, we had clearly mentioned that the current stability in the price is an indication of a base building before a sharp rise, as the bulls are getting stronger to shoot up above 1300 in the near term. The only concern is the near term overbought condition in Gold thus a short term price correction is needed towards 1300 before the next upside rally towards 1350
Silver (17.40) is also testing its resistance of 17.40. The immediate trading range could be 16.70-17.40 .
Copper (3.07) has moved up in line with our expectation. Immediate resistance is poised at 3.12 regions. Copper is highly overbought in near term time frame thus We might see a dip towards 3.00 levels to gather fresh buying momentum.
Brent (52.04) and WTI (47.40) are both trading sideways. While Brent may come off towards 50 while below 53.80, WTI could trade within 50.00-46.50 levels for some more time.
FOREX
Yen (USDJPY = 108.80) has strengthened, with North Korea coming back on the market's radar, and it seems the Low has been near 108.33. A Day Close below 108.60 and Week Close below 108.00 could be severely bearish. The Euro-Yen (130.19) is stable near yesterday's levels. But, as mentioned yesterday, a rise past 131.40 is needed to bring in more confidence.
The Euro (1.1967) has risen further since yesterday, seeing a High of 1.1986 in the US session yesterday. Support moves up to 1.18 now and a rise past 1.20 is more likely than not.
Some more strength in the Pound (1.2935) from yesterday, rising past earlier resistance at 1.2915. Might reach up to 1.30 also. The rise from 1.2775 over the last three days makes us reassess our earlier bearishness.
The Aussie (0.7925) has decent Support at 0.7900 and seems to be gearing up for a test of and rise past 0.80, along with a possible rise towards 1350 in Gold.
The Chinese Yuan (USDCNY = 6.6071) has fallen sharply over the last several days, but may have Support at 6.59. A bounce is possible from there. Dollar-Rupee trades near 63.90/95 on the NDF and is expected to have Support in the 63.80-70 region.
INTEREST RATES
Muted price action had been seen in German-US 2 Yr Spread (-2.08%) and the German-US 10Yr Spread (-1.76%) . The recent bounce in German-US 10Yr Spread had helped Euro to moved up in line with our expectation.
We had told that US 10Yr Yield could move lower while it is trading below 2.18 regions and today it is at 2.13.This could be a result of the renewed geopolitical tension between US and North Korea. The US 5Yr has good Support at 1.7%, while the 10Yr has good Support at 2.095%.. We have to monitor the US Security Council meeting on Tuesday.
The Japanese 5Yr JGB (-0.131%) and the 30Yr JGB (+0.83%) are hovering around their respective supports, suggesting a possible bounce.
We are also expecting bounce in UK 5Yr and 30Yr Gilt Yields as they are also testing Supports near current levels (5Yr 0.46% and 30Yr 1.60%).But the 10Yr is trading below its area of support and might moved lower towards 1.00 regions
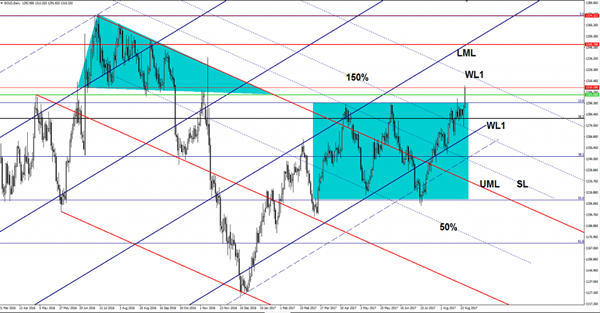
GOLD Eyeing A Dynamic Resistance
Gold registered an amazing rally and managed to climb much above the $1310 per ounce. The bulls are in full control and should lead the rate towards the first warning line (WL1) of the major descending pitchfork, where he could find temporary resistance again.