Sample Category Title
GBP/USD In The Buyers Territory
The currency pair has opened with a gap up in the early morning and reached fresh new highs. Has decreased a little, but only to close the gap. It maintains a bullish perspective on the short term because has managed to stay in the green zone. Should increase further as the USDX is expected to drop further if will stabilize under the 92.49 static support.
USDX is now pressuring the 92.49 static support, has dropped as much as 92.33 level, but has squeezed a little in the last few hours.
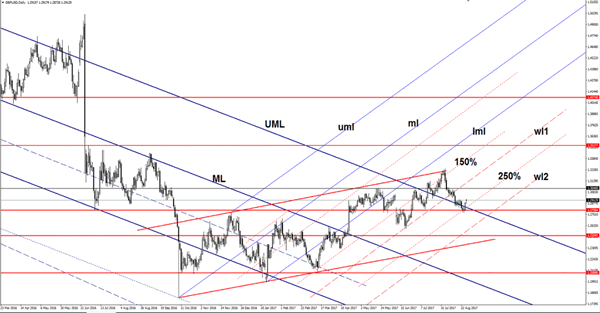
GBP/USD jumped higher in the morning and touched new highs, technically is expected to climb much higher in the upcoming period after the false breakdown below the upper median line (UML). The next upside target will be at the 1.3046 static resistance.
Should be attracted by the first warning line (wl1) of the ascending pitchfork after the false breakdown below the 250% Fibonacci line (ascending dotted line). Is trading within an ascending channel, so the perspective remains bullish, despite the minor retreat.Only a valid breakdown below the 1.2798 static support will confirm a further drop.
Gold Strongly Bullish
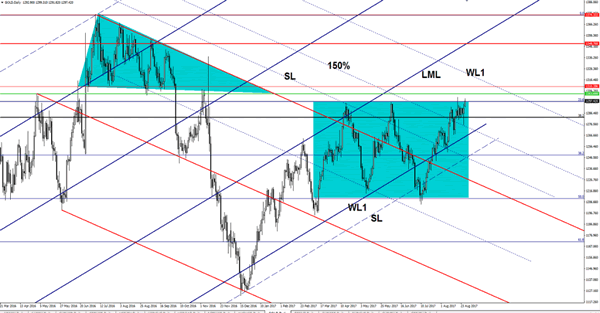
Gold edged higher after the USDX's sell-off and looks determined to make a valid breakout above the 23.6% retracement level and to stabilize outside the extended sideways movement. The next major upside target will be at the warning line (WL1) of the major descending pitchfork, could find temporary resistance at this level as well.
I've said in the previous reports that should climb much higher if the 38.2% retracement level will hold, has consolidated above this static support and has recaptured more directional energy, which will help it to hit new highs.
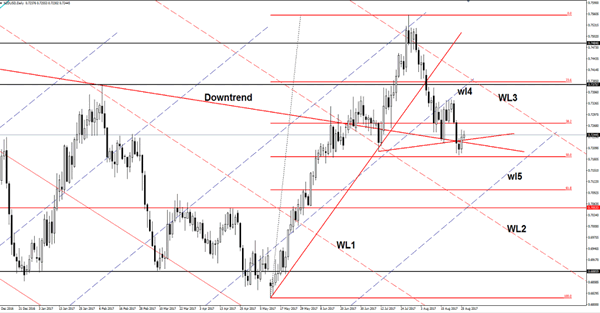
NZD/USD Is The Correction Completed?
NZD/USD is trading in the green right now, but failed to reach the 0.7257 Friday's high. Has managed to come back above the red downtrend and above the minor uptrend line. Looks like that the price action is developing a Falling Wedge pattern, but this is far from being confirmed. The false breakdown below the downtrend and the uptrend has invalidated a potential Head and Shoulders for now.
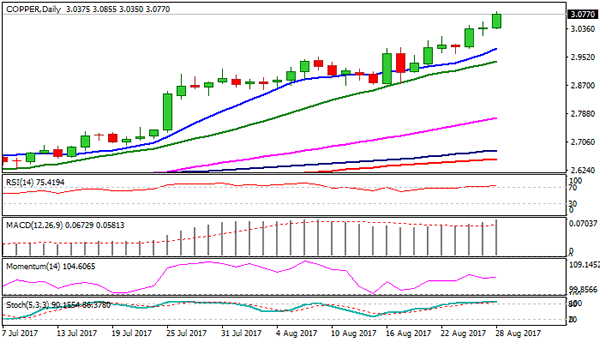
Copper on Fresh Bullish Acceleration
Copper contract for September delivery hit new nearly three-year high at $3.0855, on fresh bullish acceleration on Monday, which extends broader uptrend after rally paused on Friday, when action was shaped in Doji candle.
Copper continues trend higher, as strongly bullish technicals continue to underpin, however, bullish fundamentals dominate in the whole picture. The metal was boosted by weaker dollar and 8.2% fall in copper stocks, report released last week showed. In addition, strong demand from China, metal's top consumer, continues to inflate copper price.
The price is riding on extended wave C from 2.6300 (10 July trough), which eyes immediate target at 3.0973 (FE261.8%), with next strong barrier at 3.1114 (Fibo 61.8% retracement of larger 3.8380/1.9360, Sep 09/Jan 16 descend), also coming in focus.
No signals of easing for now, as daily indicators continue to head north, deeply in overbought zone, but some corrective action should be anticipated in coming days.
Res: 3.0855; 3.0973; 3.1114; 3.1655
Sup: 3.0606; 3.0350; 3.0165; 3.0000
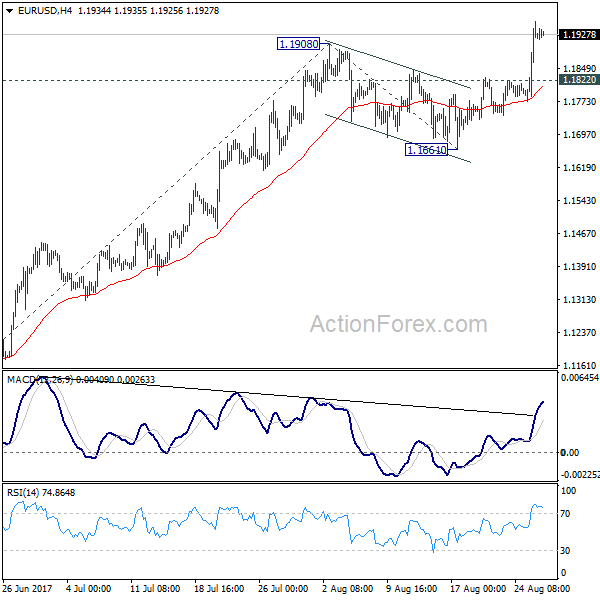
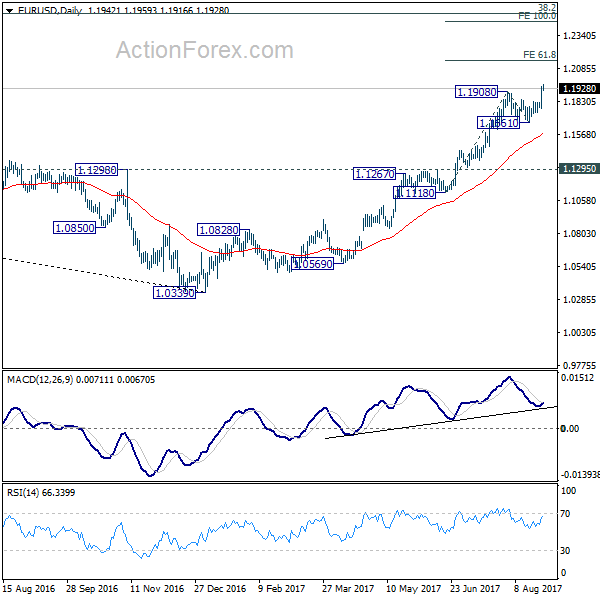
EUR/USD Mid-Day Outlook
Daily Pivots: (S1) 1.1817; (P) 1.1879 (R1) 1.1981; More...
EUR/USD's rise is still in progress and intraday bias remains on the upside. Current rally from 1.0339 should target 61.8% projection of 1.1118 to 1.1908 from 1.1661 at 1.2149 first. Break there will target 100% projection at 1.2451 next. On the downside, below 1.1822 minor support will turn intraday bias neutral first. But retreat should be contained above 1.1661 support and bring rise resumption.
In the bigger picture, an important bottom was formed at 1.0339 on bullish convergence condition in weekly MACD. Sustained trading above 55 month EMA (now at 1.1768) will pave the way to key fibonacci level at 38.2% retracement of 1.6039 (2008 high) to 1.0339 (2017 low) at 1.2516. While rise from 1.0339 is strong, there is no confirmation that it's developing into a long term up trend yet. Hence, we'll be cautious on strong resistance from 1.2516 to limit upside. For now, medium term outlook will remain bullish as long as 1.1295 support holds, in case of pull back.
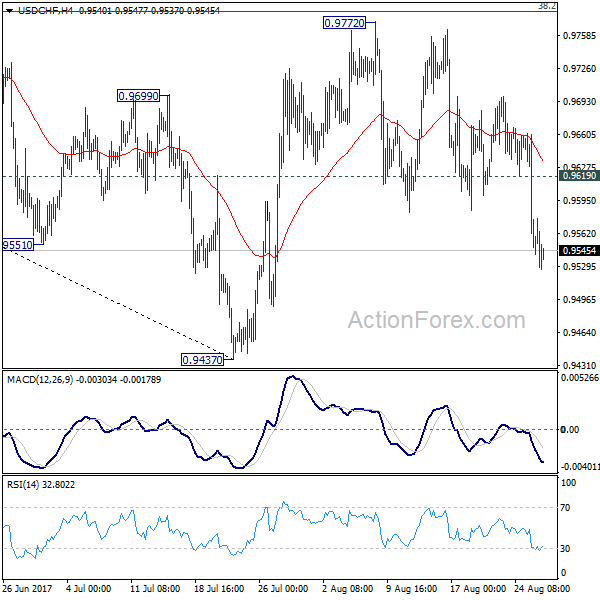
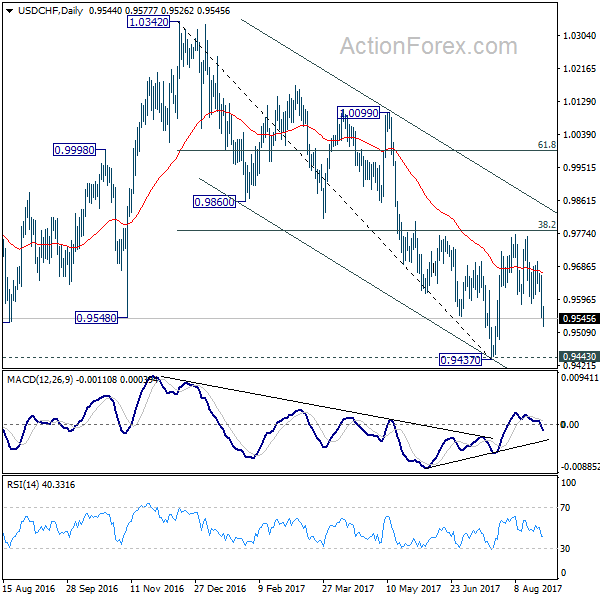
USD/CHF Mid-Day Outlook
Daily Pivots: (S1) 0.9522; (P) 0.9591; (R1) 0.9632; More....
USD/CHF's decline is still in progress and intraday bias remains on the downside for retesting 0.9437 low. Note again that the pair is bounded in medium falling channel and limited below 38.2% retracement of 1.0342 to 0.9437 at 0.9783. Break of 0.9427 will extend the whole decline from 1.0342 and carries larger bearish implications. On the upside, above 0.9619 minor resistance will turn intraday bias neutral again.
In the bigger picture, we're slightly favoring the case that USD/CHF has successfully defended 0.9443 key support level. And long term range trading in 0.9443/1.0342 is extending with another rise. At this point, there is no sign of an up trend yet. Hence, while further rise is expected in USD/CHF, we'll start to be cautious on loss of momentum above 61.8% retracement of 1.0342 to 0.9437 at 0.9996. However, firm break of 0.9443 will carry larger bearish implication and would target next key support at 0.9072.
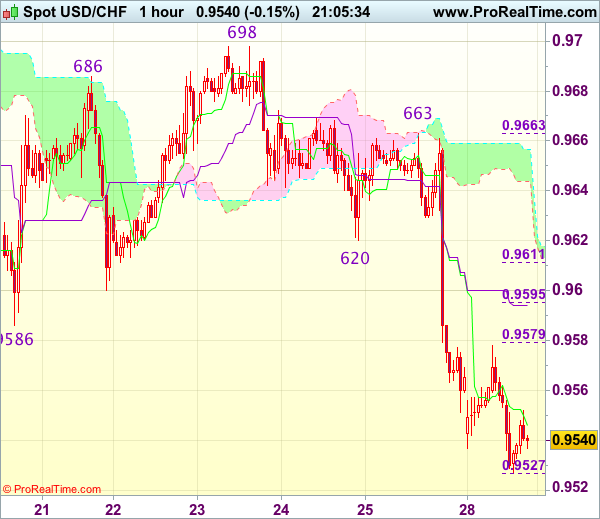
Trade Idea Update: USD/CHF – Sell at 0.9590
USD/CHF - 0.9547
Original strategy :
Sell at 0.9590, Target: 0.9490, Stop: 0.9625
Position : -
Target : -
Stop : -
New strategy :
Sell at 0.9590, Target: 0.9490, Stop: 0.9625
Position : -
Target : -
Stop : -
Friday’s selloff together with the breach of previous support at 0.9583-86 confirm top has been formed at 0.9773 earlier and bearishness is seen for the erratic decline from there to extend weakness to 0.9520-25, then towards support at 0.9490, however, near term oversold condition should prevent sharp fall below latter level. Looking ahead, A drop below 0.9490 would signal early downtrend has resumed and extend far to 0.9455-60 but recent low at 0.9438 should hold from here.
In view of this, we are looking to sell dollar on recovery as previous support at 0.9583-86 should turn into resistance and limit dollar’s upside, bring another decline. Above another previous support at 0.9620 would defer and suggest a temporary low is possibly formed, bring rebound to 0.9650 but still reckon resistance at 0.9663 would hold from here.
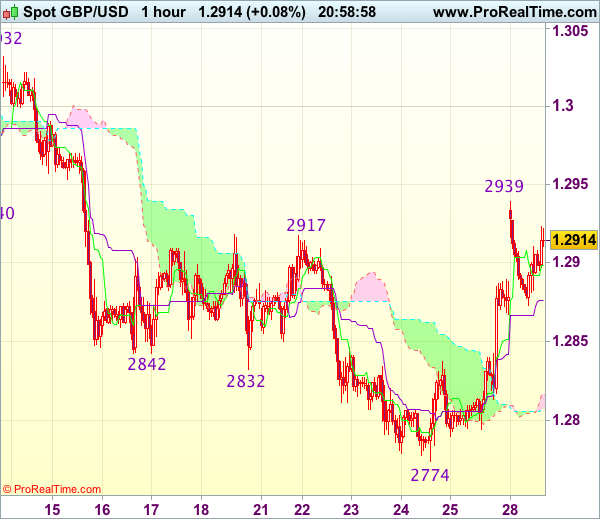
Trade Idea Update: GBP/USD – Buy at 1.2850
GBP/USD - 1.2912
Original strategy :
Buy at 1.2850, Target: 1.2950, Stop: 1.2815
Position : -
Target : -
Stop : -
New strategy :
Buy at 1.2850, Target: 1.2950, Stop: 1.2815
Position : -
Target : -
Stop : -
Although cable retreated after intra-day initial brief rise to 1.2939, as last week’s rebound from 1.2774 suggests a temporary low has possibly been formed there, reckon downside would be limited to 1.2850 and bring another rebound later, above said resistance at 1.2939 would add credence to this view and extend the rise from 1.2774 low for retracement of recent decline to 1.2970-80, then towards 1.3000 but price should falter below previous resistance at 1.3032.
In view of this, we are looking to buy sterling on pullback as 1.2850 should limit downside. Below previous resistance at 1.2837 would defer and risk test of 1.2810-15 but only break there would abort and signal the rebound from 1.2774 (last week’s low) has ended instead, risk weakness to 1.2775-80 first.
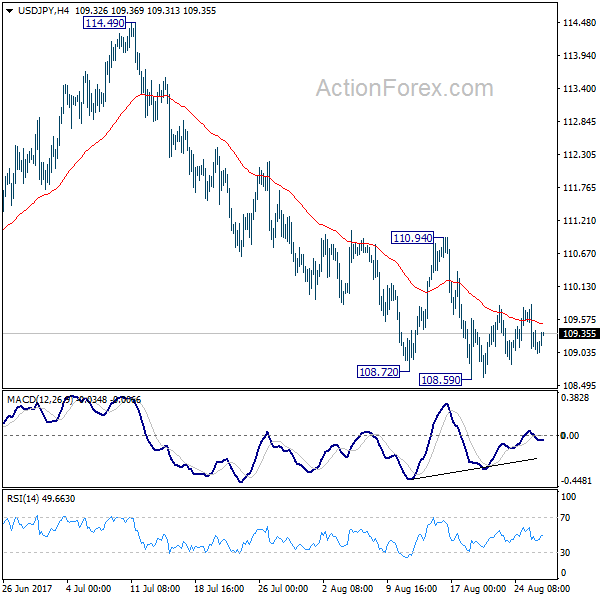
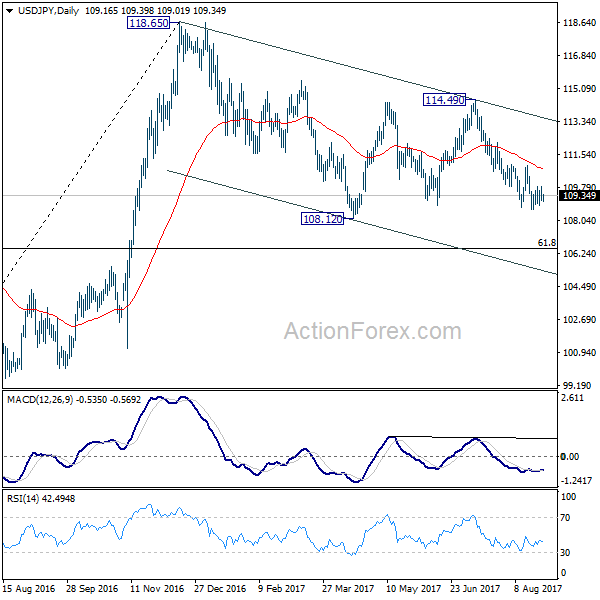
USD/JPY Mid-Day Outlook
Daily Pivots: (S1) 109.01; (P) 109.42; (R1) 109.74; More...
USD/JPY is staying in consolidation above 108.59 temporary and intraday bias remains neutral at this moment. Upside of recovery should be limited below 110.94 resistance and bring fall resumption. Break of 108.59 will target a test on 108.12 low. Whole corrective decline from 118.65 is possibly resuming and break of 108.12 will target 61.8% retracement of 98.97 to 118.65 at 106.48. Nonetheless, firm break of 110.94 will indicate short term bottoming and turn bias back to the upside.
In the bigger picture, the corrective structure of the fall from 118.65 suggests that rise from 98.97 is not completed yet. Break of 118.65 will target a test on 125.85 high. At this point, it's uncertain whether rise from 98.97 is resuming the long term up trend from 75.56, or it's a leg in the consolidation from 125.85. Hence, we'll be cautious on topping as it approaches 125.85. If fall from 118.65 extends lower, downside should be contained by 61.8% retracement of 98.97 to 118.65 at 106.48 and bring rebound.
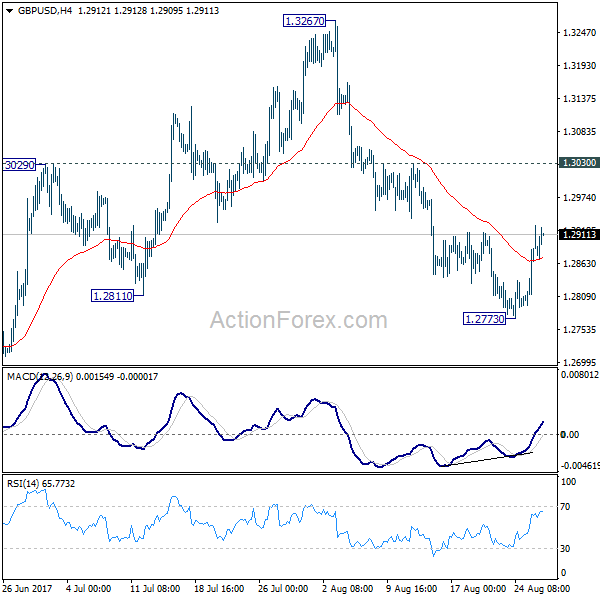
GBP/USD Mid-Day Outlook
Daily Pivots: (S1) 1.2816; (P) 1.2852; (R1) 1.2911; More...
GBP/USD's recovery from 1.2773 continues today but it's staying well below 1.3030 resistance so far. Intraday bias remains neutral with mildly bearish near term outlook. We're favoring the case that correction from 1.1946 is completed at 1.3267. Below 1.2773 will target 1.2588 key near term support first. Decisive break of 1.2588 will confirm our view and target a test on 1.1946 low. Though, break of 1.3030 will dampen this bearish view and turn bias back to the upside for retesting 1.3267.
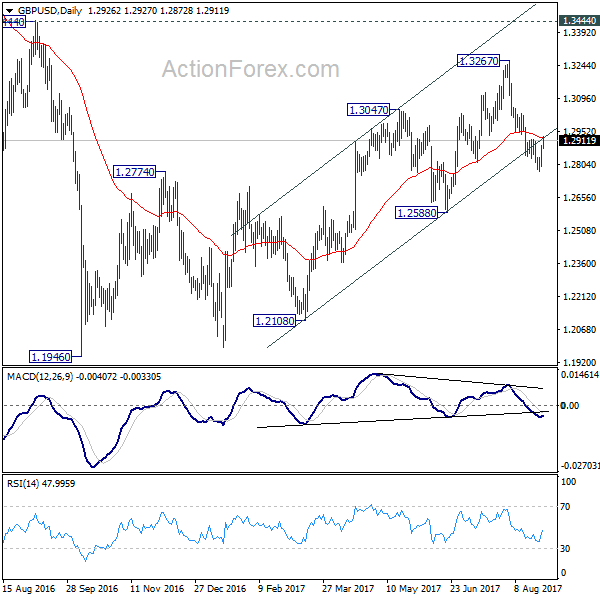
In the bigger picture, overall, price actions from 1.1946 medium term low are seen as a corrective pattern. While further rise cannot be ruled out, larger outlook remains bearish as long as 1.3444 key resistance holds. Down trend from 1.7190 (2014 high) is expected to resume later after the correction completes. And break of 1.2588 will indicate that such down trend is resuming.