
Sample Category Title
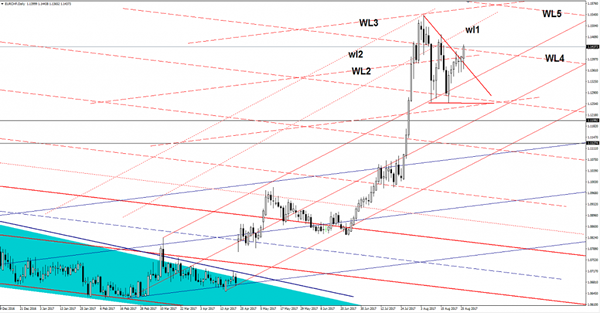
EUR/CHF Valid Breakout?
Price rallied today and extends the upside movement, remains to see if will have enough directional energy to stabilize above the fourth warning line (WL4) of the descending pitchfork. Has managed to jump much above the minor red downtrend line, signaling that the bulls are in control.
The upside movement is a natural one after the retest of the upper median line (uml) of the minor ascending pitchfork.
AUD/USD At New Highs
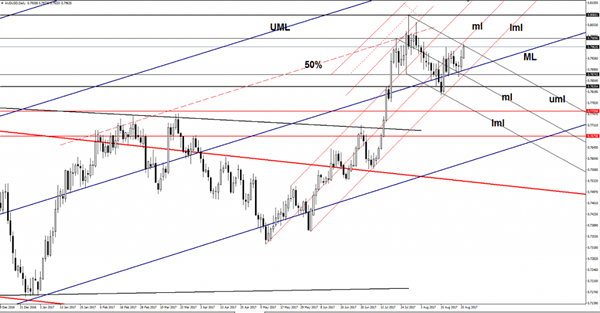
AUD/USD edges higher and resumes the minor rebound. Technically should climb much higher as the rate is located in the green zone. USD lost more ground versus the Aussie as the dollar index has plunged since Friday's session.
Price reached an important dynamic resistance, but is somehow expected to take this out and to resume the upside movement because the USDX could drop much deeper in the upcoming days. The dollar index is trading much below the 92.49 critical support, a retest of this level will confirm a further drop on the short term and a USD's depreciation versus all its rivals.
Personally, I believe that only some impressive US data could save the greenback from the downside, the US CB Consumer Confidence will be released in the afternoon and is expected to decrease from 121.1 to 120.3 points.
AUD/USD resumed the last week’s rally, but has found temporary resistance at the upper median line (uml) of the descending pitchfork. You can see on the daily chart that has failed to retest the median line (ml) of the minor ascending pitchfork, but could still hit this in the upcoming hours.
Is expected to climb much higher after the false breakdown below the median line (ML) of the major ascending pitchfork. We’ll have an important upside target at the 50% Fibonacci line (ascending dotted line), could approach also the 0.8065 horizontal resistance.
Gold Breaks Higher As North Korea Fires Missile Over Japan
Well, I use the word good in the loosest sense of the word after North Korea launched a ballistic missile this morning that flew over the northern Japanese island of Hokkaido.
With markets just starting to ignore the current NK regime, they certainly took notice again today with Japan forced to issue take cover notices to their citizens in what is being described as the most brazen provocation under Kim Jong Un's five-year-long rule.
Trump talked the talk and it looks like Un has essentially tried to call his bluff. Where we go from here, I'm not sure but markets aren't just taking this as routine, as you can see by the price of Gold going gangbusters on the charts below.
First up, let's take a look at the significant weekly level that is now into the rear-view mirror:
XAU/USD Weekly:
Taking a step down into the daily charts, if you remember from last week, we were watching gold hugging a daily trend line that you can see in that link. I've removed the line because price didn't break down and now all that matters is the fact that it's above this horizontal level:
XAU/USD Daily:
Is this the scenario that you're looking for?
Your move Trump… Your move…
Best of probabilities to you.
Gold And Silver Liftoff As Dollar Dumped And North Korea Tests
Renewed dollar selling and a North Korean missile test supercharge gold and dragging silver higher.
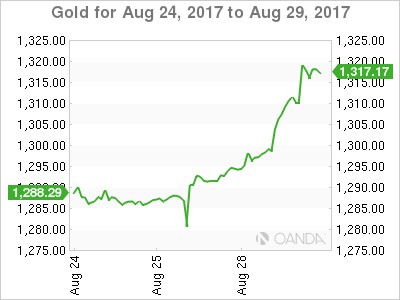
Gold
Gold powers higher in early Asia, leaping from 1310 to 1325 at one stage as North Korea conducted a missile test that flew over Japan. Gold has pulled back since as USD/JPY, and the Nikkei regained some of their losses but still sits AT 1318.00, up 0.60% on the day. Risk aversion following this morning’s missile test should see gold bid on any dip from these levels.
The events of this morning have somewhat overshadowed gold’s performance in the New York session where gold proceeded directly to go and put in a monster 20 dollar rally from its opening 1290.00 level. Trump’s negative comments on the NAFTA renegotiation and no tightening signals from Jackson Hole see U.S. dollar selling renew with vigour in New York.
Gold broke the previous monthly high at 1301.00 with ease which will now become an intraday pivot level. The momentum of the rally is impressive although we note that the daily relative strength index is entering an overbought territory which may slow gold’s ascent temporarily in the absence of any more geopolitical tensions.
Nevertheless, with the U.S. dollar and stock markets under pressure, today gold should find support at 1310.00, and its initial target around 1337.00 is now well and truly in sight, perhaps sooner rather than later.
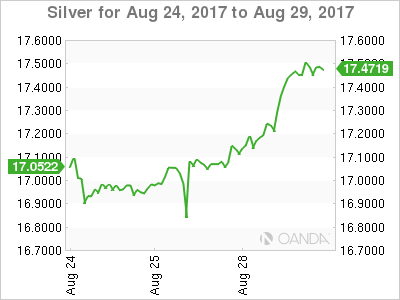
Silver
Silver also enjoyed an excellent overnight session, moving higher in a straight line from its 200-day moving average and daily support at 17.0400, some 40 cents to 17.4400. In the process taking out the top of its ascending triangle and initial resistance at 17.3900, now intra-day support, to close at 17.4500.
Silver’s next target now becomes the May high at 17.7600 with a daily close above here implying a technical move above 18.0000 is possible. Silver has had a more muted start in Asia than gold, trading slightly higher to 17.4800 in early trading.
Oil, Light Sweet Dreams Are Made Of This
Contrasting fortunes for oil with Brent supported by OPEC, and Hurricane Harvey is washing WTI away.
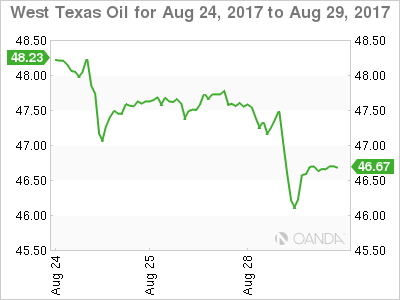
WTI Spot
WTI fell by some 2.60% overnight as while gasoline futures rose by 3.50% in a somewhat counterintuitive price action. What the street is clearly pricing in as the effects of Hurricane Harvey’s flooding become apparent, is that the United States has plenty of crude oil, the difficulty will be refining it into usable products and then moving it to where it is needed. This may well prove a boon to Asian refiners, who have the immediately available refining capacity, should capacity in Texas and Louisiana be taken offline for a long time. With refiners in Asia suddenly needing to fulfill orders for gasoline and jet fuel for shipment to the U.S.
At this stage, it is still unclear what the final disruption will be, but there is no denying that WTI crude has suffered a very bearish technical development overnight, breaking out of the lower boundary of its recent triangle pattern. WTI spot touched 46.00 overnight becoming initial support, before recovering to 46.70 in early Asia trading. The next support is seen at the 45.00 regions with initial resistance the base of the triangle, today at 47.20.
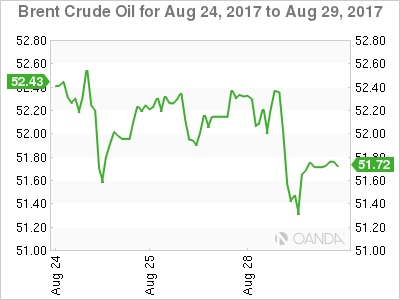
Brent Spot
The story is very different with Brent spot, which continues to trade constructively, dropping only 0.50% overnight. The near month futures are in backwardation, and the premium over WTI widened to multi-year highs. It has also been bolstered by news that Saudi Arabia and Russia are apparently lobbying the OPEC/Non-OPEC grouping to extend the production cut deal by three months to June 2018.
Brent spot trades midrange at 51.75 this morning with support at 51.20 followed by 50.00. Resistance appears at 52.50 initially and then 52.70 as it continues to consolidate its recent gains supported by more sound fundamentals.
USD/CAD Canadian Dollar Lower On Monday Ahead Of US Jobs Data
The Canadian dollar started the week in a tight range against the US dollar. Hurricane Harvey continues to wreak havoc in Texas and has hit the energy sector as it has forced refineries to close and has sent gasoline prices soaring. The US dollar staged a comeback near the end of the Monday trading session and is looking ahead at the economic calendar release for further support. Trump also sent a tweet calling the NAFTA approach of Canada and Mexico as very difficult. Canadian Prime Minister Justin Trudeau spoke about Trump’s comments on Monday saying there was nothing new and vowed to remain at the negotiating table to modernize the agreement.
The NAFTA pairs remain under pressure against the USD with the Peso dropping 1.281 percent and the USD gaining 0.163 versus the CAD. The USD was left rudderless last week as the Fed Chief Janet Yellen chose to comment on regulation on what could be her last appearance as central bank chair at the Jackson Hole summit. US employment data is the highlight this week, with a special emphasis on wage growth data to look for signs of inflation.
US employment will guide markets as the ADP private payrolls report to be released on Wednesday, August 30 at 8:15 am starts the jobs data rollout. Analysts are forecasting a 186,000 job gain following the 178,000 jobs added in July. The biggest indicator will be released on Friday, September 1 at 8:30 am when the Bureau of Labor Statistics publishes the U.S. non farm payrolls (NFP). The last two months have exceeded expectations and the market is anticipating a 180,000 addition of new positions in August. Inflation data in the job reports will be highlighted as the Fed appears to be slowing down on its tightening policy as wages and prices remain sluggish even as the number of jobs have been steady throughout the recovery.
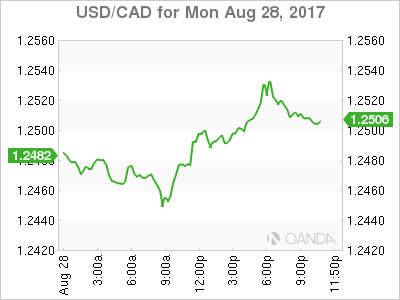
The USD/CAD rose 0.163 percent on Monday. The currency pair is trading at 1.2502 after trading on a tight range at the beginning of the week. The loonie has been decoupled from oil prices as crude ended the week on a negative note even as Hurricane Harvey could disrupt Gulf energy producers. NAFTA talks have grabbed headlines as Donald Trump has once again threatened to pull out of the trade deal. In an effort to have a more productive first round of negotiations the three nations have signed NDAs. The trade talks kick off on September 1 in Mexico.
Canadian data will be sparse this week with the Raw Materials Price Index (RMPI) due on Tuesday at 8:30 am EDT and the Current account to be release on Wednesday at 8:30 am EDT two of the highlights. The main indicator release this week for CAD traders will bet the monthly GDP data due on Thursday, August 31 at 8:30 am EDT. The Canadian GDP is expected to have slowed down after a strong first half of the year. The Canadian economic release will be sandwiched between the ADP private payrolls report on Wednesday and the U.S. non farm payrolls (NFP) release on Friday.
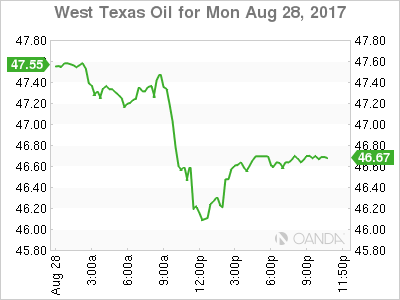
US energy prices dropped 2.261 percent in the last 24 hours. The price of West Texas Intermediate is trading at 46.64 after Hurricane Harvey has closed refineries and sent the price of gasoline higher while crude is falling. Demand for US crude will be lower as the open refineries will be backed up with oversupply while working overtime to take advantage of the rise of gasoline prices. Crude inventories will rise which has affected the price of WTI while Brent has fallen only by 0.827 percent in the same period.
Weekly inventory data for the US due on Wednesday will give insights on the state of stocks last week, but can have an effect on this week’s prices as a larger buildup is now being priced in for next week’s report.
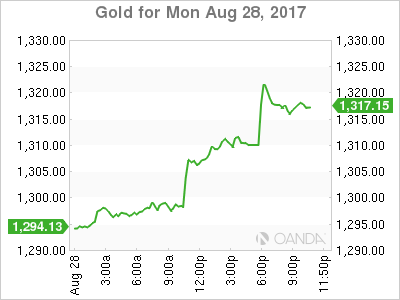
Gold prices rose on Monday by 1.473 percent. The yellow metal is trading at $1310.47 and continues near daily highs after the central bank summit in Jackson Hole brought little information on the paths of the U.S. Federal Reserve and the European Central Bank (ECB) leaving the USD weaker. The political turmoil in Washington will be compounded with the ongoing disaster relief in Texas due to Hurricane Harvey. The Trump administration has too many fronts open and the US currency will be awaiting for employment data in search of positive news.
Gold is near 11 month highs after the comments of Fed Chair Janet Yellen and European Central Bank (ECB) President Mario Draghi focused on regulation and trade and sidestepped the hot topic of monetary policy. The Fed is now expected to slow down its rate hike path after a rate hike in December and the ECB has not committed to a hard timeline on reducing its QE program despite the pressure from Germany. The precious metal had been under pressure from a united front of central banks pushing for an end to low rates. Uncertainty in the US political system has proven to support gold prices as geopolitical issues have escalated with North Korea and some barbs have been fired ahead of the NAFTA renegotiation.
Market events to watch this week:
Tuesday, August 29
10:00 am USD CB Consumer Confidence
Wednesday, August 30
8:15 am USD ADP Non-Farm Employment Change
8:30 am USD Prelim GDP q/q
10:30 am USD Crude Oil Inventories
9:30 pm AUD Private Capital Expenditure q/q
Thursday, August 31
8:30 am CAD GDP m/m
8:30 am USD Unemployment Claims
9:45 pm CNY Caixin Manufacturing PMI
Friday, September 1
4:30 am GBP Manufacturing PMI
8:30 am USD Average Hourly Earnings m/m
8:30 am USD Non-Farm Employment Change
10:00 am USD ISM Manufacturing PMI
GBPUSD – Eyes Recovery Higher Towards The 1.3030 Zone
GBPUSD - The pair remains biased to the upside as it faces recovery higher threats. Support lies at the 1.2900 level where a break will turn attention to the 1.2850 level. Further down, support lies at the 1.2800 level. Below here will set the stage for more weakness towards the 1.2750 level. Conversely, resistance stands at the 1.2950 levels with a turn above here allowing more strength to build up towards the 1.3000 level. Further out, resistance resides at the 1.3050 level followed by the 1.3100 level. On the whole, GBPUSD continues to face upside risk on correction higher.
Gold, Yen Overshoot On Korean Missiles
Just as Hurricane Harvey was grabbing the headlines by further damaging USD bulls via ongoing dilution of hopes for a Fed December hike, safe-haven assets shot up after on news from Japan that N. Korea has launched a missile in the direction of Japan, passing over the island of Hokkaido and landed about 1000 km from East Japan. Both Premium longs in gold and silver hit their final targets -- (XAUUSD from 1222 entry to 1300 final & XAGUSD from 15.90 entry to 17.50 final). The chart below shows the strongest and weakest currrencies/metals since 10 pm London.
Earlier on Monday, gold confirmed its technical break as it climbed $20 to $1311, before pushing to $1324 following PyongYang's missile strikes. The initial gold was Hurricane Harvey. The loss of economic activity due to the storm will hit Q3 GDP and cloud the picture on growth and inflation for months. That makes the Fed less likely to hike in December. With Draghi also reluctant to curb QE, gold is signaling more-dovish global central banks.
Earlier, the Chinese yuan jumped to start the week while the Shanghai Composite broke above a major triple top in a pair of moves that didn't get much attention. For the yuan, it was the ninth consecutive gain and a 14-month high. There can be little doubt that Beijing is allowing the currency to strengthen. The renminbi could be headed for another bout of turbulence if the reports out of Washington are true.
They say Trump is hell bent on slapping some kind of tariff on China as he attempts to score points on trade. The machinations of FX moves in China are always tough to decipher. For stocks, there has been good news for corporate earnings but the two-day, 2.7% rise is tough to justify on fundamentals. Technically, however, the break is compelling and the index is now less-than 9% from the 2015 highs.
Elliott Wave Trade Ideas Performance Update
2 positions were entered last week with total profit of 200 points and the positions are listed below.
18 Aug : AUD/USD - Long at 0.7895,
18 Aug : USD/CAD - Short at 1.2690, exited at 1.2490 (+ 200 points)
| AUD EUR/JPY EUR/GBP CAD GBP GBPJPY
Jan - 15 -275 - 35 -120
Feb + 140 -17 - 40 +11
Mar - 20 +115 +132 - 19
Apr + 30 - 40 +120 + 45
May - 55 +100 - 6 -65 -60
Jun + 81 +150 - 10 +185 -120 +205
Jul - 40 - 60
Aug +150 0 + 100 + 200 +15 - 50
Sep
Oct
Nov
Dec
Y-T-D + 366 - 82 +167 +663 -170 +80
Candlesticks and Ichimoku Trade Ideas Performance Update
3 positions were entered among all 4 currency pairs with total profit of 75 points and the positions are listed below:
22 Aug : EUR/USD - Long at 1.1765, exited at 1.1865 (+ 100 points)
24 Aug : USD/CHF - Long at 0.9620, exited at 0.9595 (- 25 points)
28 Aug : USD/JPY - Long at 109.25,
| JPY EUR CHF GBP
Jan + 167 - 85 - 10 + 50
Feb + 200 +150 +93 - 59
Mar -23 -70 -23 - 35
Apr + 65 + 93 + 50 - 40
May - 65 - 35 + 100 -175
Jun -100 -10 - 10 +175
Jul + 85 - 35 - 8
Aug + 60 +245 + 35 -35
Sep
Oct
Nov
Dec
Y-T-D + 388 +248 +227 -109